Roundtable Readers versus Baseball Writers – The 2024 Baseball Hall of Fame Results

The 2024 Baseball Writers of America Baseball Hall of Fame ballots have been announced – and congratulations to Adrian Beltre, Todd Helton and Joe Mauer – worthy candidates all.  In this post, I’ll be taking a look at the differences (and similarities) between the official BBWAA results and Baseball Roundtable’s unofficial reader/fan balloting.  YOu’ll find some (handy?) charts at the end of the post.

Spreading Out the Love

The 83 reader respondents and the 385 official BBWAA voters voted for about an equal number of players per ballot.  The writers averaged 7.0 players per ballot, the readers 6.9 (a year ago, those figures were 5.9 and 6.2, respectively). The readers, however, spread out their support a bit more. Among readers 14 of the 26 players on the ballot (53.8%) got at least 20 percent of the vote, as compared to ten (38.5%) for the writers.

Getting that Magic 75 Percent

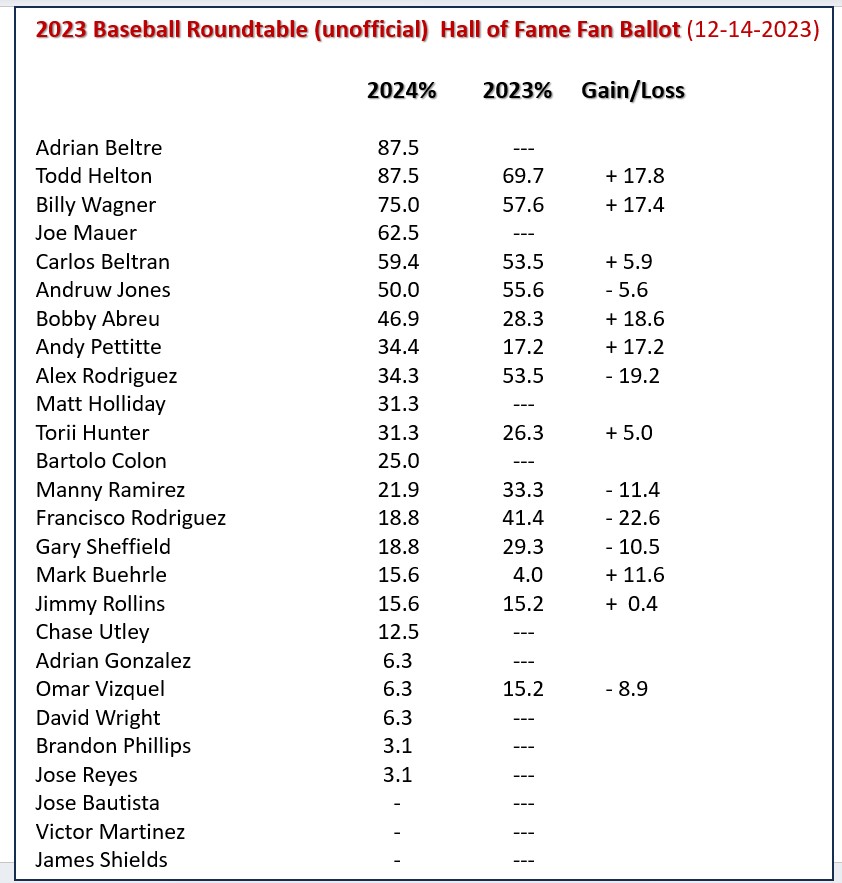
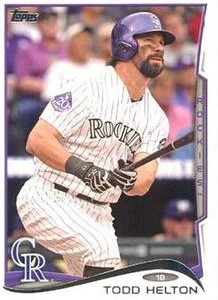
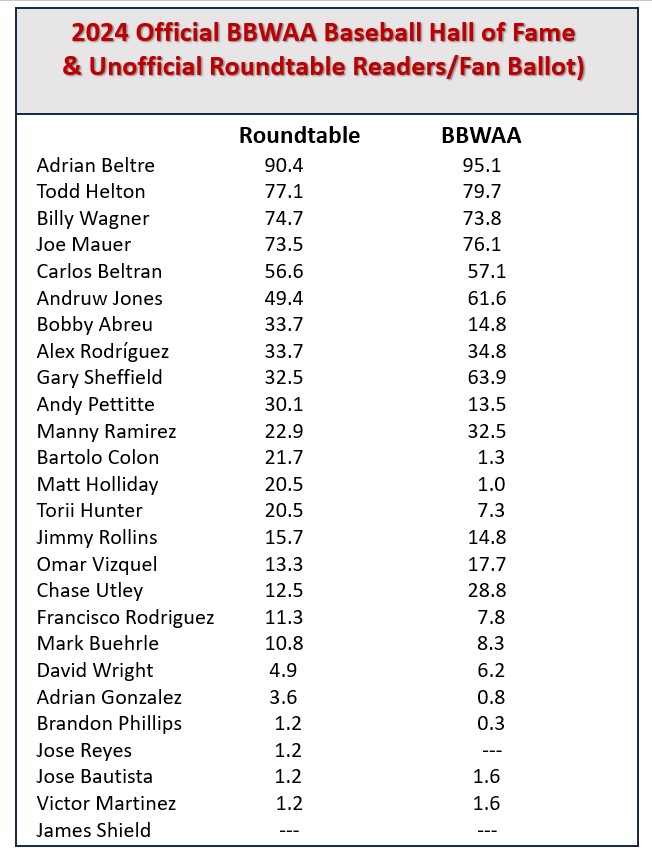
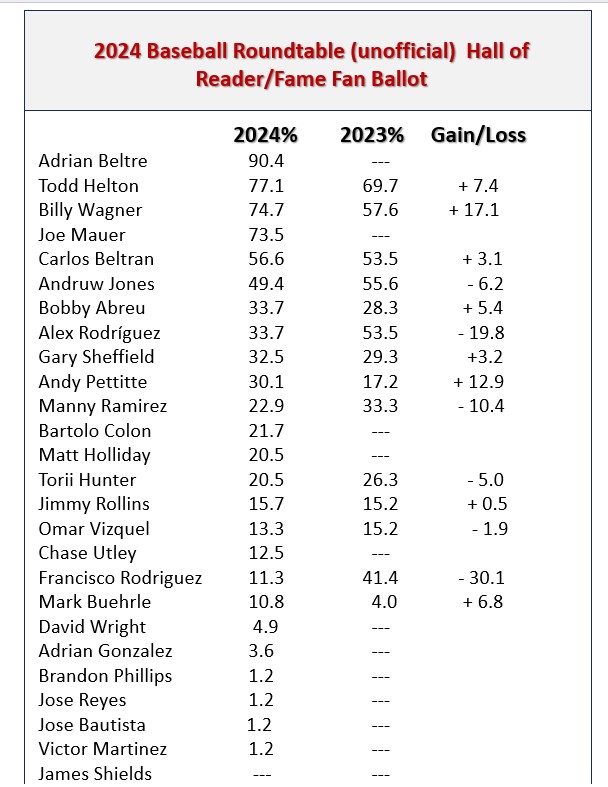
Among readers, only two players received the 75-percent support required in the BBWAA voting – First-time candidate Adrian Beltre (90.4%) and Todd Helton (79.7% in his sixth year on the ballot). Coming very close were first-timer Joe Mauer (73.5%) and nine-timer Billy Wagner (74.7%.) The most significant difference, of course, was that Mauer got the necessary 75-percent support among the writers, but fell short among Roundtable readers.  In reality, it was not much of a difference.  Mauer got 76.1 percent of the writer vote and 73.5 percent among Roundtable reader respondents. (Two more reader votes would have put him at 75.9%.)

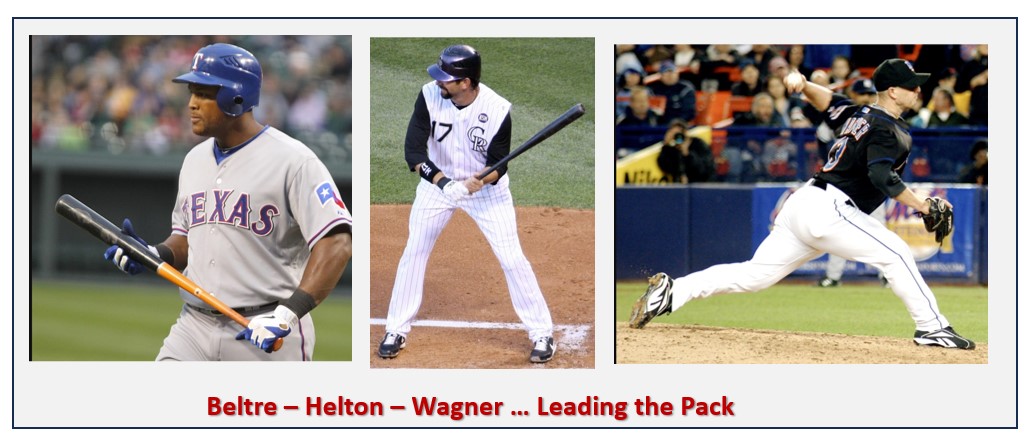
The top four players on both tabulations were: Beltre, Helton, Joe Mauer and Wagner (although Wagner and Mauer finished 3-4 with the writers and flipped to 4-3 for the readers.)

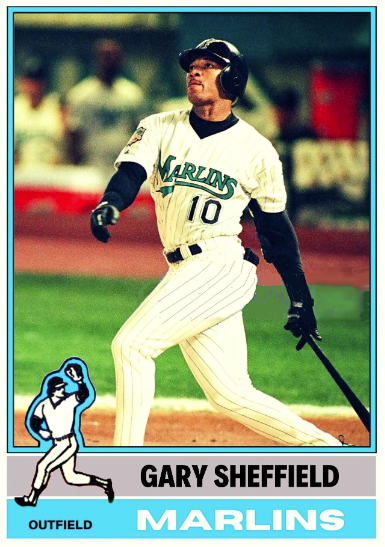
The biggest variable came at number five, where Gary ‘Sheffield got a boost from the writers in his final year on the ballot, going from 55,0% to 63.9, but still falling short. Sheffield finished ninth on the reader voting at 32.5%.

Other notable variations:

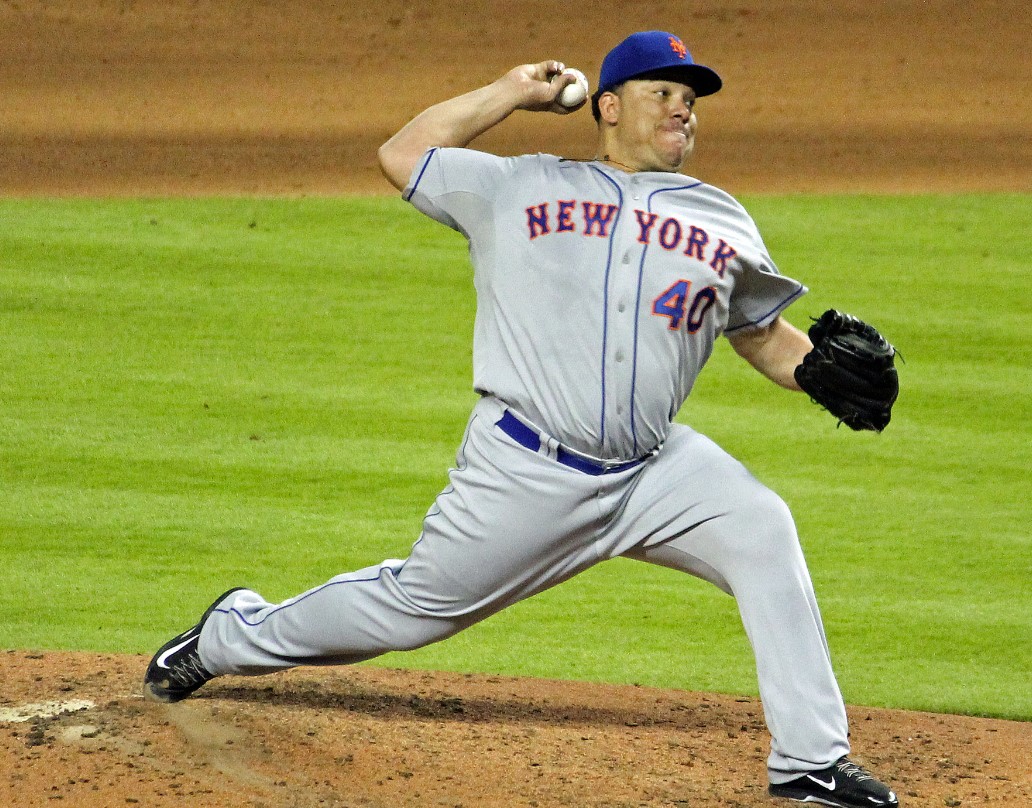
  • First-timer Bartolo Colon long a fan favorite, got 21.7 percent of the reader vote to just 1.3 percent from the writers;
  • Chase Utley got 28.8 percent support from the writers, but just 12.5 percent from readers.
  • Matt Holliday fell of the ballot with only 1.0 percent the writers, but got 20.5 percent of the reader vote.

Gainers and Losers

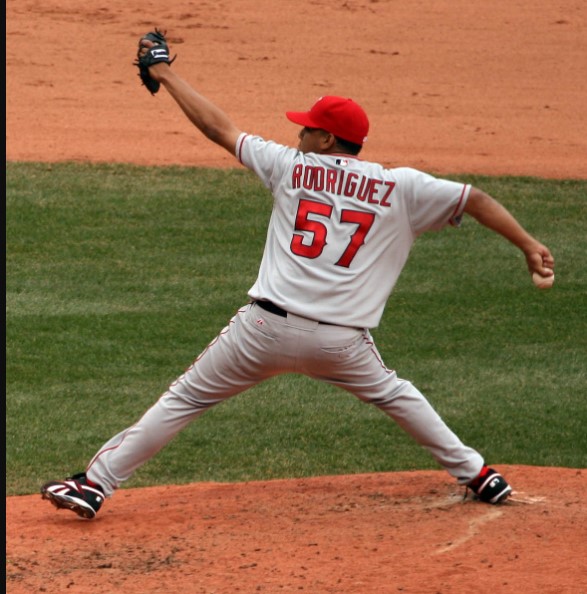
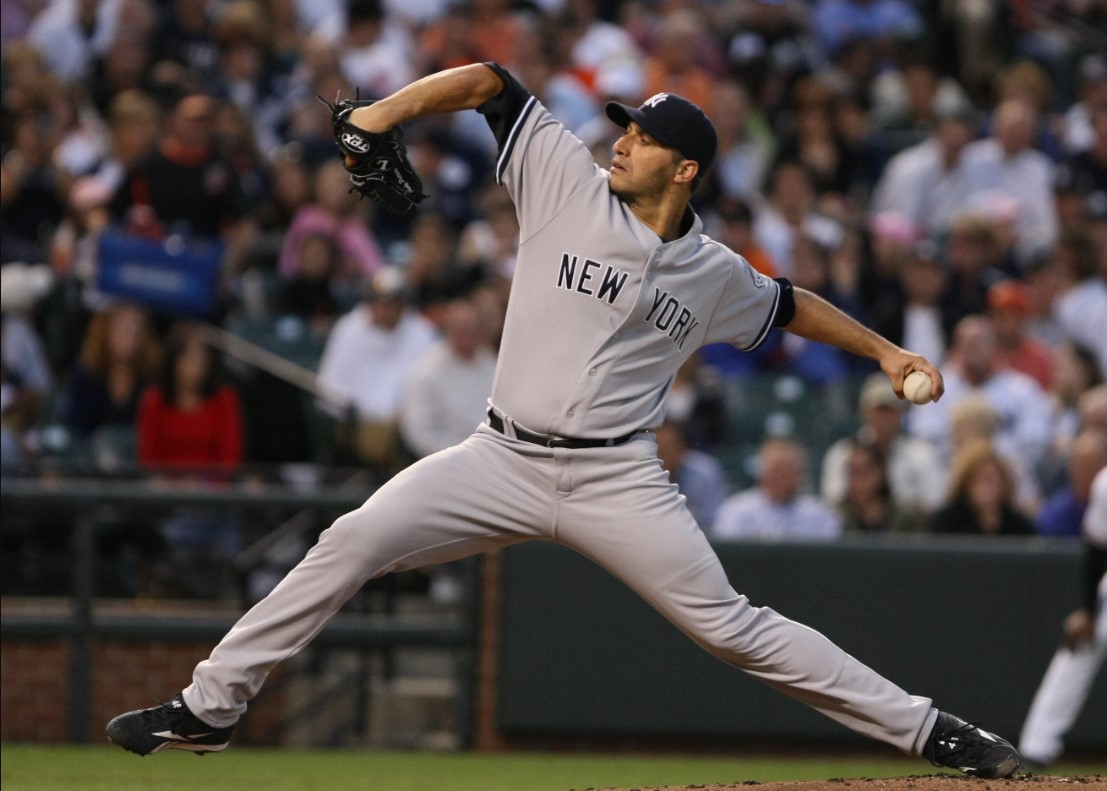
The biggest gainers on the fan ballot were Billy Wagner (up 17.1 percentage points) and Andy Pettitte (up 12.9).  The largest declines were Francisco Rodriguez  (down 30.1 percentage points) and Alex Rodriguez (down 19.8).  Note: Francisco Rodriguez was a bit outlier in 2023, with 42.4 percent in the reader balloting and just 10.8 percent from writers. Things were more aligned in 2023, 7.8 percent  from the writers and 11.3% from the readers.   

In the official BBWAA voting the movement was not as notable.  biggest gainers were Carlos Beltran (up 10.6 percentage points) and Gary Sheffield (up 8.9) while the largest decline was attributed to Andy Pettitte (down 3.5 percentage points).

Off The Ballot

Things were pretty even here.  Eight players receive less than the five percent needed to stay on the official ballot, while seven fell below that mark on the reader ballot. A couple of differences:

  • David Wright made the cut on the writers’ ballot (6.2%), but fell just short on the readers’ poll (4,9);
  • Bartolo Colon, as noted earlier, did well with readers, but  got only 1.3 percent from writers. The same was true of Matt Holliday, with 20.5 percent from readers, just one percent from writers.

Who Missing?

When asked which players no longer on the ballot, they would like to see in the Hall of Fame, readers named 33 different players. Here’s a list of the players mentioned on more than one reader ballot (number of mentions in parentheses).

Barry Bonds (9)

Roger Clemens (9)

Jeff Kent (9)

Lou Whitaker (6)

Pete Rose (5)

Don Mattingly (3)

Mark McGwire (3)

Dick Allen (2)

Dwight Evans (2)

Bobby Grich (2)

Ron Guidry (2)

Keith Hernandez (2)

Thurman Munson (2)

Luis Tiant (2)

Players with one mention: Ken Boyer, Jim Creighton, Bill Dahlen, Rap Dixon, Curt Flood, Steve Garvey, Joe Jackson, Tommy John, Kenny Lofton, Roger Maris, Dale Murphy, Joe Nathan, Al Oliver, Rafael Palmeiro, Dave Parker, Johan Santana, Curt Schilling, Urban Shocker, Sammy Sosa.

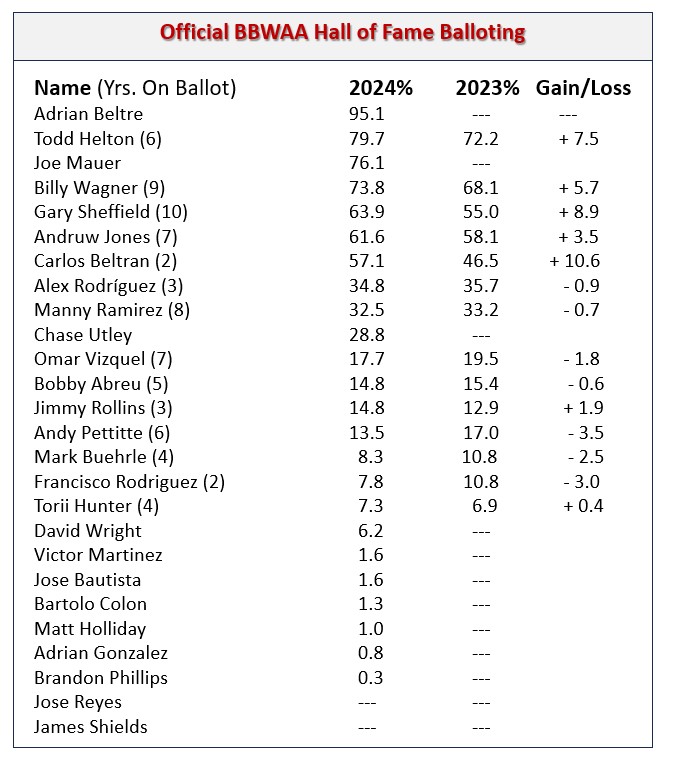
Side Note: Still waiting for confirmation, but the winner of the prize drawing was a Pennsylvania reader.  The prize includes a 1990 Topps Set; A 1986 Topps Traded Set; a Bill Murray minor-league (in uniform) bobblehead; a “The Wizard” replica Cardinals’ Nickname Day jersey; and 1960’s Coke and Fresca bottlecaps with Willie Mays and Bill Mazeroski on the inside.

Primary resources:  baseball-reference.com

Baseball Roundtable – Blogging Baseball Since 2012.

100Baseball Roundtable is on the Feedspot list of the Top 100 Baseball Blogs.  To see the full list, click here.

Baseball Roundtable is also on the Anytime Baseball Supply Top 66 Baseball Sites list.  For the full list, click here

I tweet (on X) baseball @DavidBaseballRT

Follow Baseball Roundtable’s Facebook Page here

Member: Society for American Baseball Research (SABR); Negro Leagues Baseball Museum; The Baseball Reliquary.

P1021

An Exercise in Futility – Bad Days in the Batter’s Box

Most baseball fans are aware of the fact that on May 1, 1920, the Brooklyn Robins and Boston Braves played in MLB’s longest-ever (by innings) MLB game – a 26-inning 1-1 tie in Boston. It’s also well-known that both starting pitchers Joe Oeschger and Leon Cadore “went the distance.”  Those are a couple of records (length of game and length of a pitching appearance), that are pretty much unbreakable.

Photo: Public domain, via Wikimedia Commons

A Good Pick for A tough Day as a “Hitter

As always with Baseball Roundtable “one thing leads to another” and perusing the box score of that Oeschger/Cadore game led to another record that has stood the test of time.  Braves’ 2B Charlie Pick – batting second, did not reach base a single time in eleven plate appearances. That zero-for-eleven represents the MLB record for plate appearances in a game without reaching base, as well as the record for the most times a specific batter was retired by the same in pitcher in the same game (in baseball, we do track everything).   This, of course, was another thing that led to another – and this post will look at some of the most futile days spent in the batter’s box in MLB history.

But first, let’s finish with Charlie Pick.  Pick was no pushover. He came into the game hitting a robust .324 over the Braves’ first nine games of the season. (He would finish the season at .274.) Here’s how his day went:

  • First inning – Pop out to second;
  • Third inning – Foul pop to catcher;
  • Fifth inning – Fly out to RF;
  • Seventh inning – Ground out to pitcher;
  • Ninth inning – Grounded into a second-to-first double play;
  • Twelfth inning – Fly out to CF;
  • Fourteenth inning – Strikeout (looking);
  • Sixteenth inning – Ground out second-to-first;
  • Nineteenth inning – Fly out to RF;
  • Twenty-second inning – Fly out to CF;
  • Twenty-fifth inning – Pop out to shortstop.

Over the course of the game, Pick’s average dropped from .324 to .250.

Pick played in six MLB seasons (1914-16, 1918-20 … Nationals, Athletics, Cubs, Braves), hitting .261-3-86 in 367 games.

Side note: The only other player in the Braves’ lineup that went hitless that day was catcher Mickey O’Neil – and he was pulled for a pinch hitter in the bottom of the ninth after going zero-for-two with a sacrifice bunt.

A Hard Day’s Night

The only other player to record a .000 on-base percentage in eleven plate appearances in a single game is Twins’ shortstop Danny Thompson – and he falls slightly behind Pick here, since Thompson actually got on base once (via a fielder’s choice) and scored a run. On May 12, 1972, Thompson went zero-for-ten, with two strikeouts and one sacrifice in 11 plate appearances, as the Twins fell to the Brewers 4-3 in 22-innings (in Milwaukee).   Side note: Scoring rules on  a fielder’s choice are that the players is not credited with a hit or time on base, but does record  an at bat and plate appearance. )

Thompson’s feat was a bit unique in that it took place over two days. The first 21-innings took the teams into the morning of May 13 and – due to the rule that no inning could start after one a.m., the game was suspended with the score knotted at three apiece.  After a break of just over 12 hours, the game was resumed and the Brewers won it in the very first resumed inning. Unlike the 26-inning Robins/Braves game (above), the two teams used 13 pitchers and Thompson faced five different Brewers’ hurlers (the Brewers used six pitchers).  Fittingly, Thompson made the final out of the game (in the bottom of the twenty-second inning, facing Jim Lonborg.)

Thompson entered the game hitting .333 over 18 games. At the end of the 22 innings, his average was .294.  For the season, Thompson hit .276-4-48 over 144 games.  In a seven-season MLB career (1970-76 … Twins, Rangers), Thompson hit .248-15-194 in 694 games.  Thompson passed away on December 10, 1976, at the age of 29, from complications related to leukemia.

For those who like to know such things – the losing pitcher in the May 12 game was the Twins’ Bert Blyleven, who came in (after the suspension) to pitch the top of the twenty-second inning. After that one inning of work, Blyleven started the regularly scheduled May 13 game and pitched nine innings (three runs) in a 5-4, 15-inning Twins loss.  The winner in the May 12 game was the Brewers’ Jim Colborn, who pitched the fifteenth through the twenty-first innings (six hits, no runs). Lonborg got the save in the May 12 game – coming in on May 13 to pitch the final inning of the suspended contest. Lonborg then started the regularly slated May 13 contest and went four innings (six hits, five walks, three runs).  


April 15 … A Taxing Day for This Met

On April 15, 1968.  Mets’ RF and clean-up hitter Ron Swoboda fanned five times and went zero-for-ten, as the Mets lost to the Astros 1-0 in 25 innings (in Houston).  It’s the most strikeouts by any player in a game in which he had double-digits in plate appearances and a.000 on-base percentage. Surprisingly, the clean-up hitter ending up leading off an inning in six of his ten plate appearances. Swoboda’s game:

Second inning – Lead off fly out to RF of Don Wilson;

Fourth inning – Lead off pop out to first base off Wilson;

Sixth inning – One out (no one on base) strikeout off Wilson;

Eighth inning – Two out (no one on) strikeout off Wilson;

Eleventh inning – Lead off strikeout off John Buzhardt;

Thirteenth inning – Lead off fly out to CF off Danny Coombs;

Sixteenth inning – Lead off flyout to CF off Jim Ray;

Eighteenth inning – Two out (no one on) strikeout off Ray;

Twenty-first inning – Lead off strikeout off Wade Blasingame;

Twenty-third inning – Two out (no one on) flyball to RF off Blasingame.

Sidenote:  The second most strikeouts by a player with a zero on-base percentage in a game with at least ten plate appearances is four – by Swoboda’s teammate CF Tommy Agee in the same game.

Swoboda came into the game hitting .385 on the seasons (just four games) and left the field hitting .217.  He hit .242-11-69 on the season and .242-73-344 over his nine-season MLB career (1965-73 … Mets, Expos, Yankees).

Mirror Images?  More Roundtable “#one thing leads to another.”

The April 15, 1968 Mets Astros game went longer without a run scoring than any other game in MLB history. For the game:

  • Each time had one hit in 79 at bats – so each had a .139 average for the game;
  • Each team had ten singles and one double – each team had a .152 slugging percentage;
  • Each team left 16 men on base.
  • Each team made one error.
  • Each am turned one double play.
  • Each tram used four pinch hitters.

___________________________________________

Before we move on to some strikeout marks, the chart below shows all the MLB players with a .000 on-base percentage in a game of ten or more plate appearances. A few notes:

  • As you might expect, all the games were at least 22 innings;
  • The May 1, 1920, 26-inning Braves/Robins game accounts for three of the eight qualifiers;
  • Robins’ SS Chuck Ward is the only person to not strike out a single time while qualifying for this list;
  • Five games are included on the list and two of the five ended in 1-1 ties.

——–SOME STRIKING PERFORMANCES——–

Just eight players have fanned six times in an MLB game – and each of those instances came in an extra-inning contest. Lets’ take a look at some of those performances.

A Perfect Six-for-Six … Cark Weilman and Alex Gonzalez

The 1913 St. Louis Browns’ Carl Weilman was the first player to strikeout six times in a game in which he had just six plate appearances. We can probably forgive him, though.  He was after all, a pitcher (and he wasn’t even slated to pitch that day.

On July 25, 1913, Weilman was called on in relief with one out in the first innings of the Browns-Nationals tilt (In Washington). Browns’ starter George Baumgardner had given up hits three hits (two home runs) while retiring just one batter. Weilman came in and finished the contest, which ended in an 8-8, 15-inning tie.

Unfortunately for Weilman, the Senators’ first two pitchers did not fare well and future Hall of Famer (and ultimately 12-time AL strikeout leader) Walter Johnson pitched 11 1/3 innings  in relief for the Senators. Four of Weilman’s six whiffs were against Johnson. Of course, Weilman wasn’t the only one to have trouble with Johnson’s offerings.  The Big Train fanned 15 batters in his 11 1/3-inning relief stint.

Carl Weilman, who fanned a record six times in six plate appearances on July 25, 2012 also recorded six strikeouts as a pitcher that day. 

Weilman pitched in eight MLB seasons (1912-17, 1919-20), all for the Browns.  He went 84-93, 2.67.  At the plate, he hit .170-0-25 in 560 plate appearances.  Waler Johnson?  Well, you know all about him.

Another “Six-for-Six” Strike outing.”

Among positions players, Blue Jays’ SS Alex Gonzalez matched Weilman’s six-whiffs in six plate appearances on September 9, 1998 – as the Blue Jays lost to the Indians (in Toronto) 6-3. Gonzalez, batting ninth, enjoyed this day:

Second inning – Two out (two on bae) swinging strikeout versus Dwight Gooden;

Fourth inning – Two out (one on) swinging strikeout versus Gooden;

Seventh inning – One out (none on) swinging strikeout versus Gooden;

Ninth inning – Two out (none on) swinging strikeout versus Paul Shuey;

Eleventh inning- Two out (two on) strikeout looking versus Doug Jones;

Thirteenth inning – One out (one on) swinging strikeout versus Michael Jackson.

Equal Opportunity (or more #InBaseballWeCountyEverything)

Don Hoak shares the record for strikeout in a game and holds the record for being struck out by the most different pitchers in a game.  On May 2, 1956, Hoak – playing third base and leading off for the Cubs – came to the plate nine times in a Cubs 6-5, 17-inning loss to the Giants. He collected a single, a walk, a sacrifice and six whiffs (tying the MLB record for strikeouts in a single game).

The Giants used eight pitchers in the game, and Hoak was fanned by six of them: Al Worthington; Don Liddle; Hoyt Wilhelm; Steve Ridzik; Wendy McCall; and Ruben Gomez.

Hoak, by the way, almost didn’t get that sixth whiff.  In the bottom of the final (seventeenth) inning and the Cubs down 6-5, the first two Cubs hitters were retired by Joe Margoneri. Cubs’ Pitcher Jim Brosnan was up next and the Cubs sent Clyde McCullough up to pinch hitMcCullough doubled, bringing up Hoak. Ruben Gomez was brought in to pitch and Hoak fanned to end the game.

______________________________________

Now, Let’s move on to five-strikeout games. There have been 199 of them – nothing very rare air there. Of those 199, 89 have been nine-inning contests.  Still not very rare. There have, however, also just 20 players with multiple five strikeout games.  So, let’s go there

We’ll start with players with multiple,  five-strikeout game – all of nine innings.

Photo: Arturo Pardavila III from Hoboken, NJ, USA, CC BY 2.0 <https://creativecommons.org/licenses/by/2.0>, via Wikimedia Commons

Javier Baez leads the way there, with three such games. One each in 2017, 2019 and 2021.  The opposing starting pitchers in those contests were: Carlos Rodon in 2017; Gerrit Cole in 2019; and Braxton Garrett in 2021.

Baez, still active, has 10 MLB seasons on his resume (2014-23 … Cubs, Mets, Tigers), His stat line is .256-175-591. Over his 1,142 MLB games, he has fanned 1,225 times – leading the league once (184 in 2021) and topping 150 whiffs in three seasons. His best season was 2018, when he hit .290, with 34 homers and a league-leading 11l RBI for the Cubs.

As the chart below show, multiple nine-inning strikeout game are a bit of a rarity.


Now, how about five strikeout games -including extra-inning tilts.

Number One in Platinum Sombreros

Photo: Jeffrey Hayes, CC BY 2.0 <https://creativecommons.org/licenses/by/2.0>, via Wikimedia Commons

Sammy Sosa leads the way here with four five-whiff games – one each in 1990, 1996, 2000 and 2003.  The starting pitchers in those games were Tom Gordon; Dave Burba; Kip Wells; and Roy Oswalt. Sosa, is not a total surprise on this list. In 18 MLB seasons (1989-2005, 2007 … Rangers, White Sox, Cubs, Orioles, he  fanned 3,306 times in 2,354 games. He led the league in whiffs three times and fanned 150 or more times in six seasons.  He put up a pretty good offensive stat line despite the whiffs – .273-609-1,667 for his career. Sosa was a seven-time All Star, and the 1998 National League MVP – when he went ,308-66-158 for the Cubs. Sosa the league in runs scored three times, home runs twice and RBI three times.

Three is Company … or not

Ray Lankford has no company among players with three five-strikeout games in a single season. (See the  chart  immediately above or the chart at the end of at end of post. Yes, Lankford made it to two charts.)  The Cardinals’ outfielder “accomplished” the feat in 1998 – racking up five-strikeout games on May 24, June 6 and August 8.    Still. Lankford had a solid 1998 season, hitting .298-31-105, with 26 steals (151 strikeouts, his career high).  Lankford played in 14 MLB seasons (1990-2002, 2004 … Cardinals, Padres).

Let’s Get This Over with Fast

Ray Lanford may have racked up three five-whiff games in a single season, but Giancarlo Stanton had two five-strikeout games in less than a week.   On April 3, 2018 – as the Yankees lost to the Rays 11-4 in New York, Stanton went zero-for-five with five strikeouts. Playing LF and batting third in the lineup, his day went like this:

First inning – Two-out (no one on base) swinging strikeouts versus Chris Archer.

Third inning -No out, (two on) strikeout looking versus Archer.

Fifth Inning – One out (one one) swinging strikeout versus Archer.

Seventh Inning – One out (two on) swinging strikeout versus Austin Pruitt;

Eighth inning – One out (bases loaded) swinging strikeout versus Sergio Romo.

Then, just five days later (April 8), in a 12-inning  8-7 loss to the Orioles (in Yankee Stadium), Stanton (batting third and playing RF) had another five-whiff game – wit one strikeout against five different pitchers.

First inning – No outs (two on base) strikeout looking versus Mike Wright, Jr.

Second inning – One out (none on) strikeout swinging versus Pedro Araujo;

Fourth inning – Two out (one on) strikeout looking versus Miguel Castro.

Sixth inning – Could things get worse? One on, one out, Stanton swing at the first pitch from Tanner Scott and lined into a double play.

Eighth inning – One out (one on) strikeout swinging versus Darren O’Day;

Tenth inning – Two out (two on) First-pitch swinging, Stanton grounded into a force out at second.

Twelfth inning – With one on and two out, Stanton struck out on four pitches versus Brad Bach to end the game.

The two five-whiff games were the bookends of a six-game stretch during which Stanton came to the plate 30 times (28 at bats) and fanned 16.  For the 2018 season, Stanton hit .266-38-100 and fanned 211 times in 705 plate appearances.  To date, Stanton has fanned 1,820 times in 1,535 MLB games (2010-2023 … Marlins, Yankees).  His stat line is .259-402-1,031. He has fanned more than 150 times in five seasons. Stanton is a five-time Al Star and was the AL MVP in 2017, when he hit .281, with a league-leading 59 home runs and a league-best 132 RBI in 159 games for the Marlins. He has topped 30 home runs in seven seasons.


Primary resource:  Baseball-References.com


Baseball Roundtable – Blogging Baseball Since 2012.

100Baseball Roundtable is on the Feedspot list of the Top 100 Baseball Blogs.  To see the full list, click here.

Baseball Roundtable is also on the Anytime Baseball Supply Top 66 Baseball Sites list.  For the full list, click here

I tweet (on X) baseball @DavidBaseballRT

Follow Baseball Roundtable’s Facebook Page here

Member: Society for American Baseball Research (SABR); Negro Leagues Baseball Museum; The Baseball Reliquary.

P1020

Off-Season Musings … More Rarities and Oddities … 20-Loss Seasons

The Reverse Unicorn

Since 1980, only two pitchers have “achieved” twenty or more losses in a single season. In that same span, there have been 131 pitcher seasons of twenty or more wins.

Regular readers of Baseball Roundtable know how my mind tends to wander during the off-season – leading to the exploration of a wide range of baseball topics (particularly rarities and oddities). Admittedly as “One thing seems to lead to another,” these posts can at times seem like watching a series of unrelated slides (I hope most of you remember slides).  Each post, however, can be traced to an overarching theme. Most recently, there were posts on 20-game winners (click here for that one), 100-RBI seasons (click here) and zero-home run seasons (click here).

This foundation of this post will a what I consider a reverse unicorn, the increasingly rare pitcher-seasons of 20 or more losses.

How rare have 20-loss seasons become?  As noted earlier, they have been only two 20-loss seasons since 1980.  The last 20-loss campaign belongs to the Tigers’ Mike Maroth, who went 9-21, 5.73 in 2003. (More on that later). As the chart below shows 295 of the 499 20-loss seasons (59.1%) occurred before 1900 … and the appearance of these reverse unicorns” has dwindled steadily since.

The 1884 season saw the most 20-loss campaigns, as 25 pitchers reached or exceeded twenty defeats. (The 1884 season featured 33 majo- league teams … National League, Union Association and American Association.) Notably, 12 of those pitchers also won 20 or more games and eight finished above .500.

There are some pretty obvious reasons for this, centered around pitcher usage.  Over the years, such factors expanding rotations (from two-to-five or more pitcher rotations), larger pitching staffs and relief specialists (middle men, set-up men, closers), pitch counts (and fewer complete games) all have helped make it harder for a pitcher to reach 20 losses (or twenty wins, for that matter). Consider, in 1890, 37 pitchers started 35 or more games (eight of those had 50-plus starts). In 2023, only one pitcher – Mike Mikolas of the Cardinals – accrued 35 starts. We’ll get to why I picked 35 starts as a focus point in a bit.

That chart below illustrates some the change MLB has seen – as complete games have plummeted and the number of pitchers used by teams each season had risen. In sheer raw numbers, 2003 saw 35 complete games in 4,869 starts; 1960 saw 665 complete games in 2,472 starts; and 1890 saw 2,879 complete games in 3,218 starts.

Now, as to my observation of the “sweet spot” for 20 losses (or twenty wins) – historically two of every three seasons of twenty or more losses (or twenty or more wins) belong to a pitcher with 35 or more starts.

Now, this post is about 20-game losers, so I thought I better start to steer this ship back in that direction. I went back to 1974, the last season MLB saw at least five 20-game losers: Steve Rogers (Expos, 15-22, 4.47), Bill Bonham (Cubs, 11-22, 3.86), Randy Jones (Padres, 8-22, 4.45), Mickey Lolich (Tigers, 16-21, 4.15) and Clyde Wright (Brewers, 9-20, 4.42).  A few comparisons:

  • These five (the five losingest pitchers in MLB in 1974) had a cumulative 181 starts, with 67 complete games and 28 complete-game losses. MLB’s five winningest pitchers in 20023 (Spencer Strider, Zac Gallen, Chris Bassitt, Zach Elfin and Justin Steele) had 160 starts, two complete games and zero complete-game losses.
  • 1974’s five 20-game losers had 67 complete games and 28 complete-game losses, while all of MLB saw just 35 complete games and seven complete-game losses in 2023.

A Unicorn

The Kansas City Royals’ Jordan Lyles tied for the major-league lead in complete games in 2023 (with three).  All three of his complete games were losses – and I can find no other instance of the MLB leader in complete games recording not a single complete-game victory. Lyles’ final line on the season, 6-17, 6.28.

Now, let’s look at some rarities and oddities among 20-game losers.

Pud Galvin – King of the 20-Game Losers

Photo: Goodwin & Company, CC0, via Wikimedia Commons

If the corps of 20-game loser had a king, his name would be James Francis “Pud” Galvin – who holds the MLB record for 20-loss seasons at ten, and who rang them up consecutively 1879-1888. Galvin, however, was clearly no loser – pitching his way into the Baseball Hall of Fame with a 365-310, 2.85 record over 15 MLB seasons (1875, 1879-1892 … St. Louis Brown Stockings, Buffalo Bisons, Allegheny City, Pittsburgh Burgers, St. Louis Browns.)

_______________________________

Pud Galvin recorded MLB seasons of twenty or more losses in the National League, American Association and Players League.

_______________________________

In his ten-year streak of season with 20 or more losses, Galvin seven times won more games than he lost. Galvin was known for pinpoint control of his fastball, fine fielding and an exceptional pickoff move that spurred many protests from opposing players, coaches and managers.

Galvin’s best seasons were 1883 and 1884, with the National League Buffalo Bisons.  In 1883, Galvin went 46-29, with a 2.72 earned run average and led the league in games (76), starts (75), complete games (72), shutouts (five) and innings pitched 656 1/3.  He followed that up with an 1884 campaign that again included 46 wins (22 losses), 71 complete games in 72 starts, 636 1/3 innings pitched and a league-leading 12 shutouts.  It truly was a different game back then. Consider Buffalo had a 116-92-5 record over those two seasons and Galvin started 148 (80%) and completed 147 of those 183 games.

Those Were The Days, My Friends

During his streak of ten consecutive 20+loss season, Galvin went 301-253, 2.71 and threw 535 complete games in 573 starts.

During his career, Galvin had ten seasons of 20 or more wins and ten seasons of 20 or more losses.  He reached both figures in nine seasons. Surprisingly, he never led his league in wins or losses.

__________________________

The Most Recent 20-Game Loser – Mike Maroth

Photo: Wknight94, CC BY-SA 3.0 <http://creativecommons.org/licenses/by-sa/3.0/>, via Wikimedia Commons

Southpaw Mike Maroth is the most recent 20-game loser.  Maroth went 9-21, 5.73 for the 2003 Tigers, a team that went 43-119 and finished in last place (47 games off the pace) in the AL Central Division. Maroth may have been the “ace” of the Tiger staff (he was the Opening Day starter). Maroth led the Tigers in wins, and starts – no other Tiger hurler won more than six games that season.

Consistency

After ten starts, Maroth was 0-9, 5.73 (right where his season-ending ERA stood).

Maroth had a six-season MLB career (2002-07 … Tigers, Cardinals), going 50-67, 5.05.

______________________________

Searching for a Won-Lost Rarity

Looking through records, I found that 126 of the 499 seasons (25.3%) of 20 or more losses saw the pitcher lead the league in losses. No rare air there.  Twenty of those 499 seasons (four percent) saw a pitcher with 20 or more losses lead the league in wins. Rarer, but hardly unicorn status.  Ah, but wait, how about 20-game losers who led their league in both wins and losses?  Bingo, just two!

Jim Whitney, 1881 Boston (National League)

Jim Whitney, as a hard-throwing 23-year-old rookie, went 31-33 for the 1881 Boston NL squad, leading the National League in both wins and losses. He put up a 2.48 earned run average (the league average was 3.13) and led the NL in games (66), starts (63) and complete games (57). Whitney went on to a 10-season MLB career (1881-1890 … Boston, Kansas City Cowboys, Washington Nationals, and Indianapolis Hoosiers and the American Association Philadelphia Athletics).  He had five seasons of 20 or more wins and seven seasons of 20+ losses – producing a career stat line of 191-204, 2.97.

Phil Niekro, 1979 Atlanta Braves

Photo: Texas Rangers via tradingcarddb.com, Public domain, via Wikimedia Commons

In 1979, knuckleballer – and future Hall of famer – Phil Niekro became just the second pitcher to lose 20 or more games and lead his league in wins and losses in the same season. Pitching for a Braves’ squad that went 66-94, Niekro went 21-20, 3.39, leading the NL in starts (44), complete games (23), innings pitched (342) – as well as in home runs allowed (41), walks (113) and hit batsmen (11).  Adding to the oddity, Niekro tied for the NL lead in wins … with his brother Joe, who went 21-11 for the Astros. Phil Niekro hovered around .500 all season He was 3-4 as of May 1; 5-8 as of June 1; 10-10 as of July 1; 14-13 on August 1. He went into the season’s final month at 17-17 and went 4-3, 2.65 in September to close out a 21-20.

A Recent Rarity

Phil Niekro is the last MLB pitcher to lose 20 games in a season and still have a .500+ winning percentage.  Before Niekro, that distinction belonged to Walter Johnson, who went 25-20 for the 1916 Washington Nationals.   

Niekro pitched in 24 MLB seasons (1964-87 … Braves, Yankees, Indians, Blue Jays).  He went 318-274, 3.35 and recorded 245 complete games in 716 starts. He was a five-time All Star and three-time 20-game winner (leading the NL in wins twice).  He also led the NL in winning percentage once, starts four times, complete games four times, innings pitched four times and strikeouts once. On the flip side, he led the league in losses four times (twice losing 20 games in a season), home runs allowed four times, walks three times, hit batsmen three times and wild pitches three times.

________________________________

Fewest Starts in a 20-loss Season …. 20 – Les German

In 1896, Les German split his season between the NL New York Giants and Washington Senators – going 2-20, 6.43.  He started 20 games and relieved in eight. German pitched six MLB seasons (1890, 1893-97), going 34-63, 5.45.

Fewest Wins in a 20-loss Season1 – John Cassidy & Jack Nabors

John Cassidy went 1-21. 3.03 in 1875, for the National Association Brooklyn Atlantics. It was the 20-year-old’s rookie season. He forged an 11-season MLB career (1875-1885 … Brooklyn Atlantics, New Haven Elm Citys, Hartford Dark Blues, Chicago White Stockings, Troy Trojans, Providence Grays, Brooklyn), but only pitched in two seasons 1875 and 1877 (two games). As an outfielder/first baseman, he hit .246-5-191 over his career.,

John Cassidy’s .045 winning percentage in 1875 is the lowest ever for a pitcher who lost 20 or more games in a season.

Jack Nabors went 1-20, 3.47 for the 1916 Philadelphia Athletics. It was the righthander’s only full MLB season, (He pitched in ten games for the Athletics as a 27-year-old rookie in 1915 and in two games in 1917.)  In that 1916 season, he pitched in 40 games (30 starts) and had 11 complete games.

A Good Start – The Finish, Not So Much

Jack Nabors’ only win in 1816 came in his first start of the season (April 22), when he beat the Red Sox 6-2.  He threw a nine-inning complete game: eight hits, two runs (unearned), two walks and four whiffs. Little did he know it would be the only “W” he would see by his name in his MLB career.  Nabors’ career record was 1-25, 3.87 (52 games, 37 starts, 13 complete games). 

_____________________________

Most Wins By A Pitcher ins a Season of Twenty or More Losses – 52, Guy Hecker, 1885 Louisville Colonels, American Association

Photo: Goodwin & Co., sponsor, Public domain, via Wikimedia Commons

First, a look into the search for a rarity that led to this portion of the post. (This is also a “one thing leads to another” example of Baseball Roundtable and the statistical rabbit hole.)   As I scoured through stats, I saw that, in 107 (21.4%) of MLB’s 499 20-loss seasons, the pitcher put up a winning percentage of .500 or better. I also noted that the 1884 season saw the most 20-loss campaigns, as 25 pitchers reached or exceeded twenty defeats and that nine of those pitchers (36 %) finished at .500 or better.   (The 1884 season featured 33 major-league teams … National League, Union Association and American Association.) No rarities here.  But 1884, did turn up some 20-game loser rarities.

The most wins by a pitcher in a season with 20 or more losses is 52 by the 1884 Louisville Colonels’ (American Association) Guy Hecker (52-20, with a 1.80 earned run average).  That season, Hecker led the AA in wins, earned run average, games (75), starts (73), complete games (72), innings pitched (670 2/3), hits allowed (526) and strikeouts (385). As you would expect, his  .722 winning percentage is the best ever in a season of 20 or more losses.

Hecker finished his nine-season MLB career at 175-46, 2.93, with a .282 batting average (he pitched in 336 games, played first base in 322 and outfield in 75).

A Bit of an Oddity

Guy Hecker won the American Association ERA title in 1884 (1.80) and the league’s batting title in 1886 (.341).

The most wins in a 20-loss season since 1900 belong to Joe McGinnity, who went 31-20, 2.43 for the 1903 Giants. He led the league in wins games (55), starts (48), complete games (44) and innings pitched (434).  His .608 winning percentage is also the best in a 20 or more-loss season since 1900. In 19 MLB seasons (1899-1908 … Orioles, Superbas, Giants), McGinnity went 246-142, 2.66. He won 20 or more games in eight seasons (leading the league five times) and lost 20 or more in two seasons.

An Oddity of the One Thing Leads to Another Variety

This one is from one of Hall of Famer Iron Joe McGinnity’s 20-loss seasons. In August of 1903, the Giants’ McGinnity started both games of a doubleheader three times (August 1, 8 and 31) and won all six games. That same month, he pitched just one game on six occasions – and went 1-5. On the season, he went 31-20, 2.43.

 ____________________________________

Here’s the Ball, Go Get’ Em Rook

A total of 77 rookies have lost 20 or more games – 56 pre-1900, 21 since 1900 and just two since 1960.

The last rookie to rack up a 20-loss season was the Padres’ Clay Kirby – in 1969, when he went 7-20, 3.80.  He went on to an eight-season MLB career (1969-76 … Padres, Reds. Expos), going 75-104, 3.84.  His best season was 1971, when he went 15-13, 2.93, with 13 complete games in 36 starts for the Padres.

One and Out

Twenty-six pitchers have lost 20 or more games in their final MLB season. For ten of those players, it was their ONLY MLB season. Nine of those ten played before 1900.  The unicorn, in this case, was Henry Keupper, who went 8-20, 4.27 for the 1914 Federal League St. Louis TerriersThe most losses for any of these one season-and-out pitchers goes to George Cobb of the 1892 National League Baltimore Orioles, who went 10-37, 4.86 in his lone MLB season. 

________________________________________

The Win-Loss Yo-Yo

Photo: Chicago White Sox, Public domain, via Wikimedia Commons

Since 1900, only one pitcher has TWICE put up a season of twenty losses immediately after a season of twenty wins.  That unicorn would be the White Sox’ Wilbur Wood, who accomplished the feat between 1972 and 1975.

Wood was an All Star in 1972, going 24-17 for the White Sox (leading the league in wins). In 1973, he lost 20 games (but again led the AL with 24 wins). Then, in 1974, he went 20-198, 3.60, before losing 20 games (16 wins) in 1975.

Woos

Wood – a southpaw knuckleball pitcher – started his MLB career primarily as a reliever, just 21 starts in 365 appearances between 1961 and 1970. He was converted to a starter by the White Sox in 1971 and won 20 or more games in each of the next four seasons.  He played in 17 MLB seasons, going 164-156, 3.13, with 57 saves. He made a total of 651 appearances (297 starts).  Wood was a three-time All Star and led his league in wins twice (losses once), games pitched three times, games started four times, and innings pitched twice.

____________________________________________

Here’s a look at pitchers, since 1900, who have either followed up a 20-win season with 20 losses in the next campaign, or followed a 20-loss season immediately with a 20-win season.

20 loss after 20 win

20-20

We’re closing in on the end. (Still with me?)

My Three favorite 20-game Losers — Two Youngs and a Larsen

  1.  Don Larsen … In 1954, just two years before he would pitch a World Series Perfect Game for the Yankees, Larsen went 3021, 4.37 for the Orioles (The Orioles were 54-100 that season.) Larsen went 81-91, 3.78 in 14 MLB seasons.
  2. Cy Young …  MLB’s winningest pitcher (511 victories) also lost the most career games (315). His record included three seasons of 20 or more losses (in two of those he had more wins than losses). In 1909, his age-39 seasons, Young went 13-21, 3.19 for the Boston Americans of the  AL. In is 22-season  MLB career, 16 seasons of 20 or more wins (five of those of 30 or more).
  3. Irv Young … There have been only two MLB teams to “boast” four twenty-game loser in the same season and Irv Young was one of the 20-game losers on both of them.  The 1905 Boston Beaneaters featured a rotation that included Vic Willis (12-29), Chick Fraser (14-21), Irvin Wilhelm (3-23) and the “ace” of the staff, Irv Young (20-21). Boston finished 51-103-2. The very next season, Boston Young again led the Boston staff with a 16-25 record, followed up by Vive Lindaman (12-23), Jeff Pfeffer (13-22) and Gus Dorner (8-25).  That season, Boston finished 49-102-1.

Special thanks to Bill Nowlin and Emmet R. Nowlin, editors of “20-Game Losers” (Society for American Baseball Research Inc., 2017) for including a chapter on “A Staff With Four Twenty Game Losers” in that publication.

Baseball Balance: As noted above only two MLB teams have completed a season with four twenty-game losses.  On the other end of the scales, only two teams have finished a season with four twenty-game winners: the 1920 White sox, with Red Faber (23-13), Lefty Williams (22-14), Dickey Kerr (21-9) and Eddie Cicotte (21-10) & the 1971 Orioles, with Dave McNally (21-5), Pat Dobson (20-8), Jim Palmer (20-9) and Mike Cueller (20-9).

Deep breath, here’s the finish line.

The name game.  Some pitchers (whose names stuck out for me) with 20-loss seasons under their belts: Steve Carlton; Walter Johnson; Jerry Koosman; Mickey Lolich; Rube Marquard; Denny McLain; Old Hoss Radbourn; Eppa Rixey; Robin Roberts; Red Ruffing; Amos Rusie; Mel Stottlemyre; Luis Tiant.

Nicknames. Ah, those were the days.  Here are some 20-game losers with nicknames that grabbed me: Ice Box Chamberlain; Egyptian Healy; Phenomenal Smith; Tricky Nichols; The Only Nolan; Brickyard Kennedy; Bullet Joe Bush; Boom-Boom Beck; Pretzels Getzien; Cherokee Fisher; Pink Hawley; Sad Sam Jones; Bobo Newsom.

Primary Resource: Baseball Reference.com.

Baseball Roundtable – Blogging Baseball Since 2012.

100Baseball Roundtable is on the Feedspot list of the Top 100 Baseball Blogs.  To see the full list, click here.

Baseball Roundtable is also on the Anytime Baseball Supply Top 66 Baseball Sites list.  For the full list, click here

I tweet (on X) baseball @DavidBaseballRT

Follow Baseball Roundtable’s Facebook Page here

Member: Society for American Baseball Research (SABR); Negro Leagues Baseball Museum; The Baseball Reliquary.

P1019


“Who’s Your Daddy?” … Episode 19 … Tom Glavine

Welcome to the 19th post in the Baseball Roundtable’s “Who’s Your Daddy?” series, where we take a look at Roundtable-selected lineups that performed exceptionally well against some of MLB’s greatest pitchers.

As always, I would stress that the pitchers included in the Who’s Your Daddy? series are among the “best in the business.”  They are selected not because of the players who performed well against them, but rather because success among hitters when they were on the mound was the exception rather than the rule.  We’ve looked at pitchers from a wide range of eras – from Carl Hubbell to Bob Feller to Nolan Ryan to Justin Verlander. Note:  For those unfamiliar with the series, its origins are explained at the end of this post.

This chapter of Who’s You Daddy? Focuses on Tom Glavine – one of just six left-handed pitchers to attain 300 or more major-league victories. In case it should come up in a trivia quiz, here they are (in order of total wins): Warren Spahn (363): Steve Carlton (329); Eddie Plank (326); Tom Glavine (305); Randy Johnson (303); and  Lefty Grove (300).  

___________________________

Before we get started on this edition, here are links to the previous editions of this series.

Please note: For still active pitchers, the stats are as they stood on the date of the post.

  • Nolan Ryan, click here.
  • Sandy Koufax, click here.
  • Pedro Martinez, click here.
  • Bob Gibson, click here.
  • Randy Johnson, click here.
  • Greg Maddux, click here.
  • Justin Verlander, click here.
  • Bob Feller, click here.
  • Roger Clemens, click here.
  • Max Scherzer, click here.
  • Tom Seaver, click here.
  • Mariano Rivera, click here.
  • Warren Spahn, click here.
  • Lefty Grove, click here.
  • Steve Carlton, click here.
  • Robin Roberts, click here.
  • Carl Hubbell, click here. 
  • For Hoyt Wilhelm, click here.

If you go back through past editions of “Who’s Your Daddy?”, you may find a few surprises – like how Will Clark owned Nolan Ryan; Jerry Lynch‘s .714 average versus Sandy Koufax; pitcher Hal Jeffcoat’s .545 average versus Hoyt Wilhelm; the fact that Brian Harper faced Roger Clemens 23 times and never struck out; or how Ival Goodman (who averaged one home run each 47 at bats over his 10-season MLB career) poked six home runs in just 64 at bats against Carl Hubbell.

____________________________

Photo: jimmyack205, CC BY 2.0 <https://creativecommons.org/licenses/by/2.0>, via Wikimedia Commons

Before we get into the lineup of players who fared especially well against Tom Glavine, let’s take a look at the southpaw’s Hall of Fame career.  Glavine pitched in 22 MLB seasons (1987-2008, his age-21 through age-42 seasons). He spent 17 seasons with the Braves and five with the Mets.  Glavine’s 305 wins (versus 203 losses) are 21st all-time and fourth among lefthanders. His .600 wining percentage is 14th among the 24 MLB 300-game winners.

One-Two Punch … Left Jab-Right Hook

The leaders in pitching victories for the decade of the 1990s spent seven of the ten years of the decade together  in the Braves’ rotation. Righty Greg Maddux, whose decade saw him spend 1990-92 with the Cubs and 1993-99 with the Braves, led all MLB pitchers with 176 wins in the decade.  Southpaw Tom Glavine, who spend the entire decade with the Braves, was second with 164.  Maddux and Glavine both won 300+ games in their MLB careers and were both 2014 first-ballot electees to the Baseball Hall of Fame.

Glavine – a ten-time All Star and two-time Cy Young Award winner – was primarily a fastball-changeup pitcher for most of his career (although he could mix in an effective curve, slider and cutter). He was known for pinpoint control, avoiding the middle of the plate and expanding the strike zone, particularly low-and-away. He won 20 or more games in five seasons (four in the 1990s) – leading the NL in wins each time. He led the National League in starts six times, complete games once and shutouts once.  A workhorse, Glavine started 32 or more games in 17 seasons, including every season from 1996 through 2007.

Baseball Roundtable Likes a Good Coincidence

In his first MLB season (at age 21), Tom Glavine went 2-4, with a 5.54 earned run average for the Braves.  In his final MLB season (age 42), Glavine went 2-4, with a 5.54 earned run average for the Braves.  Maybe a good trivia question:  What 300-game winner went 2-4, 5.54 in both his first and last seasons in the major leagues?

In his prime 12-season stretch from 1991 through 2002, Glavine averaged 17 wins, eight losses, a 3.15 ERA, 225 innings pitched, 77 walks and 144 strikeouts per campaign.

A Brief Break From Our Regularly Scheduled Topic

Mike Glavine (Tom Glavine’s younger brother) had a brief MLB career:   six games (PH/1B), seven plate appearances with the Mets in September of 2003. So, why is he here?  Mike made his MLB debut on September 14, 2003 in a pinch-hitting role.  Who did he hit for?  His big brother Tom. (He grounded out second-to-first).  Another fact that caught my eye.  Mike got his only MLB hit in his final MLB plate appearances (September 28, 2003 versus the Marlin’ Braden Looper.) 


Now, let’s look at a lineup of players, who performed pretty well against Glavine.

Keep in mind, while these selections are statistically based, there is plenty of room for debate. (Isn’t that part of what is great about the national pastime?) For example, they are weighted in favor of larger sample sizes. I also considered whether the numbers were generated in Glavine’s prime years and balanced the stats against the player’s career statistics (for example, if I was looking at two players who each hit .305 versus Glavine, I would be more impressed by the player with a .266 overall career average than one with a .308 career average).   I’ll provide some examples of how these criteria were applied as you go through the lineup

Catcher – Mike Redmond … .438 average, unexpected power

Mike Redmond, a career .287 hitter over 13 seasons (1998-2010 … Marlins, Twins, Indians) hit Tom Glavine for a .438 average over 20  games. Glavine was also one of only two pitchers that Redmond (who hit a total of 13 career homers) reached for two career home runs.  As an unexpected side note: Redmond hit .500 (21-for-42 versus Glavine from 1998-2002), then went zero-for-nine in the final two seasons in which he faced him (2003-04).

In 1999, when Glavine went 14-8, 3.68, Redmond faced him seven times and collected five hits and a walk (.833 average).

A Nice Little Run

From July 12, 1998 through his second at bat against Glavine on July 6. 1999, Mike Redmond faced Glavine nine times and collected seven singles, one double and a walk. Over those two seasons, Glavine went 34-17, 3.30.

Honorable Mention at Catcher: I fully expected this spot to go to someone like Hall of Famer Mike Piazza, who went .343-6-13 in 27 games against Glavine. Piazza’s six home runs tie for the most against Glavine and his 13 RBI tie for fifth.  Piazza did have 84 plate appearances versus Glavine, compared to Redmond’s 51 – but I could not resist Redmond’s .400+ average. Either would be a fine choice at catcher in this lineup.

Worth the Wait

Mike Piazza, who played his way into the Baseball Hall of Fame (with a  career .308-427, 1,335 stat line and ten All Star selections) was the 1,390th pick in the 1988 MLB draft.   

____________________________________

First Base – Jeff Bagwell … .339, with three home runs

Photo: Michael Glasgow, CC BY 2.0 <https://creativecommons.org/licenses/by/2.0>, via Wikimedia Commons

Hall of Famer Jeff Bagwell hit .339, with three homers and ten RBI in 23 games against Glavine. His 21 career hits against the lefty tie for the 18th.  Bagwell also drew 18 walks versus Glavine (11 strikeouts) and put up a .488 on-base percentage. Those 18 walks were the most Glavine issued to any player. Four of those were intentional, tying for the most IBB Glavine issued to any player.  (Others to receive four career IBB from Glavine were Gary Sheffield and Barry Bonds.) Bagwell was a career .297 hitter over 15 seasons (1991-2005, all Astros). He was a four-time All Star, 1991 NL Rookie of the year and 1994 NL MVP (.368-39-116, with 104 runs scored and 15 steals. ).  His career stat line was .297-449-1,529, with 1.517 run scored and 202 stolen bases.

________________________________

An Even Dozen

In his first dozen games facing Tom Glavine, Jeff Bagwell got on base versus Glavine via hit or walk in all twelve, hitting safety in 11.

______________________________________

Deserves a Shoutout at 1B: First baseman Mo Vaughn doesn’t make this lineup due to a small sample size (just 10 at bats in four games versus Glavine), but he deserves a shoutout. In those three games, he delivered five hits (two doubles and three home runs) for a 1.600 slugging percentage.

Now, it’s always nice when selecting these lineups to come across a player you are not familiar with. Expos’  1B Fernando Seguignol faced Tom Glavine in five games (1999-2001) and went seven-for-fourteen (.500), with two doubles, two home runs and five RBI. It was Seguignol’s most at bats, most hits, most doubles (tie), most home runs and most RBI against any pitcher. In five MLB seasons (1998-2001, 2003 … Expos, Yankees), Seguignol hit .249-17-40 (178 games).

___________________________

Second Base – Tie:  Robby Thompson and Bill Doran

I could find good arguments for both Robby Thompson and Bill Doran in this spot.

If I had to pick one, I’d lean toward Thompson for his larger sample size.  However, since this is my post, I can declare a tie.

Robby Thompson – .393 and four long balls

Robby Thompson hit .393 (22-for-56) in 20 games against Tom Glavine. Perhaps as important is the fact that 13 of his 22 hits went for extra bases (eight doubles, one triple and four home runs). This gives him a .786 slugging percentage versus Glavine – second highest among players with at least 25 at bat versus Glavine. Thompson hit .500 or better versus Glavine in five of the nine seasons in which he faced him.

_______________

Catching Him in His Prime

In 1992 & 1993, when Tom Glavine went a combined 42-15 (and led the NL in wins both times), Robby Thompson 11-for-18 (.611) against him, with two homers and three RBI in six games.

______________

Thompson played 11 MLB seasons (1986-96), all for the Giants.  He was a two-time All Star and one-time Gold Glover, who put up a .257-119-458 stat line. His four home runs off Glavine` tied for the most he hit against any MLB pitcher (he also had four versus Jose Rijo) and his 22 hits versus Glavine were the second most he had against any MLB pitcher (he hit .424 with 23 hits versus Fernando Valenzuela).  By contrast, Thompson hit .118, with nine hits in 48 at bats versus Greg Maddux, with three walks and 15 whiffs.

Bill Doran – .480 average, .606 on-base percentage.

Photo: Indiana Blue Sox, Public domain, via Wikimedia Commons

Bill Doran was a .266 career MLB hitter (1982-93 … Astros, Reds, Brewers). He did, however, tag Tom Glavine for a .480 average (12-for-25) and drew eight walks versus Glavine, fanning just once (.606 on-base percentage – highest among batters with at least 25 at bats versus Glavine).  Side note: If you use 25 plate appearances instead of at bats, Doran’s OBP versus Glavine is second to Carlos Delgado’s  .640.

____________________________

Bookends

In his first seven career plate appearances versus Tom Glavine (August 17 & September 30, 1987), Bill Doran was on base six times (three singles and three walks). In his final eight plate appearance versus Glavine (October 2, 1991 and August 4 & September 9, 1992), Doran collected four walks and a pair of singles.

_________________________________  

Doran’s career stat line was .266-84-497, with 727 runs scored and 209 steals in 1,453 games. His best season was 1987, when he hit .283-16-79, with 82 runs scored and 31 steals for the Astros (and played in all 162 games).

Possible Trivia Question: Which member of the Astros’ Hall of Fame matriculated in Oxford? (No, not that Oxford.)  Bill Doran studied and played base ball for Miami University in Oxford, Ohio – where he hit .407-4-27 (45 games) in his final college season (1979). He was selected in sixth round of the 1979 MLB Draft.

Honorable Mention: Luis Castillo hit .382-2-5 in 24 games versus Glavine (1996, 1999-2005, 2008). His 29 hits tied for the most career safeties against Glavine and he recorded them in the fewest at bats among the five players with 29 hits against Glavine. There was just a lot of competition at second base – and a three-way tie was too much to ask.

__________________________________

_________________________________

Third Base: Tim Wallach … .367, five homers, 12 RBI

Tim Wallach hit .367, with five home runs and 12 RBI against Glavine – and he gets extra credit because those numbers came between 1988-94 and included three of the five seasons in which Glavine led the league in wins. (1991-93). Over those three seasons, Wallach went 12-for-29 (.414) against Glavine, with three doubles, a triple, one home run and five RBI.

Going Deep Can Be Habit-Forming

Between May 30, 1990 and June 9, 1991, Tim Wallach faced Tom Glavine in four games and homered in each of them:

May 30, 1990 … one-for-two, solo homer;

June 29, 1990 … one-for-three, solo home run, walk;

July 12, 1990 … one-for-three, three-run homer;

June 9, 1991 … two-for-two, single, three-run homer, single, walk.

As an aside, those three 1990 homers were the only hits Wallach had in 11 at bats versus Glavine that season.

Wallach played in 17 MLB seasons (1980-96 … Expos, Dodgers, Angels), going .257-260-1,125, with 908 runs scored. He was a five-time All Star and three-time Gold Glover. His best season was 1987, when he hit .298-26-123 – reaching career highs in all three categories, as well as in doubles (a league-leading 42), runs scored (89), stolen bases (9) and total bases (305).


Honorable Mentions. Aramis Ramirez.  It’s hard to limit Ramirez to an honorable mention here.  After all, he hit .500 (13-for-26), with four home runs and ten RBI in just 12 games versus Glavine.  However, five of his hits, two of his homers and eight of his RBI came in Glavine’s final three (age 40-42) seasons. Digging deeper, Ramirez had a .421 on-base percentage versus Glavine from 2001-2005 and a .721 OBP in 2006-08. Still, there are some nice numbers here.  Ramirez drew eight walks and fanned just once (in 35 plate appearances) versus Glavine (six of the walks in those final three seasons). He also hit .400 or better in six of the seven seasons he faced Glavine.  Ramirez played 18 MLB seasons (1998-2015 … Pirates, Cubs, Brewers), going .283-386-1,417, with 1,098 runs scored.  He was a three-time All Star, hit 25 or more home runs in ten seasons, drove in 100+ runs in seven and hit .300 or better in seven.

During his 16-season MLB career, Todd Zeile started more than 100 games each at 3B (1,468), 1B (417) and catcher (121).  As a hitter, over 2,158 games, he went .265-253-1,110.  Zeile faced Glavine in 34 games and collected 29 hits (.326 average), with four  home runs, 12 RBI (13 walks  and 13 strikeouts). Competition was tough at the hot corner.

__________________________________

Shortstop:  Tie- Jimmy Rollins & Barry Larkin

I know, another cop out (tie), but Barry Larkin and Jimmy Rollins each offer a notable body of work against Glavine – and were both were among the players tied for the most hits against Glavine at 29. Rollins showed a bit more power, Larkin a bit more patience.  And, more of Larkin’s numbers were delivered when Glavine was in his prime.

Jimmy Rollins – .372 average, 29 hits, ten doubles, 14 RBI.

Photo: Keith Allison from Hanover, MD, USA, CC BY-SA 2.0 <https://creativecommons.org/licenses/by-sa/2.0>, via Wikimedia Commons

Jimmy Rollins holds or is tied for the career lead in hits (29), home runs (6), doubles (10) and RBI (14) against Glavine. Overall, 17 of Rollins 29 hits went for extra bases.  Admittedly, a significant portion this damage was done toward the end of Glavine’s career, but those leadership positions are impossible to ignore.  (As a bit of explanation, eight of Rollins’ hits, two of his homers and three of his RBI against Glavine came in 2007 (Glavine’s age-41 season).

Rollins was a three-time All Star, four-time Gold Glover and the 2007 NL Most Valuable player. He played 17 seasons (2000-2016 … Phillies. Dodgers White Sox) and hit .264-231-936, with 1,421 runs scored and 470 stolen bases. He led the NL in triples four times, runs scored once  (topping 100 runs scored in six seasons) and stolen bases once (topping 40 steals in four seasons).

Barry Larkin … .309, 29 hits, three homers, 12 RBI, 14 walks

Photo: Rdikeman at the English Wikipedia, CC BY-SA 3.0 <http://creativecommons.org/licenses/by-sa/3.0/>, via Wikimedia Commons

Hall of famer Barry Larkin faced Glavine in 34 games (1987-96, 1998-99, 2002,2004). He hit .309 (29 hits), with eight doubles, one triple, three homers and 12 RBI. He also walked 14 times versus Glavine versus just three whiffs.

Larkin’s numbers against Glavine were closer to his career norm than Rollins’ were to his. Larkin played 19 MLB seasons (1986-2004), all for the Reds.  He hit .295-198-960, with 1,329 runs scored and 379 steals. He was a 12-time All-Star, three-time Gold Glover and the 1995 NL Most Valuable Player. Larkin hit over .350 against Glavine in seven of the 14 seasons in which he faced the southpaw Hall of Famer.


Small Sample Shoutout at Short:  Luis Rivera faced Tom Glavine in just three games (1988 & 1994) and went six-for-eight, with a double, two home runs and four RBI.

__________________________________

Left Field – Kevin Mitchell … .356, with five home runs and 12 RBI

Kevin Mitchell faced Glavine in 16 games (1987-91, 1993-94, 1996), putting up a .356-5-12 line.  Half of Mitchell’s hits against Glavine went for extra bases (three doubles and five home runs) – giving him a .756 career slugging percentage the lefty.

Closing Strong

In his first three games against Glavine, Mitchel went two-for-seven (.286), with zero extra-base hits, just one walk and four strikeouts.  Over his final 13 games against Glavine, he went 14-for-68 (.368), with eight extra-base hits, nine walks and three strikeouts.

In the same vein, in his first career plate appearance against Glavine (September 25. 1987), Mitchell struck out.  In his last plate appearance against Glavine September 4, 1996, he homered.


Kevin Mitchell played in 13 MLB seasons (1984, 1986-94, 1996-98 … Mets, Padres, Giants, Reds, Red Sox, Indians, Athletics), going .284-234-760 in 1,223 games. He was a two-time All Star and the NL MVP in 1989, when he hit .291-47-125 for the Giants – leading the league in HRs, RBI, slugging percentage and total bases.

__________________________________________

Center Field – Andruw Jones … .372 average, four home runs

Photo: User Chrisjnelson on en.wikipedia, Public domain, via Wikimedia Commons

Needed a leather and lumber guy in CF and Andruw Jones fit the bill.  In 18 games versus Glavine (2003-07), Jones hit .372, with four home runs and 11 RBI, Eight of his 16 hits versus Glavine went for extra bases (four doubles, four home runs) and he drew 11 walks to just four strikeouts, putting up a nice even .500 on-base percentage.

First Time’s the Charm

Andruw Jones homered on the second pitch he ever saw from Tom Glavine (May 24, 2003). The Braves defeated Glavine’s Mets 10-3 in that game.

Andruw Jones played in 17 MLB seasons (1996-2012 … Braves, Dodgers, Rangers, White Sox, Yankees), going .254-434-1,289, with 1,204 runs scored and 152 stolen bases.  He hit 30 or more home runs in seven seasons (a league-leading and career-high 51 in 2005). He was a five time All Star and ten-time Gold Glover in center field.

Andruw Jones and Tom Glavine were teammates on the Braves from 1996 through 2002.

_________________________________

Right Field, Gary Sheffield – .293, five home runs, 13 RBI, 17 walks versus three whiffs, .461 OBP

Oh, I’d like to have seen those Gary Sheffield versus Tom Glavine at bats. Glavine working to expand the strike zone, Sheffield refusing to bite on the low-and -away pitch (17 walks versus three whiffs). Sheffield faced Glavine in 1992, 1994-2001, 2003, 2005 & 2007). He tied for the most career home runs off Glavine with six and had the fifth most RBI (13 – one off the lead). But what really put him in the LF spot (against some tough competition), was those 17 walks versus only three strikeouts.

In 1996, Gary Sheffield faced Tom Glavine 12 times in four games and got on base nine – seven walks and two home runs.  He did not strikeout against Glavine that season. Over his career, Sheffield never fanned more than once versus Glavine in any season and had just three whiffs in 76 plate appearances.

Some Bookends

On April 18, 1996, the Marlins’ Gary Sheffield rapped a home run off Tom Glavine in the first inning of a 5-3 Florida win over Atlanta. In his next seven plate appearances versus Glavine, Sheffield walked seven times (three intentional). He ended the streak of walks with another home run off Glavine on July 12 of that season.

Outfield Honorable Mentions: Barry Bonds went .329-4-14 in 33 games versus Glavine. Moises Alou also did well against Glavine at .351-3-14 in 25 games.

Apologies

Tony Gwynn tied for the most career hits versus Glavine, but did not make this lineup. One main reason, his .312 average versus Glavine was 26 points below his career average.

______________________________________

Pitcher – Livan Hernandez … .412 average

Livan Hernandez faced Tom Glavine 20 times in eight games (1999, 2002-06) and delivered seven hits in 17 at bats (.412 average). Those hits included two triples (tied for the most against Glavine by any batter), one home run and three RBI.

On The Money

 In his very first game against Glavine (April 23, 1999), the Marlin’s Livan Hernandez got his money’s worth on the mound and at the plate. On the mound, he got the win (over the Braves) with a nine-hit, one-run, two-walk, nine-strikeout complete game.  At the plate, he flied out to deep right on the first pitch he saw from Tom Glavine (second inning); had an RBI sacrifice fly on an 0-2 pitch from Glavine in the fourth; hit a two-run homer on the first pitch he saw from Glavine in the sixth; and had an RBI single off reliever John Hudek in the seventh.

In their eight head-to-head pitching matchups, Glavine went 5-3, 2.56, while Hernandez went 3-5, 2.88. Hernandez was a solid hitter as a pitcher – .221-10-85 over 973 at bats over 17 seasons.

Honorable Mention: Gil Heredia faced Tom Glavine just three times (1994-95), but he delivered three hits. (all singles).  Heredia, by the way, was a good hitting pitcher. Over 10 MLB seasons, he put up a .213 average (19-0for-104), struck out just 11 times in 131 plate appearances.  The right hander went 57-51, 4.46 on the mound (1991-96, 1998-2001 … Athletics, Expos, Giants, Rangers.)


______________________________________

Who’s Your Daddy?  The Inspiration.

On September 24, 2004, in the middle of a tight pennant race, the Yankees handed future Hall of Famer Pedro Martinez and the Boston Red Sox a tough 6-4 loss.  Martinez went 7 1/3 innings giving up nine hits and five earned runs.  The game came just five days after (in his previous start) Martinez had lasted just five frames against the Bronx Bombers (eight hits, eight earned runs) in a 16-7 loss.

After that second loss, Martinez candidly commented, “What can I say? I just tip my hat and call the Yankees my daddy.”  Little did he know that his comment – and a Yankee fans’ chant of “Who’s your daddy?” would follow him into future starts in New York (all the way to his final MLB start – against the Yankees for the Phillies – in Game Six of the 2009 World Series).

The concept of “Who’s your daddy?” became the inspiration for Baseball Roundtable to take a look at the players who “had the number” of some of MLB’s premier pitchers.  Again, you can find links to the previous “editions” of “Who’s Your Daddy?” near the top of this post. 

______________________________________

Primary Resource: Baseball-References.com.


Baseball Roundtable – Blogging Baseball Since 2012.

100Baseball Roundtable is on the Feedspot list of the Top 100 Baseball Blogs.  To see the full list, click here.

Baseball Roundtable is also on the Anytime Baseball Supply Top 66 Baseball Sites list.  For the full list, click here

I tweet baseball @DavidBaseballRT

Follow/Like Baseball Roundtable’s Facebook Page here.  Find More baseball commentary; blog post notifications; PRIZES.

Member: Society for American Baseball Research (SABR); Negro Leagues Baseball Museum; The Baseball Reliquary.

P1018


Feeling Powerless? Rarities and Oddities about Zero-home Run Seasons.

Readers of Baseball Roundtable are aware of how I am drawn to baseball rarities in the off-season.  In this post, we’ll look at some of the unique statistics surrounding zero-home run seasons. If you enjoy this you may want to check out my posts on 20-game winners (click here) and 100-RBI seasons (click here).

Rarities and Oddities – MLB Batting Champions with Zero Home Runs

There have been only two MLB batting champions to log zero home runs in a season in which they won the crown … and they came 75 years apart. 

Wee Willie Keeler, 1897 Orioles

Photo: Internet Archive Book Images, No restrictions, via Wikimedia Commons

In 1897, 5’-4”/140-pound Baltimore Orioles’ outfielder Willie Keeler won the NL batting title with a .424 average, stroking out a league-leading 239 hits. In the process, he set a still unmatched record for base hits in a season in which the player hit zero home runs.  Of those 239 hits, 193 (81 percent) were singles. Keeler opened the 1897 season with a 44-game hitting streak (still MLB’s longest streak from Opening Day).  Keeler was an accomplished bunter and a renowned contact/slap hitter. Over his career, Keeler struck out just 136 times in 9,619 plate appearances.

_____________________________________

“I keep my eyes clear and I hit ‘em where they ain’t.”

                   Willie Keeler (Baseball’s Greatest Quotations, Paul Dickson, 1991)

_________________________________________

Hall of Famer Keeler played 19 MLB seasons (1892-1910 … in the NL, the Giants, Brooklyn Statistics, Orioles, Brooklyn Superbas and, in the AL, New York Highlanders).   He was a two-time batting champion and collected 200 or more hits in eight seasons.  Of his 2,932 hits, 86 percent were singles. Keeler finished with a .341-33-810 career stat line, with 1,719 runs scored and 495 steals.

Willie Keeler had 33 career home runs – of which only two cleared the fences.  Of the others, thirty were inside-the-park and one left the field on the bounce (it was a different time).

_________________

Rod Carew, 1972 Twins

Photo: Hostess via tradingcarddb.com, public domain, via Wikimedia Commons

In 1972, Hall of Famer Rod Carew won his second (of seven) AL batting titles.  He hit .318-0-51, with 51 RBI and 61 runs scored in 142 games – 143 of his 170 hits (84 percent) were singles. 1972 was his only season without a home run.

Carew, like Keeler, was an accomplished bunter (in 1974, he had 29 bunt singles) and contact hitter. Carew played 19 MLB seasons (1967-85 … Twins, Angels). The 18-time All Star won seven batting titles, the 1967 AL Rookie of the Year Award and the 1977 AL MVP Award.  He hit over .300 in 15 of his 19 seasons and finished with .328-92-1,015 stat line, with 1,424 runs scored and 353 steals.

_________________________________

“He (Rod Carew) has an uncanny ability to move the ball around as if the bat were some kind of magic wand.”

                                                              Pitcher Ken Holtzman

____________________________________

Most Hits in a Zero-Home Run Season

As usual, one thing led to another and I began digging a little deeper into the rarity of zero-homer seasons. As you might expect, they have become rarer over time.  Starting with a base of players with seasons of at least 100 hits and zero home runs, there were 873 such seasons in MLB history. Not rare at all, although about two-of-every three (593 or 67.9 percent) occurred before 1930.

So, I looked for something a little rarer and ramped up to 150 hits and no home runs.  Now. we were down to 177 such campaigns – still not rare air.  But, using 200 or more hits turned the trick.  There have been only seven seasons of 200 or more hits and zero home runs. Let’s take a look at them – and the players were delivered them.

Willie Keeler, 1897 Orioles (NL) – 239 hits

Willie Keeler has the most hits in a zero-homer season at 239. You’ve already read about him in the opening of this post, so we can move on to number-two.

________________

Napoleon Lajoie, 1906 Cleveland Naps – 214 hits

In 1906, second baseman Nap Lajoie hit .355 for Cleveland, with a league-leading 214 hits and a league-topping 48 doubles, but zero home runs.  He drove in 91 runs and scored 88 in 152 games.

In a 21-season MLB career (1896-1916 … Phillies, Athletics, Naps), he hit .338-82-1,599, with 1,504 runs scored and 380 steals. Looking for a trivia question? Lajoie is the only player with a 200-hit, zero-home run MLB season, with more career RBI than runs scored.

The Hall of Famer led the league in batting average five times, hits four times (topping 200 hit each time), doubles five times (a high of 51 in 1910), home runs once, total bases four times, RBI three times and runs once. He hit over .300 in 17 seasons, but reached double-digits in home runs just once.

The Triple Crown … and Then Some

In 1901, while with the Philadelphia Athletics, Nap Lajoie, won the Triple Crown with a .426 average, 14 home runs and 125 RBI.  He also led the AL in runs scored (145), hits (232), doubles (48) and total bases (350).

_________________

Jesse Burkett, 1898 Cleveland Spiders, (NL) – 213 hits

In 1898, Cleveland LF Jesse Burkett hit .341 for the Spiders, with 213 hits, 114 runs scored, 42 RBI, 19 steals and zero home runs.  In fact, that season just 27 of Burkett’s hits (12.7 percent) went for extra bases.

Hall of Famer Burkett played 16 MLB seasons (1890-1905 … Giants, Spiders, Cardinals, Browns). He won three batting titles (twice hitting over .400), led the league in hits three times (topping 200 hits in six seasons) and twice led the league in runs scored (topping 100 in nine seasons).

1898 was the only full season in which Burkett failed to hit at least two home runs, Over his career, Burkett hit .338, with 75 home runs, 952 RBI, 1,720 runs scored and 389 steals.

________________

Hughie Jennings, 1896 Orioles NL – 209 hits

In 1896, Hughie Jennings banged out 209 hits (.401 average) and drove in 121 runs, despite not going yard a single time (87 percent of his hits were singles).

Jennings played 18 MLB seasons (1891-1903, 1907, 1909-10, 1912, 1918 … Louisville Colonels of the American Association and NL Orioles, Brooklyn Superbas and Phillies, and AL Tigers).  Over 1,284 games, he hit .312-18-840, with 992 runs scored and 359 steals. Jennings scored 100 or more runs in five seasons, had two seasons of 200+ hits and stole 50+ bases three times.

Hughie Jennings recorded 121 RBI in 1896, the MLB record for a zero-home run season.

Jennings holds the MLB record for career “hit by pitch” at 287 and the MLB single-season record at 51 (1896 Orioles). He led the NL in HBP six consecutive seasons (1894-1898.) Once again, for Baseball Roundtable,  one thing led to another – and to this chart.

________________

Johnny Pesky, 1947 Red Sox – 207 hits

In 1947, Red Sox’ 23-year-old rookie SS Johnny Pesky hit .324-0-39, with 106 runs scored and 12 stolen bases (83 percent of his 207 hits were singles).

Pesky played in ten MLB seasons (1942, 1946-54 … Red Sox, Tigers, Nationals). He hit .307-17-404, with 867 runs scored and 53 steals.  Over his career, he topped 100 runs scored in six seasons, exceeded 200 hits three times and hit .300+ six times.

What Might Those Numbers Have Been?

As a 23-year-old rookie in 1942, Johnny Pesky hit .331-2-51, with 105 runs scored and a league-topping 205 hits.  Pesky then missed three years of baseball action due to military service. He returned to the Red Sox as a 27-year-old and picked up right where he left off,  again leading the AL in base hits with 208 – going .335-2-55, with 115 runs scored in 153 games. In 1947, his third MLB season, he led the AL in hits for a third time (207), going .324-0-39, with 106 runs scored.  What might his career numbers have been if he had not missed those three prime years wile in the Navy?

________________________________________

Milt Stock, 1920 Cardinals – 204 hits

Cardinals’ third baseman Milt Stock went .319-0-76, with 85 runs scored in 1920 (83 percent to his hits were singles). Stock played 14 MLB seasons (1913-26 … Giants, Phillies, Cardinals, Robins). He went .289-22-696, with 839 runs scored and 155 steals.  Stock hit .300+ in five seasons (a high of .328 in 1925) and twice recorded 200+ hits in a season. From 1919 through 1922, he hit over .300 in four consecutive seasons.

Another One Thing Leads to Another 

From his fourth plate appearance on June 21, 1918 until his fifth plate appearance on August 22, 1921, Milt Stock went 1,690 plate appearances without a home run, Stock falls far short of the MLB record, held by Thomas Thevenow, who hit his second career regular-season MLB home run (both were inside-the-parkers) in his final at bat of a game played on  on September 22, 1926 and then played 12 more major-league seasons – going another 1,003 games and 3,607 consecutive plate appearances without a four-bagger. In a 15-season MLB career Thevenow (primarily a SS) hit .247 (1,030 its in 1,229 games). Notably, Thevenow hit a third MLB home run in 1926.  This one was also an inside-the-parker and came in Game Two of the Cardinals-Yankees World Series. St. Louis won the Series four games-to-three and Thevenow hit .417 (10-for-24), with five runs scored, one double, one homer and four RBI.

________________

One Final Chart:

Doc Cramer, at the top of this list, played 20 MLB seasons (1929-48 … Athletics, Red Sox, Nationals Tigers). He hit .296-37-842, with 1,357 runs scored. He was a five-time All Star, had 200 or more hits in three seasons, 100+ runs in three seasons, and hit .300 or better in seven seasons. He had 2,705 career hits (80 percent of them singles).

Okay, maybe one more chart:


Most Seasons with Zero Home Runs and 500 or More Plate Appearances – Seven

Donie  Bush had zero home runs and 500 or more plate appearances for he Tigers in 1909,  1914, 1916-19,  and for the Tigers and Nationals in 1921. He played 16 MLB seasons (1908-23 … Tigers, Nationals) and went .250-9-445, with 1,281 runs scored.

Jim Slagle … Slagle put up seasons of 500 or more plate appearances and zero home runs for the Cubs in 1900,  1902-03 and 1905-07. In a ten-season MLB career (Senators, Phillies, Boston Nationals, Cubs), he hit .268-2-344, with 781 runs scored and 274 steals in 1,300 games.

Primary Resource:  Baseball-Reference.com.

A REMINDER … .

There is still time to cast your vote(s) in the Baseball Roundtable (unofficial) 2024 Baseball Hall of Fame Fan Balloting (and qualify for the prize drawing).  Click here to go directly to the ballot.  Click here for a post taking a look at the careers of the players on the ballot.


Baseball Roundtable – Blogging Baseball Since 2012.

100Baseball Roundtable is on the Feedspot list of the Top 100 Baseball Blogs.  To see the full list, click here.

Baseball Roundtable is also on the Anytime Baseball Supply Top 66 Baseball Sites list.  For the full list, click here

I tweet (on X) baseball @DavidBaseballRT

Follow/Like Baseball Roundtable’s Facebook Page here.  Find More baseball commentary; blog post notifications; PRIZES.

Member: Society for American Baseball Research (SABR); Negro Leagues Baseball Museum; The Baseball Reliquary.

P1017


100-RBI Season Rarities … the Stories and the Stats

Photo: Tuh22823, CC BY-SA 4.0 <https://creativecommons.org/licenses/by-sa/4.0>, via Wikimedia Commons

Major League Baseball, in its long history and from A-to-Z (Henry Aaron to Richie Zisk), has had 2,029 player-seasons of 100 or more RBI (Baseball-Reference.com). In 2023, we saw a 100-RBI season like never before. Phillies’ LF Kyle Schwarber became the first MLB player ever to drive in 100 or more runs in a season when his batting average was below.200. (As a sidenote: Three of the five lowest averages in 100+ RBI season occurred in 2023.)

 It was Schwarber’s first 100-RBI season in a nine-season MLB career (2015-23 … Cubs, Nationals, Red Sox, Phillies). During the season, he went .197-47-104, with 108 runs scored – reaching career highs in home runs, RBI and runs (and leading the NL with a career-high 215 strikeouts).

Over his career, the two-time All Star has put up a .227-246-548 stat line.

Another Schwarber Oddity

Kyle Schwarber has a share of the record for most home runs in a season without reaching 100 RBI. In 2022, Schwarber went .218-46-94 for the Phillies, joining Alfonso Soriano who went .277-46-95 for the Nationals in 2006.

Overall, there have been 31 MLB seasons of forty or more homers and fewer than 100 MBI. Just five players have two such seasons:

  • Henry Aaron – 1969 Braves (.300-44-97) & 1973 Braves (.301-40-96).
  • Adam Dunn – 2006 Reds (.234-40-92) & 2012 White Sox (.204-41-96).
  • Joey Gallo – 2017 Rangers (.209-41-80) & 2018 Rangers (.206-40-92).
  • Mickey Mantle – 1958 Yankees (.304-42-97) & 1960 Yankees (.275-40-94).
  • Mike Trout, 2015 Angels (.299-41-90) & 2022 Angels (.283-40-80).

Well, as always, with Baseball Roundtable “one thing led to another,” and I began a search for more 100-RBI seasons rarities and oddities. (No baseball, too much time on my hands.)

First Up, Another 2023 Rarity – Fewest Base Hits in a 100-RBI Season – 102

In 2023, Dodgers’ third baseman Max Muncy put up a .212-36-105 season – collecting just 102 base hits (the fewest ever in an MLB 100-RBI campaign). It was Muncy’s first-ever 100-RBI season (in eight MLB seasons). To date, Muncy’s career stat line is .227-180-489.

A few other tidbits:

  • Barry Bonds, Bryce Harper, Christian Yelich, Ken Griffey Jr., Mickey Mantle, Shohei Ohtani, Nelson Cruz and Henry Aaron are the only MLB players to combine a 40-homer/sub-100 RBI season with a .300 or better batting average.
  • Joey Gallo is the only player with two consecutive 40-homer/sub-100 RBI seasons.
  • The only 40-homer/sub-90 RBI seasons belong to Joey Gallo (.209-40-80 for the 2017 Rangers) and Mike Trout (.283-40-80 for the 2022 Angels).
  • In 11 of the seasons of 40 or more homers and fewer than 100 RBI, the player led the league in long balls, in seven the player led in strikeouts.

The Highest Batting Average in a Sub-100 RBI Season (some qualifiers) … .424

The highest batting average (using a minimum of 400 plate appearances) in sub-100 RBI season is .424 by Willie Keeler, 1897 Baltimore Orioles (.4237) and Rogers Hornsby 1924 Cardinals (.42350).  Keeler had 74 RBI in 129 games, Hornsby had 94 RBI in 143  contests.  Note: I used 450 at bats because of the discrepancy in season lengths. For example, if you used players qualifying for the batting title, the highest average without 100 RBI would be Levi Meyerle of the 1871 National Association Philadelphia Athletics. However, the Athletics played just 28 games that season. Meyerle had a .492 average and 40 RBI in 26 games, 132 plate appearances. 

Rookies Hitting Cookies

Ted William holds the all-time MLB rookie-season RBI record with 145 in 1939. Photo: wild mercury

There have been 44 players who have driven in 100 or more runs in a “rookie” season, with 22 of those in their debut season. (Rookie status can roll over to another season based on days on the roster, number of at bats or number of innings pitched.)  Twelve of those rookies have won the Rookie of the Year award. (Twenty players have recorded 100 or more RBI in their rookie season since the ROY Award was established.)

As the chart below shows, their 100-RBI rookie season was the only career 100-RBI season for 11 of the 44 players who recorded 100 or more RBI in a rookie campaign.


Going Out On Top … Or Not

On November 18, 2015, Red Sox DH David Ortiz (on his fortieth birthday) announced that the 2016 MLB season would be his last as a player. The following year, he went out on top – with a .315-38-127, becoming one of just five players to record 100 or more RBI in their final MLB campaign. Here is the list:


The not so much on top? Joe Jackson and Happy Felsch had their careers cut short due to the 1919 Black Sox scandal. Injuries also played a role in adding two players to this list: Albert Belle (osteoarthritis – hip) and David Orr (Stro9ke).

Fewest Games Played in a 100-RBI Season – 69

JOSH GIBSON Photo: Harrison Studio, Public Domain, via Wikimedia Commons

In 1943, Josh Gibson went .466-20-109 in 69 games for the Negro National League II Homestead Grays. That season, the Hall of Famer led the league in runs (93), hits (116), doubles (22), home runs (20), RBI (109) walks (52) and total bases (216).

 Something Old Something New

The oldest player to record a 100-RBI season was 42-year-old Cap Anson of the 1894 Chicago Cubs.

Six players recorded season of of 100 or more RBI in their age-20 season: Ty Cobb, Al Kaline, Mel Ott, Alex Rodriguez,  Juan Soto and Ted Williams.  Moving on to months and days, the youngest of those was Ott, who went .328-42-151 for the 1929 Giants. It was, by the way, Ott’s fourth MLB season. Ott played 209 MLB games before his twentieth birthday – going .318-19-100 over three seasons.

The Saga of Jack Reed … One RBI/106 Games … One Memorable Home Run

In 1963, 30-year-old Jack Reed was in his third MLB season as a reserve outfielder/defensive replacement for the New York Yankees.  He replaced Mickey Mantle in the field often enough that he was known in some circles as “Mickey Mantle’s Caddie.”  In 1963, he played in 106 games, had just 82 plate appearances (73 at bats) and hit .205-0-1 … recording the fewest RBI ever for a player who appeared in 100 or more games.  

However, Reed’s brightest moment in the major leagues came at the plate, not in the garden. On June 24, 1962, Reed hit the only home run of his MLB career (1961-63). It was a two-run shot off Tigers’ reliever Phil Regan in the top of the 22nd inning – the game winner in the longest game in Yankee history. Reed had replaced Joe Pepitone (who had earlier replaced Mickey Mantle) in RF in the thirteenth inning. Reed’s career stats line (222 games) was .233-1-6. Often used as a pinch runner, he scored 39 runs and stole seven bases. In that 1962 season, Reed went .302-1-4 in 88 games (48 plate appearances.)  

Most hits in a Sub-100 RBI Season – 262

Photo by Matt McGee

In 2004, Mariners’ RF Ichiro Suzuki rapped out an MLB single-season record 262 base hits – but collected just 60 RBI, He hit .373 for the season and 225 of his 262 hits were singles.  Suzuki, who had ten MLB seasons of 200 or more hits and 3,089 hits in 19 MLB seasons, never drove in more than 69 runs in a season.

In MLB history, there have been 539 player-seasons of 200 or more hits, with 54 percent (292) of those seasons seeing the player record fewer than 100 RBI.

In a combined 100 seasons, the players on the above list had 43 seasons of 200 or more hits and just one 100-RBI campaign. (In 1999, Derek Jeter had 219 hits and 102 RBI).

Lloyd Waner of the 1927 Pirates recorded the fewest RBI in an MLB season of 200 or more hits. That season, he hit .355, with 223 hits, but recorded only 27 RBI.

Most Strikeouts in a 100-RBI Season – 223

Just five players have recorded 200 or more whiffs in a 100-RBI season:

  • Mark Reynolds, 2009 Diamondbacks – .260-30-102, with 223 strikeouts (which is the MLB single-season record for batter’s strikeouts).
  • Kyle Schwarber, 2023 Phillies – .197-47-104, with 215 whiffs.
  • Giancarlo Stanton, 2018 Yankees – .266-38-100, with 211 strikeouts.
  • Chris Davis, 2015 Orioles – .262-47-117, with 208 strikeouts.
  • Aaron Judge, 2017 Yankees – .284-52-114, with 208 whiffs.

Fewest Strikeouts in a 100-RBI Season – Three

In 1894, The Giants’ Jack Doyle drove in 103 runs in 103 games. He hit .368-3-103 and fanned just three times in 471 plate appearances.

Post-1900:  The 1902 Athletics’ Lave Cross hit .342-0-108 and whiffed just four times in 597 plate appearances.

Get ‘Em On – I’ll Bring ‘Em Home

Among players with at least 100 RBI in a season, Al Simmons (1930 Athletics) had the highest batting average with runners in scoring position at .436 (85-for-195). When he came to the plate without runners in scoring position, he hit .351. His overall stat line .381-36-165.

Fewest Home Runs in a 100-RBI Season  – Zero

Hughie Jennings (.401-0-121 for the 1896 Baltimore Orioles) and Lave Cross (.342-0-108 for the 1902 Athletics) are the only MLB players to record a 100-RBI season with zero round trippers.

Most Players with 100 or More RBI on a Team in the Same Season – Five 

1936 Yankees: C Bill Dickey (107);  1B Lou Gehrig (152); 2B Tony Lazzeri (109); RF George Selkirk (107); CF Joe DiMaggio (125)

1894 Orioles (NL): 1B Dan Brouthers (128); 2B Henry Reitz (105); SS Hughie Jennings (109); CF Steve Brodie (113);  LF Joe Kelly (111).

1894 Boston (NL); 1B Tommy Tucker (100); 2B Bobby Lowe (115); OF Jimmy Bannon (114); OF  Hugh Duffy (145); OF Tommy McCarthy (126).

 The Most 100-RBI Seasons

Primary Resource:  Baseball-Reference.com

A REMINDER … .

There is still time to cast your vote(s) in the Baseball Roundtable (unofficial) 2024 Baseball Hall of Fame Fan Balloting (and qualify for the prize drawing).  Click here to go directly to the ballot.  Click here for a post taking a look at the careers of the players on the ballot.


Baseball Roundtable – Blogging Baseball Since 2012.

100Baseball Roundtable is on the Feedspot list of the Top 100 Baseball Blogs.  To see the full list, click here.

Baseball Roundtable is also on the Anytime Baseball Supply Top 66 Baseball Sites list.  For the full list, click here

I tweet (on X) baseball @DavidBaseballRT

Follow/Like Baseball Roundtable’s Facebook Page here.  Find More baseball commentary; blog post notifications; PRIZES.

Member: Society for American Baseball Research (SABR); Negro Leagues Baseball Museum; The Baseball Reliquary.

P1016


Baseball Roundtable (unofficial) Baseball Hall of Fame Fan Balloting Update

We’re at about the half-way point in Baseball Roundtable’s 2024 Baseball Hall of Fame (unofficial) Fan/Reader Ballot. You have until January 2 to cast your ballot (and qualify for the prize drawing). In this post, we’ll provide a brief update on fan balloting thus far, but first a call for your vote.

_____________________________________

BEFORE WE RETURN TO OUR REGULAR PRORAMMING/POSTING …

There is still time to cast your vote(s) in the Baseball Roundtable (unofficial) 2024 Baseball Hall of Fame Fan Balloting (and qualify for the prize drawing).  Click here to go directly to the ballot.  Click here for a post taking a look at the careers of the players on the ballot.

_________________________________________________


Photos: Beltre – Keith Allison on Flickr, CC BY-SA 2.0 <https://creativecommons.org/licenses/by-sa/2.0>, via Wikimedia Commons Helton:  Jonathan Konrath from Oakland, USA, CC BY 2.0 <https://creativecommons.org/licenses/by/2.0>, via Wikimedia Commons Wagner: Alex Kim from NYC, USderivative work: Killervogel5, CC BY 2.0 <https://creativecommons.org/licenses/by/2.0>, via Wikimedia Commons

Reader Balloting Update

Through December 14, a total of 36 fan/reader ballots have been cast. As the chart below shows, among Roundtable readers first-time candidate Adrian Beltre and Todd Helton (in his sixth year on the ballot) lead the voting at 87.5 percent, with Billy Wagner (75 percent) the only other candidate at the 75-percent election threshold.  While only 3.9 percent of the official ballot are known (as of December 12), those results (as reported on bbhoftracker.com) also show Beltre (100 percent) and Helton (93.3 percent at the top), with Gary Sheffield (80 percent) and Joe Mauer (80 percent) also above the 75 percent threshold. (Admittedly with a long way to go in the balloting.)  For those with an interest in the ongoing results, I recommend bbhoftracker.com, particularly as we get closer to the close of official voting.

Looking at reader ballots, the biggest gainers among holdover from 2023 are Helton, Wagner, Andy Pettitte and Bobby Abreu – all with gains of between 17.2 and 18.6 percentage points over last year’s reader voting. As of December 14, the largest declines among readers belong to Alex Rodriguez (- 19.2 percentage) and Francisco Rodriguez (- 22.6 percentage points). Here’s a look at the 2023 reader/fan balloting and this year’s reader/fan totals to date.

Baseball Roundtable also asked reader which players, now off the ballot, they felt should be in the Hall of Fame.   Twenty different players were mentioned.  The leaders were Jeff Kent (five mentions); Lou Whitaker (four), Barry Bonds and Roger Clemens (three) and Dwight Evans (two).

Baseball Roundtable – Blogging Baseball Since 2012.

100Baseball Roundtable is on the Feedspot list of the Top 100 Baseball Blogs.  To see the full list, click here.

Baseball Roundtable is also on the Anytime Baseball Supply Top 66 Baseball Sites list.  For the full list, click here

I tweet (on X) baseball @DavidBaseballRT

Follow/Like Baseball Roundtable’s Facebook Page here.  Find More baseball commentary; blog post notifications; PRIZES.

Member: Society for American Baseball Research (SABR); Negro Leagues Baseball Museum; The Baseball Reliquary.

P1015

Baseball Roundtable Musings on 20-Win Seasons … Stats and Stories

Baseball Roundtable was recently reflecting on that fact that the Braves’ righty Spencer Strider was MLB’s only 2023 20-game winner, which led me to the fact that MLB has had just one twenty-game winner in each of the past three seasons. In the vein of  “In Baseball Roundtable one thing always seem to lead to another,” this led me to the fact that only five pitchers (one of them being Strider) have recorded 20 or more wins in a season in which they pitched fewer than 190 innings:

  • 2022 – Kyle Wright, Braves (21-5, 3.19 in 180 1/3 innings);
  • 2018 – Blake Snell, Rays (21-5, 1.89 in 180 2/3 innings);
  • 2021 – Julio Urias, Dodgers (20-3, 2.96 in 185 2/3 innings);
  • 2023 – Spencer Strider, Braves (20-5, 3.86 in 186 2/3 innings;
  • 2012 – Jered Weaver, Angels (20-5, 2.81 in 188 2/3 innings).

Anyway, that sent me down a research rabbit hole, searching out stats related to 20+ win seasons that interested me (and I hope some of them interest you, as fans and readers).

Of course, one thing led to another and those low inning totals led me to look at complete-game totals.  As the chart below snows. Strider joined a (rather impressive) recent and growing list of pitchers to record twenty wins in a season without throwing a single complete game.

_____________________________________

BEFORE WE RETURN TO OUR REGULAR PRORAMMING/POSTING …

There is still time to cast your vote(s) in the Baseball Roundtable (unofficial) 2024 Baseball Hall of Fame Fan Balloting (and qualify for the prize drawing).  Click here to go directly to the ballot.  Click here for a post taking a look at the careers of the players on the ballot.

_________________________________________________


Before, getting into single-seasons and records, here a few numbers to show how the times have changed.  Baseball-Reference.com shows 1,219 seasons of 20 or more wins since 1871. Within that statistic:

  • MLB averaged 13.5 20+ game winners per season before 1900 and 9.8 since 1900.
  • Since 2010, the average number of pitchers winning 20 or more games per season is down to 1.9

Side note:  Those numbers provide even more contrast when you consider the increase in the number of teams and games played per season.

  • There has been just one 60-win season (Old Hoss Radbourn … 60-12, 1.38 for the 1884 Providence Grays.) Note: Some sources credit Radbourn with 59 wins, but the Elias Sports Bureau and Baseball-Reference.com list 60, and that’s good enough for me.
  • There were four seasons of between 50-59 wins – the most recent in 1885 (John Clarkson. Chicago White Stockings, NL, 53-16, 1.85).
  • There were 37 seasons of 40-49 wins – the most recent in 1908 (Ed Walsh, White Sox … 40-15, 1.42).
  • There were 117 seasons of 30-39 wins, the most recent in 1968 (Denny McLain, Tigers … 31-6, 1.96) and just 19 since 1900.

The above bullet points explain why, in some cases, I have broken out findings by pre-1900 and 1900 and beyond. So, let’s get on with it.

Highest Earn Run Average for a Pitcher Winning 20 or More Games in a Season – 5.08

I started with a look for “rarities” among 20-game winners – and I quickly found one. In MLB history, only two pitchers have had an earned run average of 5.00 or higher in a twenty-win season:

  • Bobo Newsom, 1938 Browns, 5.08;
  • Ray Kremer, 1930 Pittsburgh Pirates, 5.02.

Louis “Bobo” Newsom – In 1938, righty Newsom went 20-16, with a 5.08 ERA, for the St. Louis Browns. (The league ERA was 4.79.) Newsom had an up-and-down campaign. In his 20 wins, he put up a 3.13 ERA; in his 16 losses, his ERA was 8.11; and in his seven no-decisions, it was 5.65. His career somewhat mirrored that season.  Newsom won 20 or more games in three seasons (consecutively,  1938-40) and also lost 20 games in three seasons (1934-35 and 1941). He pitched in 20 MLB seasons (1929-30, 1932, 1934-48, 1952-53 … Robins/Dodgers, Cubs, Browns, Nationals, Red Sox, Tigers, Athletics, Yankees, Giants).  His final stat line was 211-222, 3.98.

Ray Kremer – In 1930, righthander Ray Kremer went 20-12, 5.02 for the Pirates. It was Kremer’s second 20-win season.  In 1926, he had gone 20-6, 2.61 for the Pirates – leading the NL in wins, winning percentage and ERA (2.47). Kremer had a solid 10-year MLB career (1924-33), all with the Pirates. He had only one sub-.500 season and won 15 or more games in seven of his ten MLB campaigns.  Kremer’s final line was 143-85, 3.76.

_______________________

This look at the highest earned run average among 20-game winners, led me (as one would expect) to search out the lowest ERA among 20-game winners.

Lowest Earned Run Average in a Season of 20 or More Wins – 1.04

Mordecai “Three Finger” Brown, 1906 Cubs

Photo: Paul Thompson, Public domain, via Wikimedia Commons

In 1906, righthander Mordecai Brown went 26-6 for the Cubs – and put up the lowest ERA ever in a season of 20 or more wins (1.04).  He made 36 appearances, completed 27 of 32 starts and led the NL in shutouts with nine.  Over the course of the season, Brown gave up more than two runs in just four games. From July 28 through September 13, he appeared in 14 games (11 starts) and went 11-0 with three saves (awarded retroactively). Over that span, He completed ten of his 11 starts and the eight runs he surrendered were all unearned.

The Hall of Famer went 239-130, 2.06 in 14 MLB seasons (1903-1916 … Cardinals, Cubs, Reds, and the Federal League St. Louis Terriers & Brooklyn Tip Tops).  He won 20 or more games in six seasons (consecutively from 1906 through 1911).


Honorable Mention … Bob Gibson, 1908 Cardinals

Bob Gibson came the closest to Mordecai Brown (above) among 20+ game winners, posting a 1.12 earned run average, while going 22-9 for the 1968 Cardinals. Gibson led MLB that season in ERA, as well as in shutouts (13).  He completed 28 of 34 starts. From June 6 through July 30 of that season, Gibson started, completed and won 11 games, throwing eight shutouts and giving up just one run in each of three other starts. 

The Hall of Famer pitched in 17 MLB seasons (1959-75), all for the Cardinals. He was an All Star in eight seasons, won 20 or more games in five and was a two-time Cy Young Award winner. He finished at 251-174, 2.91.  


Fewest Games Pitched in a Season of 20 or More Wins – 26

Fred Goldsmith & Jesse Tannehill

Fred Goldsmith, 1880, Cubs

In 1880, 24-year-old righty Fred Goldsmith – one of professional baseball’s earliest curveball specialists – went 21-3, 1.75 for the National League Champion Cubs (67-17-2). He pitched in just 26 games (24 starts) and put up a 1.75 Earned Run Average over 210 1/3 innings. (The National League ERA was 2.37 that season.) Goldsmith won 20 or more games four times in a six-season MLB career (112-68, 2.73 from 1879 through 1884).  A sign of the times: He threw 174 complete games in 185 starts.

Jesse Tannehill, 1902, Pirates

Southpaw Jesse Tannehill went 20-6 for the 1902 Pirates, pitching in 26 games (starting 24) and completing 23. He put up a 1.95 ERA in 231 innings pitched. (The 1992 NL average ERA was 2.78.) The Pirates went 103-36-3, finishing first in the National League. Tannehill pitched in 15 MLB seasons (1894, 1897-1909, 1911 … Reds, Pirates, the AL Boston Americans, Nationals). He won 20 or more games in six seasons – a high of 25 (13 losses) for the 1898 Pirates.

Pretty Darn Close

In 2014, Dodger lefty Clayton Kershaw came close to this record, going 21-3, 1.77 in 27 games (all starts). He led the NL in wins, winning percentage (.875), ERA and complete games. During the season, Clayton threw five complete games and pitched seven or more innings in 22 of his 27 starts and only gave up more than three runs once. Thus far, in his 16-season MLB career, Kershaw has won 20 or more games in two seasons, won three Cy Young Awards and been al All Star ten times.

______________________________

Fewest Starts in a Season of 20 or More Wins – 20

Bob Grim, 1954 Yankees

Photo: Jay Publishing via tradingcarddb.com, public domain, via Wikimedia Commons

In 1951, As a 21-Year-old in the Yankee farm System, righthander Bob Grim went 16-5, 2.58 at A and Double-A.  After this breakout year, his professional career was interrupted by military service. Although, as a Marine, he did pitch in 1952 and 1953 for the Camp Lejeune baseball team.

Grim’s service experience apparently served him well. In 1954, Grim made the Yankee squad out of Spring Training. He went on to a 20-6, 3.26 record and the 1954 AL Rookie of the Year Award. In the process, he compiled the fewest starts ever for an MLB 20-game winner (20 starts out of 37 appearances). That season, he went 12-6, 3.50 (with eight complete games) as a starter and 8-0, 2.70 in 17 games in relief.

Grim enjoyed an eight-season MLB career (1954-60, 1962 … Yankees, Athletics, Indians, Reds, Cardinals), going 61-41, 3.61 in 268 appearances (60 starts). That rookie season was his only 20-win campaign (his next high was 12 wins in 1957) and also marked his single-season highs in starts (20), complete games (8), innings pitched (199), and strikeouts 108).

_____________________________________


How About Those Rookies?  And a Rarity.

The fact that Bob Grim won 20 games in his rookie season led me to examine other rookie twenty-game winners.  On this one, I just took a look at rookie 20-game winners since 1900. (From 1872 through 1899 – 28 seasons – 48 rookies won 20 or more games in a season.  Since 1900, just 32 rookies have achieved that feat.)

I found another rarity – in the major-league career of Henry Schmidt.  Schmidt not only was a 20-game winner (22-13, 3.83) as a 30-year-old rookie for the 1903 Brooklyn Superbas, he is the only pitcher to win 20 or more games in his only MLB season.

Schmidt had been a star in the minor- and independent-leagues before he signed with the Superbas for the 1903 season. In 1902, he had gone 35-20 for the California League Oakland Clamdiggers. A gutsy performer (perhaps effectively wild), known for his ability to get into and out of trouble, Schmidt was the ace of the Brooklyn staff, despite having the highest ERA among the main pitchers in the rotation. After the season, Brooklyn offered Schmidt a healthy raise for 1904, but he returned the contracts unsigned, telling the team Eastern living was not for him. He instead signed with the Oakland Oaks of the Pacific Coast League. He never returned to the major leagues.

Schmidt is included in the chart below, which lists all rookies (since 1900) to win twenty or more games in a season – and notes which ones accomplished the feat in their debut seasons (rookie status can carry over if a pitcher logs less than 50 innings), as well las which rookies recorded just the one campaign of 20 or more wins.

______________________________________________


Special Mention – Something Old/Something New – Something Worth the Wait 

Photo by Keith Allison

In 2008, the Yankees’ Mike Mussina – at 39 years of age and in his 18th major-league season – tried something new.  The Hall of Famer won 20 games in a season for the first time in his career.  In the process he became the oldest MLB player to win 20 games for the first time, as well as setting the mark for the most seasons in the major leagues before recording a first 20-win campaign.  But wait, the story gets better. Mussina picked up that 20th win with a six -inning scoreless stint on September 28, as New York topped the Red Sox 6-2. It came in his 537th and last-ever MLB mound appearance. (Mussina retired after the season.) He finished the season at 20-9, 3.37 – and ended his MLB career with as 270-153, 3.68 record. 

_________________________________________________


How About a Look at Some Striking Statistics?

Most Strikeouts in a season of 20 or more wins – 513

Matt Kilroy, 1886 Baltimore Orioles, American Association

Matt Kilroy went 29-34, 3.37 as a 20-year-old rookie for the 1886 Baltimore Orioles. In the process, he started 68 games, completed 66 and fanned 513 batters in 583 innings.

Matt Kilroy’s 513 strikeouts in 1886 are the most ever in an MLB season.

Kilroy provides a prime example of the impact of overwork on pitchers’ arms in the early days of baseball.  In his first four seasons, he averaged 30 wins, 25 losses, 494 innings pitched, a 3.26 ERA and 270 strikeouts per campaign. In his final six seasons, he averaged just three wins (six losses), 77 innings pitched, a 4.37 ERA and 15 strikeouts.

 Since 1900 – Nolan Ryan, 1973 Angels, 383

Hall of Famer Nolan Ryan went 21-16 for the 1973 Angels and fanned 383 batters in 332 2/3 innings. – tossing 26 complete games in 39 starts. Ryan pitched in 27 MLB seasons, going 324-292, 3.19. He fanned a record 5,714 batters in 5,386 innings and topped 300 whiffs in six seasons.

 Fewest Strikeouts in a Season of 20 or More Wins – 18

William Cherokee Fisher, 1875 Philadelphia Whites

In 1875, Cherokee Fisher went 22-9. 1.99 for the National Association’s Philadelphia Whites. He fanned just 18 batters in 358 innings. Note:  In 1875, the NA’s overall ERA was 2.23 and pitchers averaged just one whiff per nine innings. (If he had fanned batters at the league-average rate, Fisher would have recorded 40 strikeouts.) Fisher pitched in seven MLB seasons (1871-76, 1887) in the National Association and National League – going 56-84, 2.61. 1875 was his only 20-win season.

 Since 1900 – 24 – Harry “Slim” Sallee, 1919 Reds

At 6’3” and 180-pounds, Slim Sallee earned his nickname. In 1919, in his 12th MLB season, at the age of 34, he had his only 20-win season (21-7, 2.60 for the Reds). He fanned just 24 batters in 227 2/3 innings. That season, NL pitchers averaged 2.9 whiffs per nine innings – which means had he fanned batters at the league-average pace, Sallee would have whiffed 73 batters. Sallee pitched in 14 MLB seasons (1908-1921 … Cardinals, Giants, Reds), going 174-143, 2.56.

In his lone 20-win campaign, Slim Sallee fanned just 0.9 batters per nine innings, the lowest figure of his MLB career (he averaged 2.7 whiffs per nine over his 14 MLB seasons).


Winning Percentage. It was the Best of Times – It was the Worst of Times.

The best and worst winning percentages among pitchers wining 20 or more games in a season both occurred before 1900.

Photo: Boston Red Stockings, Public domain, via Wikimedia Commons

Best – .915 – Al Spalding, 1875, Red Stockings. In 1875, Al Spalding of the National Association Boston Red Stockings went 54-5. 1.59 for a .915 winning percentage (the best ever among pitchers winning 20 or more games in a season.) Spalding pitched in 72 of the Red Stockings’ 79 games, starting 62 of them (52 complete games). Hall of Famer Spalding pitched in seven MLB seasons (1871-77).  He finished 251-65, 2.13 – with five seasons of 38 or more wins.

Worst – .333 – Jim McCormick, 1879 Cleveland Blues. Jim McCormick went 20-40 for the 1879 Cleveland Blues (NL) for a .333 winning percentage – the worst ever for a pitcher winning 20 or more games in a season. McCormick pitched in ten MLB seasons (1878-87, going 265-214, 2.43). He nearly reversed his W-L record in 1880, going 45-28, 1.85 for the Blues. Overall, he won 20 or more games in ten seasons (40 or more twice).

  • Best Since 1900 – .893  – Ron Guidry, 1978 Yankees. Now, if you want to look at the high and lows since 1900, the best winning percentage among 20-game winners belongs to the Yankees’ Ron Guidry, who went 25-3 (an .893 percentage), 1.74 in 1978. Guidry went 170-91, 3.29 over 14 seasons (1975-88), all with the Yankees. He won 20 or more games in three campaigns.

Worst Since 1900 – .488 – Irv Young, 1905 Boston NationalsJim Scott, 1913 White Sox. Young and Scott put up 20-21 records in those seasons. Young’s came in his rookie year (and was his only season with 20 or more wins). He pitched in six MLB seasons (1905-08, 1910-11 … Boston Nationals, Pirates, White Sox) and went 63-95, 3.11. Scott pitched in nine MLB seasons (1909-1917), all with the White Sox He went 104-114, 2.30 and twice won 20 or more games in a season. His career stat line was 107-214, 2.30.

 20-20 Vision – An Eyeful of Wins & Losses

Photo: Texas Rangers via tradingcarddb.com, public domain, via Wikimedia Commons

Looking at those 20-21 seasons (Irv Young & Jim Scott, above) got me to thinking about players who won and lost twenty or more games in the same season. Not a rarity early on. It happened 141 times before 1900.  Rare since 1900 though – only 11 such seasons. As the chart below shows, the most recent such instance is credited to the Braves’ Phil Niekro, who went 21-20, 3.39 in 1979, leading the NL in wins and losses in the same season. Notably, Phil’s brother Joe tied Phil for the NL lead in wins, with 21 (11 losses) for the Houston Astros. A Hall of Famer, knuckleballer Phil pitched in 24 MLB seasons (1964-87 … Braves, Yankees, Indians, Blue Jays), going 318-274, 3.35. He won 20 or more games twice and lost 20 or more twice.  From 1977 through 1980, he led the NL in losses four consecutive season.  In each of those seasons, the Braves finished last.


More one thing leads to another: Phil Niekro’s season of winning and losing at least 20 games and doing it for a last-place squad led me down another rabbit hole: Pitchers with at least 20 wins for a last-place team. It’s happened a lucky 13 times.  Here’s the list.


How About 40-40 Vision? Quite a Turnabout.

Only three pitchers recorded (separate) seasons of 40 wins and 40 losses during their MLB careers.

Will White won 43 games for the 1879 Reds (43-31, 1.99) and the very next season lost 42 games for the Reds (18-42, 2.14).  White pitched in 10 MLB seasons (1877-1886 … NL Boston, Reds and Wolverines and the American Association Cincinnati franchise). He won 229 and lost 166, with a 2.28 ERA. He won 20 or more games five times, including three seasons of 40 or more wins. He led the American Association with 40 wins in 1882 and 43 in 1883.

Jim McCormick lost 40 games (20 wins) for the 1879 Cleveland Blues and turned around to win 45 games (28 losses) for the Blues the following season. McCormick pitched in ten MLB seasons (1878-87 … NL Indianapolis Blues, NL Cleveland Blues, Union Association Cincinnati Outlaw Reds, NL Providence Grays, NL Cubs, NL Allegheny City). He won 20 or more games in eight of those seasons and lost 20 or more in six.

George Bradley, won 45 games (19 losses) for the 1876 St. Louis Brown Stockings (NL) and lost 40 (13 wins) for the 1879 Troy Trojans (NL). Bradley pitched in nine MLB seasons (1875-77, 1879-1884 …  the NL St. Louis Brown Stockings, Troy Trojans, Providence Grays, Detroit Wolverines and Cleveland Blues; the American Association Philadelphia Athletics; the Union Association Cincinnati Outlaws). He went 172-151, 2.43, with three seasons of 20 or more wins and three seasons of 20 or more loses.

A few Other 20-win factoids:

  • As you might guess, Cy Young holds the record for the most twenty-win seasons in a career (16) and the most consecutive seasons of 2o or more wins (14). Young pitched in 22 MLB seasons and went 511-315, 2.63.
  • Al Atkinson is the only MLB pitcher to have a season of 20 or more wins while pitching for three different teams. In his 1884 rookie season, he went 20-26, 3. 36 for the Union Association Baltimore Monumentals (3-5); Chicago/Pittsburgh of the Union Association (6-10); and Philadelphia Athletics of the American association (11-11).
  • Grover Alexander (1916 Phillies) and George Bradley (1876 St. Lous Brown Stockings) share the record for the most shutouts thrown in a season of 20 or more wins (16). Alexander went 33-12, 1.55 and Bradley went 45-19, 1.23) in their record-setting seasons.
  • Denny McLain (1966 Tigers) gave up the most home runs in a season of 20 or more wins (42). He went 20-14, 3.92 that season.
  • The fewest hits allowed per nine innings in a season of 20 or more wins is 5.3 – Luis Tiant, 1968 Indians, in a 21-9, 1.60 season.
  • The youngest-ever 20-game winner was 17-year-old Willie McGill, who went 20-14 for the American Association Cincinnati Kelly’s Killers and St. Louis Browns in 1891. McGill went 2-5 for Cincinnatti and 18-9 for St. Louis.
  • The oldest pitcher to log a season of 20 or more wins was the Braves’ Warren Spahn, who went 23-7, 2.60 – as  a 42-year-old – in 1963.  Spahn tossed 22 complete games in 33 starts that season.

Primary Resources:  Baseball-Reference.com; Elias Sports Bureau; Baseball Maniac’s Almanac Sixth Edition, Bert Randolph Sugar, Sports Publishing, 2023.

Remember, There is still time to vote in The Baseball Roundtable Fans’ Hall of Fame Balloting (and qualify for the prize drawing). Click here to go directly to the ballot.  Click here for a post taking a look at the career of the player on the ballot.


Baseball Roundtable – Blogging Baseball Since 2012.

100Baseball Roundtable is on the Feedspot list of the Top 100 Baseball Blogs.  To see the full list, click here.

Baseball Roundtable is also on the Anytime Baseball Supply Top 66 Baseball Sites list.  For the full list, click here

I tweet (on X) baseball @DavidBaseballRT

Follow/Like Baseball Roundtable’s Facebook Page here.  Find More baseball commentary; blog post notifications; PRIZES.

Member: Society for American Baseball Research (SABR); Negro Leagues Baseball Museum; The Baseball Reliquary.

P1013

Baseball Roundtable 2024 (unofficial ) Baseball Hall of Fame Fan Ballot

The 2024 Baseball Writers Association of America (BBWAA) Baseball Hall of Fame ballots are out – and that means the 2024 Hall of Fame Debate Season is officially underway!  Eligible BBWAA members have until December 31 to cast their ballots (they can vote for up to ten candidates), with results announced January 23, 2024 and the 2024 Induction Ceremony slated for July 21.  This year’s traditional ballot includes 14 holdovers from last year, along with 12 newcomers.  This also means the Baseball Roundtable (unofficial) Baseball Hall of Fame Fan Ballot is once again open for voting. This unofficial balloting will officially close at midnight January 2. 

In this post, BBRT will share:

  • The Roundtable’s predictions for the official BBWAA balloting; BBRT’s ballot (if I had one);
  • A deep look at all the candidates on the ballot; and
  • A link to BBRT’s unofficial fan ballot – please take a few minutes to follow the link and cast your votes – you could become eligible for a baseball card and bobblehead surprise package.

—PARTICIPATE IN BASEBALL ROUNDTABLE’S  2023 FANS’ HALL OF FAME BALLOT—


Baseball Roundtable is once again conducting an unofficial fan ballot – to cast your vote(s), click here.   Remember, you can vote for up to ten of the nominees for 2024 induction.  If you want to read through the nominees’ bios first, there is another link to the BBRT Fan Ballot following the bios (near the end of this post).  BBRT will be providing updates on the fan balloting, as well as a post-election comparison of fan votes as compared to the final BBWAA results.

Also, if you leave your email address in the Contact Info section at the end of the ballot, you will be entered in a bobblehead and baseball card “surprise-prize” drawing.  You will find a link to the ballot after the biographies.

To skip the post and go directly to the fan ballot, click here.

As you consider this year’s slate of candidates, BBRT would stress that all the players on the ballot – even those who remain for only one voting cycle – deserve recognition. To rise to the major leagues, last ten years and make it past the Hall of Fame Screening Committee is a significant accomplishment in itself.  In fact, the annual ballot release is a highlight for Baseball Roundtable, as it provides a chance to acknowledge the accomplishments of all the candidates – not just the favorites for election.  For example, a review of this year’s ballot gives us the opportunity to honor Mark Buehrle’s perfect game; the 30-30 seasons of Brandon Phillips and David Wright; Bobby Abreu’s 30-40 season; Jose Bautista’s nickname and 54-homer season; Jose Reyes’ batting title; Matt Holliday’s season-opening 45-game streak of reaching base safely; and more.

Now on to the official 2023 Baseball Hall of Fame election process itself – and, then, a look at the players on the ballot for 2023.

BASEBALL HALL OF FAME ELIGIBILITY/CRITERIA FOR ELECTION

The basic rules for eligibility are that a player must have played at least ten seasons and be retired for at least five years. In addition, the player must be approved for the ballot by the Hall of Fame Screening Committee.

A player can remain on the ballot for up to ten years, but must receive at least five percent of the vote in the preceding year’s ballot to remain on the ballot.  Each voter can vote for up to ten candidates.  Election requires that a player be named on at least 75 percent of the ballots cast.

The criteria for election: “Voting shall be based upon the player’s record, playing ability, integrity, sportsmanship, character, and contributions to the team(s) on which the player played.”

A few preliminary comments form Baseball Roundtable.

This year’s ballot has a strong cadre (12) of first-time candidates, led by Adrian Beltre, Joe Mauer and Chase Utley. I expect at least one of those (perhaps two) to be elected and about half of the twelve first-timers to garner enough support to remain on the ballot.  In contrast, in 2023, when there were 14 first-timers on the ballot, none were elected and 12 dropped off the ballot.

Voters have shown a willingness to vote in first timers.  In the last ten elections 14 first-timers have been granted a ticket into the Hall: 2022 – David Ortiz; 2020 – Derek Jeter; 2019 – Mariano Rivera & Roy Halladay; 2018 – Chipper Jones & Jim Thome; 2017 – Ivan Rodriguez; 2016 – Ken Griffey, Jr.; 2015 – Randy Johnson, Pedro Martinez & John Smoltz; 2014 – Greg Maddux, Tom Glavine,&  Frank Thomas.

The 2023 ballot also includes just one player in his final year of eligibility – Gary Sheffield. In the past three elections, Sheffield has moved from 40.6% to 55.0%.  Twenty points seems an unlikely jump.

The holdovers with the most support year ago are  Todd Helton (72.2%), Billy Wagner (68.1%) and Andruw Jones (58.1%). The Hall seems withing striking distance for Helton and Wagner and I expect them to make the trip.

Baseball Roundtable Predictions for the BBWAA Balloting: This year I expect Todd Helton and Billy Wagner to get the call, along with first-time nominee Adrian Beltre. I also have a good feeling about Joe Mauer’s chances to join Beltre as a first-time electee.  (More thoughts on individual candidates in the bios.)

Again, to jump directly to the ballot itself, click here.

— PLAYERS WHO WOULD GET BBRT’S VOTE –

Adrian Beltre – 3B, 1998-2018 (Dodgers, Mariners, Red Sox, Rangers) … First Year on the Ballot

Photo: Cacophony, CC BY-SA 3.0 <http://creativecommons.org/licenses/by-sa/3.0/>, via Wikimedia Commons

Adrian Beltre offers a combination that always impresses The Roundtable – lumber and leather.  He not only swatted 477 home runs over his career, but also earned five Gold Gloves and four Silver Slugger Awards (precious metal in The Roundtable’s view).

Beltre, signed by the Dodgers (out of the Dominican Republic) as a 15-year-old in 1994 (the Dodgers were punished by MLB for signing Beltre before his 16th birthday), was in the majors by the age of 19 – and he was still an active major-leaguer (119 games) in 2018 (his age-39 season).

Beltre was a three-time All Star. He led his league in home runs once (with 48 for the Dodgers in 2004) – and had nine seasons of 25 or more homers, as well as five seasons of 100+ RBI and seven seasons with an average of .300 or better. He also led the league in hits and doubles once each.

Cycling’s Yellow Hersey.

Adrian Beltre is one of just six players to hit for the cycle (single, double, triple, home run in one game) three times in his career.  He accomplished the feat with the Mariners in 2008 and the Rangers in 2012 and 2015. Others on this short list include: John Reilly, Bob Meusel, Babe Herman, Christian Yelich and Trea Turner.

Beltre is among MLB’s top-50 all time in: base hits (3,166 – 18th); doubles (636 – 11th); home runs (477 – 31st); extra-base hits (1,151 – 15th); total bases (5,309 – 15th); and RBI (1,707 – 25th).  In the field, Beltran is second all-time in putouts at third base (2,194 and five seasons leading the league); third in assists at third base (5,182, once leading the league); and second in double plays at third base (523, once leading the league).

Adrian Beltre’s Best Season: In 2004, Beltre went .334-48-121 for the Dodgers – leading the league in home runs. That season he also collected a career-high 200 hits, scored a career-high 104 runs; and delivered a career-best 376 total bases.

_______________________________________

Todd Helton – First Base, 1997-2013 (Rockies) … Sixth year on the ballot, 72.2 percent last year.

Todd Helton moved from 16.5% of the vote to 72.2% percent between his first and fifth years on the ballot. It looks like this should be the year for Helton. Helton was hampered a bit in hie early years on the ballot by the fact that he spent his entire 17-year career with the Rockies (playing half his games in hitter-friendly Coors field).  Helton, who put up a .316 career average, hit .345 at home and .287 on the road. Despite that split, Helton’s body of work clearly deserves Hall of Fame consideration.

Helton was a five-time All Star, three-time Gold Glover and four-time Silver Slugger. He hit over .300 in 12 seasons – and won the NL batting crown in 2000 with a .372 average. His 59 doubles that season are tied for the seventh-most all-time. Helton drove in 100 or more runs in five seasons and scored in triple figures six times. His 1,335 walks (38th all-time) indicate the respect he earned at the plate.  Helton also ranks fifth in games played at first base, third in career assists at the position, 13th in putouts and third in double plays.


400 Rocks

Todd Helton is one of only 18 players to reach 400 or more total bases in a season – and one of only seven players to have multiple 400+ total base campaigns. He is also one of only 12 players with 100 or more extra-base hits in a season; one of only three with multiple seasons with at least 100 extra-base hits and the only player with consecutive seasons of 100 or more extra-base hits (2000-2001).

Todd Helton’s Best Season: In 2000, Helton won the NL batting crown with a .372 average – and also led the league in base hits (216), doubles (59), RBI (147), on-base percentage (.463), slugging percentage (.698) and total bases (405).  He also scored 138 runs and hit 42 home runs.

He gets BBRT’s vote (as he has in the past). I expect this is his year to pass 75 percent.

__________________________________

Billy Wagner – LHP, 1995-2010 (Astros, Phillies, Mets, Red Sox, Braves) … Ninth year on the ballot, 68.1 percent last year.

Billy Wagner was a seven-time All Star, who amassed 422 saves (sixth all-time) in a 16-season MLB career.  He had nine seasons of 30 or more saves; a career ERA of 2.31; 1,196 career strikeouts in 903 innings; and 47-40 won-lost record.

_____

Whiff-and-Poof

In 1992, playing for Ferrum College, Billy Wagner set an NCAA record for strikeouts per nine innings in a season at 19.3.

_____

Billy Wagner’s Best Season: In 2003, Wagner went 1-4, 1.78 for the Astros, saving 44 games and fanning 105 batters (and walking just 23) in 86 innings.

BBRT thinks Wagner belongs in the Hall (based on his 400+ saves) – and hopes that momentum continues to build.  Wagner has been gaining more support lately – in the last five ballots his percentages have gone 16.7, 31.7, 46.4 and 51.0, 68.1.  He should gain more ground in this year’s ballot, and has a good chance to make the 75 percent mark.  He gets my vote.

________________________________

Joe Mauer – C/1B, 2004-2016 (Twins) … First Year on the Ballot.

Photo: Keith Allison from Hanover, MD, USA, CC BY-SA 2.0 <https://creativecommons.org/licenses/by-sa/2.0>, via Wikimedia Commons

Maybe I’m being a homer (living in the Twin Cities), but I believe Mauer has earned a first-ballot selection. Consider that among players playing primarily catcher, Maurer is:

  • The first and still only AL catcher to win a batting title;
  • One of just seven major-league catchers to win a batting title (Negro Leagues records form 1920-48 are now considered major league);
  • One of just two catchers to win three batting titles (the other is Josh Gibson, who won three Negro National League II batting titles).

Mauer was a six-time All star and the 2009 American league MVP – and has three Gold Gloves and five Sliver Slugger Awards on his Hall of Fame resume

Mauer was primarily a catcher from 2004 until 2013, when a  concussion led to a move to first base. During those ten seasons behind the plate, he hit .323-105-634. Mauer’s final MLB stat line was .306-143-932, with 1,018 runs scored and 2,123 hits.

For The Roundtable, those ten pre-concussion seasons – with three batting titles, an MVP Award, six All Star selections, five Silver Sluggers and three Gold Gloves is enough to put Mauer in the Hall.  He gets my vote.

Joe Mauer’s Best Season:  In 2009, Joe Mauer hit .365, with 28 home runs, 96 RBI and 94 runs scored. He led MLB in average and on-base percentage (.444) and led the AL in Slugging percentage.  He was the AL MVP, getting 27 of 28 first place votes.

-________________________________________

Carlos Beltran – Outfield, 1998-2017 (Royals, Astros, Mets, Giants, Cardinals, Yankees, Rangers) … Second year on the ballot, 46.5 percent last year.

Photo: djprybyl on Flickr (Original Versions) UCinternational (Crop), CC by 2.0 <https://creativecommons.org/licenses/by/2.0>, via WikimediaCommons

Carlos Beltran played in 20 MLB seasons He had his best years with the Mets, making the All-Star team in five of seven seasons. (Beltran was a nine-time All Star.)

____________________

Let’s Get This Party Started

Beltran was the American League Rookie of the Year in 1999, when he hit .293-22-108 for the Royals, with 27 steals and 112 runs scored.

___________________

In his 20 MLB campaigns, Beltran hit .279-435-1,587, with 312 stolen bases and 1,582 runs scored. He ranks in MLB’s top 50 in home runs (47th), RBI (41st) and total bases (34th). His 2,725 hits are 62nd all-time and his 1,582 runs scored 53rd.

Not Exactly Playing It Safe, But It Works

Among players with at least 200 stolen base attempts, Carlos Beltran’s 86.4 percent success rate is fourth all-time.

Beltran drove in 100 or more runs in eight seasons, scored 100 or more runs in seven seasons, hit 30+ home runs in four campaigns (a high of 41 in 2006), stole 25 or more bases five times (a high of 42 in 2004). He was also a three-time Gold Glover.  Beltran was also a solid post-season performer, hitting .307-16-42 in 65 post-season games. In 2004, with the Astros, he hit .435, with 20 hits, eight home runs, 14 RBI, 21 runs scored and six steals in 12 post-season games (NL Division Series & NL Championship Series).  You read that right, 21 runs scored in 12 games.

Carlos Beltran’s Best Season: In 2006, Beltran hit .275, with 41 home runs, 116 RBI, 127 runs scored and 18 stolen bases and also won a Gold Glove. He finished fourth in the NL MVP voting.

Beltran would get Baseball Roundtable’s vote and I expect him to finish in the neighborhood of 57-60 percent in this year voting. His .279 career average and the fact that he never led the league in any of the major offensive categories may cost him a few votes. Longer-term, I’d say h Hl is in nis future. Right now, he gets my vote.

_______________________________

Andruw Jones – CF, 1996-2012 (Braves, Dodgers, Rangers, White Sox, Yankees) … Seventh Year on the Ballot, 58.1 percent last year.

Carl Fredrickson (Digi360) from Roswell, GA, USA, CC BY 2.0 <https://creativecommons.org/licenses/by/2.0>, via Wikimedia Commons

In a 17-season career – primarily patrolling centerfield – Jones won ten Gold Gloves (consecutively, 1998-2007). He was a defensive icon in the garden. At the plate, he hit .254, with 434 home runs (48th all-time), 1,289 RBI and 1,204 runs scored. He topped 25 home runs in ten seasons (six over thirty and a league-leading and career-high 51 in 2005). He scored 100 or more runs four times, drove in 100+ five times and stole twenty or more bases in a season four times.  Jones appeared in 76 post-season games, hitting .273, with ten home runs and 34 RBI.

On the Big Stage

In the 1996 World Series, Andruw Jones – just 19-years-old – hit .400 (8-for-20) with two home runs and six RBI, becoming the youngest player to go yard in the Fall Classic.

Andrew Jones’ Best Season: In 2005, Jones hit only .263, but led the NL in home runs (51) and RBI (128) and won a Gold Glove for his play in CF.  He finished second in the MVP voting to Albert Pujols (.330-41-117).

Jones’ ten Gold Gloves work in his favor, but – over the long haul – that .254 average (he only hit .300 or better once and over .270 only four times) dampen his HOF chances. Still that power and his defense get him Baseball Roundtable’s vote. And, he is showing momentum. His vote total in recent balloting:  2020 – 19.4%; 2021 – 33.9%;2022 – 41.4%; 2023 – 58.1%. This may not be his year, but he still has time. I expect him to move up a few percentage points in this year’s balloting.

_________________________________

Francisco Rodriguez – RHP, 2002-17 (Angels, Mets, Brewers, Orioles, Tigers) – Second year on the Ballot., 10.8 percent last year.

Photo: Toasterb at the English language Wikipedia project, CC BY-SA 3.0 <http://creativecommons.org/licenses/by-sa/3.0/>, via Wikimedia Commons

Francisco Rodriguez played in 16 MLB seasons, going 52-53, 2.86 with 437 saves (fourth all-time) in 948 mound appearances (21st all-time).

Rodriguez was a six-time All Star. He led the AL in saves three times and saved 40 or more games in six seasons and 20 or more in 11. In the five seasons from 2005 through 2009, he averaged 46 saves per season.

Rodriguez had an earned run average under 2.00 in two seasons and under 2.50 in seven campaigns. A true closer, Rodriguez pitched 976 innings in his 948 appearances, fanning 1,142 batters (10.5 per nine innings).

One of A Kind

Francisco Rodriguez, who saved 62 games for the 2008 Angels, is the only pitcher in MLB history with 60 or more saves in a season.

In his 2002 debut MLB season, the 20-year-old Rodriguez pitched in 11 post-season games for the Angels – recording five wins (one loss) – giving up four earned runs in 18 2/3 innings, while fanning 28. What makes this especially noteworthy is that Rodriguez made his MLB debut on September 18 of that season and went 0-0, with no saves in five games (5 2/3 innings). So, he had five post-season victories before he recorded his first regular-season decision of any kind.

Francisco Rodriguez’ Best Season: In 2008 (Angels), Rodriguez saved an all-time record 62 games – in 69 opportunities.  He put up two wins (three losses) and a 2.24 ERA in 76 appearances – and fanned 77 batters in 68 1/3 innings.

BBWAA voters have traditionally been very demanding of relievers (although the recent inductions of Mariano Rivera and Trevor Hoffman are a good sign – but they, of course, both had 600+ saves). It also helps that Lee Smith (478 saves) was elected by the Today’s Game Committee in 2019. Still given how long it’s taken Billy Wagner to move past the 65 percent mark, I don’t expect Rodriguez to make it this year.  I would expect him to move closer to the 20-25 percent4 line. He would get my vote.

_______________

Torii Hunter -(OF, 1997-2015 (Twins, Angels, Tigers) … Fourth Year on the Ballot, 6.9 percent last year.

Photo: Keith Allison, CC BY-SA 2.0 <htt[ps://creativecommons.org/licenses/by-sa/2.0>. via Wikimedia Commons

Okay, this may be a bit another “homer” vote, since Torii Hunter was a star with my home team Twins – but it also reflects my special admiration for “leather and lumber” guys. Torii Hunter played 19 MLB seasons and was a five-time All Star, nine-time Gold Glover and two-time Silver Slugger.

For his career, Hunter hit .277 (2,452 hits), with 353 home runs, 1,391 RBI, 1,296 runs scored and 195 stolen bases. He hit 20+ home runs in 11 seasons, drove in 100+ runs twice and stole 20+ bases in three campaigns. Hunter hit .274-4-20 in 48 post-season games.

Hunter led his league in CF assists three times, CF putouts once and double plays turned out of CF four times. He also led his league’s right fielders in putouts, assists and double plays once each.

Spider-Man

Torii Hunter earned the nicknamed spiderman for his outstanding outfield play.

Torii Hunter’s Best Season:  In 2007 (Twins), Hunter hit .287, with 28 home runs, 107 RBI, 94 runs scored and 18 steals – although he can look back on at least four seasons with very similar numbers.

Nine Gold Gloves, five All Star selections and 353 home runs represent some pretty good credentials.   Hunter’s chances to make the Hall would have been better with a couple of standout/spectacular/memorable seasons mixed in with all those consistently very, very good campaigns that fans came to expect.  He also earns extra credit for leadership and character, as he was known as a leader in the club house and an asset in the community. He may slip off the ballot this year, but he gets my vote.

___________________________________________

Photo: Keith Allison on Flickr. Cropped by User: Staxringold., CC BY-SA 2.0 <https://creativecommons.org/licenses/by-sa/2.0>, via Wikimedia Commons

Andy Pettitte – LHP, 1995-2010, 2012-13 (Yankees, Astros) … Sixth year on the ballot, 17.0 percent last year.

As I’ve noted in past years, I had to think for a while on this one (and will probably get some push back from readers), largely because a major part of Andy Pettitte’s HOF resume was achieved in the post-season and there was some PED-controversy surrounding Pettitte.  (Note: Pettitte admitted to using HGH while recovering from elbow surgery – a couple of years before the substance was banned.  He took responsibility and apologized.)

Pettitte holds the MLB post-season marks for most wins (19 … versus 11 losses), innings pitched (276 2/3), games started (44) and is fourth in strikeouts (183). His post-season accomplishments include a 3.81 career ERA and the 2001 American League Championship Series MVP Award.

Pettitte also was no slouch in the regular season. He finished with 256 wins (153 losses) and a 3.85 ERA. His 256 wins currently rank 43rd all-time and his 521 starts 41st.  Pettitte won 20 games in two seasons and 14 or more games 12 times – leading the AL with 21 wins in 1996. The three-time All Star struck out 2,448 batters (46th all-time) in 2,316 innings.

Ready, Willing and Able …

Andy Pettitte started 30 or more games in a season 12 times, leading his league three times (1997, 2006, 2007).

Andy Pettitte’s Best Season: In 1997, following a 21-8 campaign in 1996, Pettitte went 18-7, with a 2.88 ERA (fourth-best in the AL), leading the league in starts with 35, finishing third in innings pitched (240 1/3) and eighth in strikeouts (166).

Pettitte’s post-season numbers, plus 256 regular-season victories and the fact that he had 100+ more career wins than losses secure BBRT’s vote. He has a long way to go with the BBWAA voters. The Roundtable thinks he deserves better and see Pettitte as significantly  underrated by BBWAA voters.

_________________

Bartolo Colon – RHP 1997-2009, 2011-2018) … Indians, Expos, White Sox, Angels, Red Sox, Yankees, A’s, Mets, Braves, Twins, Rangers.

Photo: Jeffrey Hayes, CC BY 2.0 <https://creativecommons.org/licenses/by/2.0>, via Wikimedia Commons

Okay, Bartolo Colon was not originally on my “vote for” list, but looking a little deeper, I changed my mind.  How can you not like a guy, who pitches until he’s 45-yers-old, is listed in baseball-refence.com as 5’11’ and 285 pounds, takes the mound for eleven different MLB teams, practically explodes with his love for the game, wins 247 games and carried the nickname “Big Sexy.”

Bartolo Colon pitched in 21 MLB seasons, going 247-188, 4.12 in 565 appearances, (552 starts). He was a three-time All Star, won the 2005 AL Cy Young Award, won 15 or more games in eight seasons, fanned 2,535 batters in 4.461 2/3 innings.  He ranks 51st all-time in wins, 36th in strikeouts,

Ten-Four, Good Buddy

In 2002, Bartolo Colon started the season with the Indians and ran up a 10-4, 2.55 record before being traded to the Expos on June 27 – where he ran up a 10-4, 3.31 – giving him an evenly split 20-8 campaign.

Bartolo Colon’s Best Season.  In 2005, with the Angels, Colon was the AL Cy Young Award winner with a 21-8, 3.48 campaign

Just Put Up A Target, I’ll Do The Rest

On April 18, 2012, Bartolo Colon threw 38 consecutive strikes (pitching for the A’s against the Angels).  The streak lasted from the second pitch of the fifth inning to the seventh pitch of the eighth inning. A few stats: 35 of the pitches were fastballs; there was only one swing and miss; there were 17 called strikes; there were ten foul balls; ten balls were put in play. For the game, Colon went eight scoreless innings (four hits, no walks, five whiffs) in a 6-0 win.  He threw 108 pitches, 82 strikes.

Colon clearly had an exciting career, and 247 wins cannot be ignored. Ultimately, his 4.12 ERA may dampen HOF changes. This vote came from the heart.  It will be fund to see him on the ballot again in the coming year., although not as much fun as seeing him pitch.

Tired of reading? To cast your vote, click here. 

THE REST OF THE SLATE 

So, with BBRT’s unofficial ballot covered, let’s look at the remainder of candidates – in alphabetical order.  Note: Here you will find a host of players with solid (but perhaps not HOF-level) career numbers and accomplishments – as well as a few that remain on the sidelines for other reasons.

Bobby Abreu – OF, 1996-2012, 2014 (Astros, Phillies, Yankees, Angels, Dodgers, Meets) … Fifth Year on the Ballot, 15.4 percent one year ago.

A solid .291 career hitter (2,470 base hits), Abreu hit .300 or better in six seasons. He hit 20 or more round trippers in 10 campaigns, stole 20 or more bases 12 times (a high of 40 in 2004), drove in 100 or more runs eight times and scored at least 100 runs eight times.   Abreu also walked 1,476 times – including 100 or more free passes in eight straight seasons (1999-2006).

In the Top 50 … 

Bobby Abreu’s 1,476 walks are 20th all-time; his 574 doubles are 25th; his 3,733 putouts as a RF are 12th; and his 130 assists as a RF 28th. 

In 20 post-season games, Abreu went 19-for-67 (.284), with one home run and nine RBI.

Bobby Abreu’s Best Season: In 2004, as a Phillie, Abreu hit .301, with 30 home runs and 40 steals. An All Star that season, he also drove in 105 runs and scored 118.

Abreu’s 400 steals are an HOF plus, as are his 30-40 season in 2004 and his eight campaigns with 100 or more RBI.  Had he reached 300 home runs; it would have really boosted his status with the writers.  He’s also hurt by the fact that he only made two All Star teams in his 18 seasons.

_____________

Jose Bautista – OF/3B, 2004-2018 (Orioles, Rays, Pirates, Blue Jays, Braves, Mets, Phillies) … First Year on the Ballot.

In his 15 MLB seasons, Bautista was an All Star six times (consecutively 2010-15). Overall, he hit .247, with 344 home runs, 975 RBI and 1,022 runs scored in 1,798 games. He earned the nickname Joey Bats in Toronto, where he had his best seasons. From 2008 through 2017 (with the Blue Jays), he hit .253-288-766 and twice lead the AL in home runs (54 in 2010 and 43 in 2011).

Jose Bautista’s Best Season: In 2011, Bautista hit .302-43-103 – also scoring 105 runs and leading the MLB with 132 walks. (This, by the way, followed up a .260-54-124 season in 2010.)

A solid career, should be good enough to keep him on the ballot for 2025, but short of Hall of Fame expectations.

_______________________________________

Mark Buehrle – LHP, 2000-15 (White Sox, Marlins, Blue Jays … Fourth year on the ballot, 10.8 percent one year ago.

Mark Buehrle pitched in 15 MLB campaigns and threw 200 or more innings in all but his rookie and final seasons. Buehrle was a five-time All Star and put up a 214-160, 3.81 record, with 1,870 strikeouts in 3,283 1/3 innings. He twice led his league in starts and twice topped his league in innings pitched. He won ten or more games in 15 consecutive seasons and six times won 15 or more.  Buehrle also earned four Gold Glove Awards.

Near-Perfect and Perfect

Mark Buehrle’s HOF resume is bolstered by a no-hitter tossed on April 18, 2007 – when his White Sox topped the Rangers 7-0 and Buehrle faced the minimum 27 batters.  The only Texas’ base runner came on a fifth inning, one-out walk to Sammy Sosa, whom Buehrle then picked off first base.  Buehrle notched eight strikeouts in the game, which was so-o-o very close to a “perfecto.”

Buehrle got his perfect game two years later (July 23, m 2009), when he recorded a clean slate in a 5-0 ChiSox win over the Rays.  He fanned six in that one.

Mark Buehrle’s Best Season:  In 2005, Buehrle went 16-8, 3.12 for the White Sox.

If he had 250 wins to go with the no-hitter, perfect game and four Gold Gloves, Buehrle would have had my vote.  With 214 wins, no Cy Young Award and no 20-win season, Buehrle appears short of what voters are looking for.

____________________________

Adrian Gonzalez – First Base, 2004-18 (Rangers, Padres, Red Sox, Dodgers, Mets … First Year on the Ballot.

Adrian Gonzalez had a solid 15-season MLB career – hitting .287-317-1,202, with 2,050 hits and 997 runs scored.  He was a five time All-Star (2008-11) and picked up three Gold Gloves and a pair of Silver Slugger Awards. He led the league in hits once, RBI one and walks once.

Gonzalez hit 27 or more home runs in seven seasons (a high of 40 in 2009); drove in 100 or more runs in seven seasons; and scored 100+ runs in three campaigns.

Adrian Gonzalez’ Best Season: In 2011, Gonzalez hint .338-27-117, with a league-leading 213 hits and 108 runs scored for the Red Sox.

Gonzalez had some strong numbers, but the competition at first base if fierce. Still, there is plenty there to keep him on the ballot for next year.

______________________________________________

Matt Holliday – OF, 2007-18 (Rockies, Cardinals, A’s, Yankees,) … First year on the Ballot.

Matt Holliday fashioned a very good fifteen-season MLB career – hitting .299, with 316 home runs, 1,220 RBI and 1,157 runs scored over 1,903 games. He was a seven-time All Star and scored 100+ runs in four seasons, drove in 100+ in five seasons and hit 25 or more home runs five times (a high of 36 in 2007).

Matt Holliday’s Best Season: In 2007, Holliday (with the Rockies) led the NL in average (.340); hits (216); doubles (50); RBI (137) and total bases (386). That season he also hit a career-high 36 home runs.

Home Cookin’

Over his career, Holliday played 20.5 percent of his games at Coors field, where he hit .360. Away from Coors, he hit .283. In his highlight year, (2007), he hit .376-25-82 in 82 games at Coors and .301-11-55 in 76 games on the road.

___________________________

Let’s Get This Party Started

From Opening Day (April 5) through June 2, 2015, Matt Holliday (Cardinals) reached based safety in 45 consecutive games. During the streak, he hit .319 (50-for-157), with 30 walks, four HBP, three homers, 24 RBI and 18 runs scored.

__________________________

Holliday’s seven All Star selections, four Silver Slugger Awards, 2,000+ hits and 300+ homeruns should be more than enough should be enough to keep him on the ballot going forward.

____________________________________

Victor Martinez – C/1B/DH, 2002-11, 2013-18 (Indians, Tigers, Red Sox) … First Year on the Ballot

Victor Martinez – a switch-hitting catcher – was a five-time All Star, who hit .295-246-1,178 (with 914 runs scored) over 16 MLB seasons (1,973 games). He hit .300+ in nine seasons – and .330 or better in three of those.

Getting on with Getting ON

In 2014 Victor Martinez led the American League with a .409 on-base-percentage and a .974 OPS. It earned him a lot of respect, He also led MLB with 28 intentional walls.

Martinez hit 20 or more home runs in seven seasons, tallied 100+ RBI in five

Victor Martinez’ Best Season: In 2014, Martinez hit .335-32-103 for the Tigers. He collected 188 hits and scored 87 runs.  That season he finished second in the AL MP voting to the Angels’ Mike Trout (.287-36-111, with 115 runs scored).

The fact that Martinez spent about half his career as a DH may cost him some votes.

__________________________________________

Brandon Phillips – 2B, 2002-18 (Indians, Reds, Braves, Angels, Red Sox) … First Year on the Ballot.

Brandon Phillips hit .257-211-951, with 1,005 runs scored and 209 stolen bases over 17 MLB seasons. He was a three-time All Star and a four-time Gold Glover. Phillips twice scored 100 or more runs in a season and once drove in 100+. He stole 20 or more bases in five campaigns and hit 20 or more home runs in three seasons. In the field, he twice led NL second basemen in putouts, three times led in assists and three times posted the league’s best fielding percentage among keystone sackers.

Brandon Phillips’ Best Season:  In 2007 (Res), Brandon Phillips posted a 30-30 campaign. He hit .288, with 30 home runs, 32 steals, 944 RBI and 107 runs scored.

_____________________________________

Manny Ramirez – (Outfield, 1993-2011) – Eighth year on the Ballot, 33.2 percent last year.

Manny Ramirez played 19 MLB seasons, collecting 2,574 hits, a .312 batting average, 555 home runs (15th all-time) and 1,831 RBI (20th all-time). Ramirez was a 12-time All Star and led the AL in average (2002), home runs (2004) and RBI (1999) once each.  Ramirez won nine Silver Slugger Awards, including eight consecutive (1999-2006), hit .285 with 29 home runs in 111 post-season games and was the 2004 World Series MVP.  He hit 30 or more home runs in twelve seasons (five of 40+), scored 100 or more runs six times, hit .300 or better in 11 seasons and topped 100 RBI 12 times.

It’s Post Time …

Manny Ramirez’ 29 post-season home runs are first all-time, while his 78 post-season RBI rank second. In addition, he is the all-time post-season leader in walks (72, tied with Chipper Jones) and ranks third in post-season hits (117, tied with Jose Altuve) and fourth runs scored (67).

Manny Ramirez’ Best Season: In 1999, with Cleveland, Ramirez hit .333, with 44 home runs and 165 RBI (14th-most in a season all-time) in 140 games.

Ramirez clearly put-up HOF-caliber numbers, but two PED-related suspensions continue to hurt his chances.  Ramirez does not seem to be gaining much tractions.  In his first year on the ballot, he picked up 23.8 percent of the vote – and after seven years he is only at 33.2 percent.

_______________________________________

Jose Reyes, SS (2003-18 (Mets, Marlins, Blue Jays, Rockies) … First Year on the Ballot.

Jose Reyes was a solid contact hitter (.283 career average, with 2,138 hits in 1,877 games over 16 MLB seasons) with speed (four times leading the league in triples, three times in stolen bases.). The four-time All Star also led the league in hits once (with 204 in for the Mets in 2008) and won the 2011 batting title (Mets) with a .337 average. Reyes finished with 517 steals – 33rd all time.

From 2005 through 2008 (his age-22 through age-25 seasons), Jose Reyes’ averaged 158 games played, a .287 average, 195 hits, 32 doubles, 16 triples, 14 home runs, 66 RBI, 113 runs scored and 64 steals.

#InBaseballWeCount Everything

Jose Reyes is one of just eight major leaguers with 2,000 hits, 300 doubles, 100 triples, 100 home runs and 500 steals.

Reyes turned out to be a stronger candidate than The Roundtable expected. He should be back for another run at the Hall in 2025.

________________________________

Alex Rodriguez – SS/3B, 1994-2013, 2015-16 (Mariners, Rangers, Yankees … Third year   on the ballot, 35.7 percent last year.

Alex Rodriguez played 2,784 games over 22 MLB seasons.  He hit .295, with 3,115 hits (23rd all-time); 2,021 runs scored (eighth); 696 home runs (fifth) and 2,086 RBI (fourth).  He is also among MLB’s top 50 in total bases (seventh); doubles (33rd); walks (37th); and extra-base hits (seventh).

Rodriguez was a three-time league MVP, 14-time All Star and two-time Gold Glover.  He led his league in home runs five times and hit 30 or more long balls 14 times (with a high of 57 in 2002). He led his league in runs scored five times (with 100 or more in 13 seasons); led the league in RBI twice, (with 100 or more in 14 seasons and a high of 156 in 2007).  He also led the league in hits once; doubles once; average once (.358 in 1996); and total bases four times.

Alex Rodriguez’ Best Season:  So many to choose from here. Let’s go with his 2007 MVP season (Yankees), when he hit .314; led MLB in runs scored (143), home runs (54) and RBI (156); and led the AL in slugging percentage (.645) and total bases (376).

A-Rod’s numbers belong in the Hall, but I think his 2014 full-year PED-related suspension will keep him on the outside looking in for now.  To this point Rodriguez does not seem to be gaining much ground.  Last season his vote total only moved from 34.3% to 35.7%, which indicates the voters are still not very forgiving.   When (or if) the PED dam finally cracks (most likely first through Era Committee voting), Rodriguez should find his way into the Hall.  Right now, he has seven years for the voters to change their minds.

____________________________________

Jimmy Rollins – SS, 2000-2016 (Phillies, Dodgers, White Sox) … Third Year on the Ballot, 12.9 percent one year ago.

Jimmy Rollins was a three-time All Star, four-time Gold Glover and the 2007 NL MVP.  Over a 17-season MLB career, he hit .264-231-936, with 2,455 hits, 470 steals (46th all-time) and 1,421 runs scored (88th). He led the league in triples four times (topping double-digits in five seasons) and stolen bases once (reaching 30 or more in ten seasons). He also led the NL in runs scored once, and scored 100 or more runs in six campaigns. He ranks 46th all-time in putouts at shortstop, 20th in assists and 12th in double plays. He was truly an “everyday” player, appearing in 150 or more games in ten seasons.

20-20-20-20 Vision

Jimmy Rollins is one of just four MLB players with a 20-20-20-20 season (at least 20 doubles, 20 triples, 20 home runs and 20 steals). See his 2007 “best season” below for details. The others are Curtis Granderson (2007), Willie Mays (1957) and Frank Schulte (1911). 

Jimmy Rollins’ Best Season:  In his 2007 MVP season, he hit .296 – with 212 hits, 38 doubles, a league-leading 20 triples, 30 home runs, 94 RBI, a league-leading 139 runs scored and 41 steals.

Rollins’ .264 average and the fact that he made only three All Star squads are negatives for the long haul in balloting.  That 20-20-20-20 season, his four Gold Gloves, 470 steals and 1,400+ runs scored should be enough to keep him on the ballot for some time going forward.

____________________________________

Gary Sheffield … OF/DH/3B/SS, 1988-2009 (Brewers, Padres, Marlins, Dodgers, Braves, Yankees, Tigers, Mets) … Tenth (and final) year on the Ballot, 55.0 percent last year.

Sheffield was a nine-time All Star (in 22 MLB seasons). He launched 509 career home runs (27th all-time) and topped 30 home runs in a season eight times (a high of 43 in 2000). He also maintained a .292 career average (hit .300+ in eight seasons), collected 1,676 RBI (30th all-time) and scored 1,636 runs (39th).  Sheffield won the 1992 NL batting title (.330); topped 100 RBI eight times; and scored 100 or more runs in a season seven times.

Something Old – Something New

Gary Sheffield is one of only four players to hit MLB home runs as teenagers and in their 40’s. The others are Ty Cobb, Rusty Staub and Alex Rodriguez.

Gary Sheffield’s Best Season: In 1996 (Marlins), Sheffield hit .314, with 42 home runs, 120 RBI, 188 runs scored and 16 steals.

Sheffield has the offensive numbers, but defensive questions and the shadow of PEDs are likely to keep him on the outside looking in for now.  He did jump from 40.6 percent of two years ago to 55.0 percent last year – but it would take an even greater increase this time around. Baseball Roundtable expects he will have to wait for the ERA Committees.

__________________________________

James Shields, RHP, 2006-2018 (Rays, Royals, Padres, White Sox) … First Year on the Ballot.

James Shields went 145-139, 4.01 over 13 MLB seasons. He was a one-time All Star and led is league in starts three times, complete games once, shutouts twice, innings pitched once, Shields had nine seasons of ten or more wins (a high of 16 in 2011 for the Rays). He also had three seasons of 200+ strikeouts.

James Shields’ Best Season:  In 2011, Shields went 16-12., 2.82 for the Rays, with an MLB-leading 11 complete games (33 starts) and an AL-topping four shutouts.  That season, he set his career bests in wins, ERA, complete games, shutouts, and strikeouts (225 in 249 1/3 innings).

145 wins (and 139 losses), with career ERA of 4.01 is not going to get you into the Hall, but nine straight season s in the major leagues with at least 11 wins is a solid career to look back on.

_______________________________

Chase Utley, 2B, 2003-18 (Phillies, Dodgers) … First Year on the Ballot.

Chase Utley went .275-259-1,025, with 1,103 runs scored over 16 MLB seasons (1,937 games). He collected 1,885 hits and stole 154 bases.

A Four-midable Middle Infielder

From 2006-2009, Chase Utley won the Silver Slugger Award as the NL’s best-hitting second basemen every year. Over that four-season span, he hits .303 and averaged 162 games, 30 homers, 115 runs scored and `100 RBI per season.

Utley was a six-time All Star and lead the NL in runs once and hit by pitch three times. He scored 100+ runs in four seasons, hit 30+ home runs in here, drove in 100+ runs four times and stole 15 or more bases in three times.

King of the World

Chase Utley shares the single World Series home run record with five (in the 2009 World Series).  Others holding a share of the record are Reggie Jackson (1977) and George Springer (2017). 

Utley started out on a Hall of Fame pace, with a .293 average, 177 home runs and 650 RBI over hit first eight MLB seasons.  Over his final eight seasons those numbers read .253-83-375. Hard to read where the voters will stand on this one.

________________________________

Omar Vizquel – (Shortstop/Third Base, 1989-2012 (Mariners, Indians, Giants, Rangers, White Sox, Blue Jays … Seventh year on the Ballot, 19.5 percent last year.

Omar Vizquel got off to a good start toward a HOF plaque, grabbing 37 percent support on his first-ballot year, moving up to 42.8 percent in his second year and 52.6 in his third shot.  However, the three most recent ballots have dampened his outlook (he received just 19.5 percent in last year’s voting), perhaps related to off-field concerns.  Vizquel who won 11 Gold Gloves, also finished his 24-season MLB career just 123 hits short of that milestone 3,000 safeties.

Vizquel was a three-time All Star – and put together a string of nine straight Gold Gloves at shortstop (1993-2001).

Sacrificing for the Team

Omar Vizquel led his league in sacrifice bunts four times.

In the field, Vizquel has the highest career fielding percentage (.9847) among shortstops with at least 500 games at the position.  Vizquel is also the all-time leader among shortstops in double plays (1,734), ranks third at the position for career assists and 11th in putouts. He shares the record (with Cal Ripken, Jr.) for the fewest errors by a shortstop in a season of at least 150 games played (three).

On offense, Vizquel put up a serviceable .272 career average, with 80 home runs, 951 RBI and 1,445 runs scored. He also swiped 404 bases – topping twenty steals eight times (a high of 42 in 1999).

Omar Vizquel’s Best Season: In 1999, with the Indians, Vizquel hit a surprising .333, with five home runs, 66 RBI, 112 runs scored and 42 stolen bases – and, of course, won a Gold Glove at shortstop.

As noted, Vizquel’s chances for the Hall have been dampened by off-field issues.  (I’ll let readers look those up.)

________________

David Wright – 3B, 2004-16, 2018 (Mets) … First Year on the Ballot.

In 14 MLB seasons, David Wright hit a heathy .296, with 242 home runs, 970 RBI and 949 runs scored. He was a seven-time All Star and two-time Gold Glover. A fixture for the Mets, Wright hit 25+ home runs in five seasons (a high of 33 in 2008) and drove in 100+ runs in five campaigns. He combined speed with that power, stealing a total of 196 bases and swiping  20 or more bags in three seasons (a high of 34 in 2007.

30-30

 In 2007, David Wright hit .325, with 30 home runs and 34 steals.

In the field, Wright led NL third baseman in putouts three times, assists three times and double plays once.

Those seven All Star Selections will earn Wright some votes, but I think voters will expect more power from an HOF third baseman and the fact that he never led his league in any of the main offensive categories will impact voters. Notably, Wright’s number would likely have been even stronger if he had not had to deal with Spinal Stenosis during his career. I do think he’ll be on the 2025 ballot.

______________________________

Here’s another link to the 2024 Baseball Roundtable Fan Ballot ballot. To cast your vote, click here. 

Primary Resources: National Baseball Hall of Fame; Baseball-Reference.com; Baseball-Almanac.com; MLB.com.


Baseball Roundtable – Blogging Baseball Since 2012.

100Baseball Roundtable is on the Feedspot list of the Top 100 Baseball Blogs.  To see the full list, click here.

Baseball Roundtable is also on the Anytime Baseball Supply Top 66 Baseball Sites list.  For the full list, click here

I tweet (on X) baseball @DavidBaseballRT

Follow/Like Baseball Roundtable’s Facebook Page here.  Find More baseball commentary; blog post notifications; PRIZES.

Member: Society for American Baseball Research (SABR); Negro Leagues Baseball Museum; The Baseball Reliquary.

P1012


Lucky Number Seven … It’s a Hit

In a recent post, Baseball Roundtable focused on the number four – and its significance in the career of Hall of Famer Henry Aaron.  Click here for that post. In this post, we’ll look at the significance of number seven – particularly as it related to hits by a single batter in a single MLB game.

Why the number seven?  It seems to be an appropriate and notable cut off point. Only six times in MLB history has a batter logged seven (or more) hits in a game. By contrast, there have been 170 six-hit games. (Note: These numbers may change as Negro League stats from 1920-48 are further documented and incorporated into the MLB record books).  So, let’s look at some of baseball’s lucky sevens – as well as a pretty significant nine and a remarkable six.

__________________________________________

Most Hits in a Nine-Inning game  – Seven

Wilbert Robinson, Baltimore Orioles, June 10, 1892

Photo: https://sabr.org/bioproj/person/wilbert-robinson/, Public domain, via Wikimedia Commons

Baltimore Orioles’ catcher Wilbert Robinson seems an unlikely candidate for the seven-hit club. Robinson was a .273 hitter over 17 MLB seasons (1886-1902).  Coming in to the 1892 season, his career average was .226 and in 1892, he hit .267 for the campaign.

On the day of his seven-hit performance, Robinson was catching and batting eighth in the Orioles’ lineup. The Orioles apparently had on their hitting shoes that day, as they led the St, Lous Browns 25-2 by the end of the sixth inning – eventually winning 25-7.

Robinson’s day:

First Inning – Single.

Second Inning – Single.

Third Inning – Single.

Fourth Inning – Double.

Fifth Inning – Single.

Seventh Inning – Single.

Ninth Inning – Single.

While Robinson scored just one run in the contest, he drove in a (then-record) 11 runs in his seven-hit game.  In his 89 other 1892 appearances, he drove in 35 runs.

Robinson was inducted into to the Baseball Hall of Fame – as a manager – in 1945. In 19 managerial seasons, his teams went 1,399-1,398, He won a pair of pennants (1916 and 1920) with the Brooklyn Robins. As a player, Robinson hit .273-18-722, with 637 runs scored and 196 stolen bases over 17 seasons (1,371 games).

In the first six years of his MLB career (1886-91, with the Philadelphia Athletics and Baltimore Orioles of the American Association), Robinson hit .226-9-205, with 107 steals (in 479 games).  From 1892 through 1902 (Baltimore and St. Louis in the NL and Baltimore in the AL), he hit an even.300, with nine homers and 517 RBI in 892 games. He topped .300 in five of those 11 campaigns.

We Won’t See That Again

On Monday (Labor Day) September 7, 1896, the National League saw the Baltimore Orioles sweep triple header from the Louisville Colonels. The very next day, the Orioles swept a doubleheader from those same Colonels. Wilbert Robinson caught all five games for Baltimore.

____________________________________

Rennie Stennett, Pittsburgh Pirates – September 16, 1975

Photo: Hostess via tradingcarddb.com, Public domain, via Wikimedia Commons

Wilbert Robinson seven-hit record would stand alone for more than 80 years.  Then on September 16, 1975 – as the Pirates topped the Cubs 22-0 in Chicago – Pittsburgh leadoff hitter and 2B Rennie Stennett would go seven-for-seven. That day, Stennett collected two hits in both the first and fifth innings.

Stennett’s day went:

First Inning – Lead-off double off Rich Reuschel and an RBI single off Tom Dettore. Stennett scored on a single by 3B Richie Hebner and later in the inning on a single by 1B Willie Stargell.

Third Inning – One out Single off Dettore. Stennett scored on a Hebner home run.

Fifth Inning – Leadoff double off Dettore and an RBI-single off Oscar Zamora. Stennett scored a run on a single by CF Al Oliver.

Seventh Inning – Leadoff single off Buddy Schultz, later scoring on a single by RF Dave Parker.

Eighth Inning – Two-out triple off Paul Reuschel.

In the game, Stennett scored five times and drove in two.

Brotherly Love

In Rennie Stennett’s seven-for-seven, nine-inning game, he collected base hits off brothers Rick and Paul Reuschel.

Stennett came into the game hitting .279 on the season (138 games).  He raised is average to .287 that day – and would finish the season sat .286-7-62, with 89 runs scored.

Stennett played in 11 MLB seasons (1971-81 … Pirates, Giants), hitting .274-41-432 in 1,237 games. He was signed as an amateur free-agent (out of Panama) in 1969 and called up to the Pirates in 1971, after hitting .344 at Triple- A. He made his MLB debut July 10 and hit .353-over 50 games for the Pirates that season.

__________________________________


History Made

On September 1, 1971, Rennie Stennett led off for the Pirates – atop the first-ever MLB all black and Latino lineup:

Rennie Stennett 2B

Gene Clines CF

Roberto Clemente RF

Willie Stargell LF

Manny Sanguillen C

Dave Cash 3B

Al Oliver 1B

Jackie Hernández SS

Dock Ellis P

The Pirates topped the Phillies 10-7 in Pittsburgh. 

____________________________________________


Most Hits In An Extra-Inning Game

Johnny Burnett, Indians – July 10 1932- Nine Hits (18 innings)

Photo: Goudey, Public domain, via Wikimedia Commons

Indians’ SS Johnny Burnett came into Cleveland’s July 10, 1932 contest versus the Athletics hitting .298 on the season.  A solid contact hitter, Burnett had hit .300 in 111 games the previous season, fanning just 25 times in 470 plate appearances. In that July 10, 1932 game, Burnett would come to the plate 11 times and collect nine hits. Despite this record-setting performance, the Indians lost the see-saw game 18-17 in 18 innings. Over the contest, Burnett’s Indians would trail 2-0; lead 3-2; trail 5-3; lead 6-5; trail 13-8; lead 14-13; and trail 15-14, before tying the game at 15 in the bottom of the ninth.  Both teams would score two runs in the sixteenth inning, and the Athletics would finally prevail 18-17 in 18 frames.

Burnett, batting second and playing shortstop, had this day:

First Inning – Single off Lew Krausse – later scoring on a home run by CF  Earl Averill.

Second Inning – One-out single off Ed Rommel.

Fourth Inning – Single off Rommel, later scoring on a sacrifice fly off the bat of 1B Ed Morgan.

Fifth Inning – RBI double off Rommel.

Seventh Inning – Leadoff single off Rommel, later scoring on a LF Joe Vosmik double.

Seventh Inning – Strikeout (versus Rommel) to end the inning.

Ninth Inning – Game tying (15-15), two-out RBI single off Rommel.

Eleventh Inning – Double off Rommel.

Thirteenth Inning – Single off Rommel.

Sixteenth Inning – Single off Rommel, later scoring on an Ed Morgan single (tying the game at 17-17).

Seventeenth Inning – Flyout to CF off Rommel.

Burnett played nine MLB seasons (1927-35 … Indians Browns), hitting .284-9-213, with 288 runs scored (in 558 games). He played at least 100 games in only two of his nine MLB seasons.  In his two 100+ game campaigns (1931-32, he hit .298-5-105 and scored 166 runs (240 games).

____________________________________

Ed Rommel’s Final MLB Win – One For The Record Books

Photo: Bain News Service, publisher, public domain, Wikimedia Commons

In his 171st and final MLB victory, Athletics’ righty Eddie Rommel gave up the most hits ever surrendered by a pitcher in an MLB game – and it happened In Johnny Burnett’s record-setting nine-hit game.  The Athletics’ knuckleball specialist gave up a single-pitcher, single-game record 29 hits (as well as nine walks) in 17 innings of relief.

Rommel’s 17-inning relief outing was the product of scheduling quirks. Rommel’s Philadelphia Athletics found themselves slated to play nine games in five days – double headers on July 7, 8 and 9 in Chicago, a makeup single game on July 10 in Cleveland and a double header (versus Cleveland) in Philadelphia on July 11. Reportedly to save a beleaguered pitching staff (as well as travel expenses for the one-game stand in Cleveland), Athletics’ owner Connie Mack opted to send just two pitchers to Cleveland, starter Lew Krausse and Rommel. Unfortunately for Rommel, Krause got knocked around early, setting up Rommel’s 17-inning, 29-stint.   In a bit of irony, the victory was Rommel’s final MLB win.

Rommel’s pitched in five more games in 1932 (his final MLB season) picking up two losses to go 1-2, 5.51 (in 17 relief appearances) on the year.  Over a 13-season MLB career (1920-32, all with the Athletics,) Rommel went 171-119, 3.54, twice leading the AL in wins (and twice leading the league in losses).   In 1922, Rommel went 27-13, 3.28 for an Athletics team that went 65-89-1 and finished seventh in the eight-team American League. After retiring as a player Rommel spent time as an Athletics coach and minor-league manage, before beginning a long career as an umpire (21 seasons in the major leagues).

__________________________________


Rocky Colavito, Tigers … June 24, 1962 – Seven hits (22 innings)

When the Tigers faced the Yankees (in Detroit) on June 24, 1962, Detroit LF Rocky Colavito – an established power hitter – was hitting .268-14-43 on the season (65 games).  On that day, Colavito raised his average 17 points – getting seven hits and a walk in eleven trips to the plate. Surprisingly, all those hits produced just one run scored and one RBI, as the Yankees prevailed 9-7 in 22 innings.

In the game, the Yankees scored first – plating six runs in the top of the first inning off noted Yankee Killer Frank Lary. (For his career Lary would go 28-13, 3.32 versus the Bronx Bombers, with 24 complete games in 49 starts.)

Here’s a look at Colavito’s Day:

First Inning – Yankee starter Bob Turley walked Tigers’ 3B Steve Boros and CF Billy Bruton and then gave up a three-run homer to RF Purnal Goldy to put the Tigers back in the game. Colavito, batting cleanup and playing LF, popped out to SS for the first out of the inning.

Third Inning – Colavito drew a one-out walk from Jim Coates, later scoring on a single by SS Chico Fernandez to bring the scores to 7-4.

Fourth Inning – A one-out, one-on single to CF off Bill Stafford.

Sixth Inning – An RBI single to CF off Stafford, bringing the score to 7-6 Yankees.

Seventh Inning – A leadoff ground out to SS off Tex Clevenger.  (The game was tied at seven at the time.)

Eleventh Inning – It looked like Colavito might have gotten the hit to end the contest, as he tripled to CF off Clevenger to open the frame. 1B Norm Cash and 2B Dick McAuliffe were intentionally walked to load the bases with no outs. Colavito did not attempt to score on a liner to short left by Fernandez and then C Dick Brown popped up on a bunt attempt, which was turned into a catcher-to-third base double play

Thirteenth Inning – One-out groundball single off Clevenger.

Fifteenth Inning – With a runner on first and one out, Colavito hit a ground ball single (left side) off Bud Daley. No run scored.

Eighteenth Inning – Fly out to center to open the frames, off Jim Bouton.

Twentieth Inning – Two-out, bases empty groundball single off Bouton.

Twenty-second Inning – Two-out single to center off Bouton.

Colavito played 14 MLB seasons (1955-68 … Indians, Tigers, Athletics, White Sox, Dodger Yankees), going .266-374-1,159 in 1,841 games.  He was an All Star in six seasons, led the AL in home runs once (and had three seasons of 40+ homers), led the league in RBI once (with six seasons of 100+ RBI, including 140 in 1961) and twice led the league in total bases. His best season was 1961, when he hit .290-45-140, with 129 runs scored in 163 games.

An Energizing Day

Rocky Colavito’s seven-for-ten day (June 24, 1962) started an 18-game stretch in which he hit .417-6-16. (Colavito hit .273-37-112 on the season).

______________________________________

 Cesar Gutierrez, Tigers … June 21, 1970 – Seven Hits (12 innings)

Cesar Gutierrez may have had the most unexpected seven-hit game. Gutierrez played in just four MLB seasons (1967,1969-71 … Giants Tigers), hitting .235-0-26 in 223 games.  His 1970 season was the only one in which he played more than 38 games at the major-league level. In his MLB career Gutierrez had more than one hit in only 24 games.

On June 21, 1970, however, Gutierrez was pretty much unstoppable, collecting seven hits in seven trips to the plate, scoring three runs and driving in one – as Detroit edged the Indians 9-8 in 12 innings in Cleveland.

Gutierrez, who started at SS batting second, came into the game hitting .218 on the season (in 51 games played).   When it was over, he was hitting .249.

Here’s how his day went:

First Inning – Single to RF off Rick Austin, later scoring on a groundout by RF Jim Northrup.

Second Inning – One-out single off Austin, scoring on home run by 1B Al Kaline.

Fifth Inning – Leadoff single off Dennis Higgins.

Seventh Inning – Leadoff double off Higgins, later scoring on a Northrup home run.

Eighth Inning – RBI single (tying the game at 8-8) off Fred Lasher.

Tenth Inning – Two-out single off Dick Ellsworth.

Twelfth Inning – Single off Pat Hennigan.

In 1970, Gutierrez hit .243-0-22, with 40 runs scored in 135 games.

__________________________________

 Brandon Crawford, Giants – August 8-2016 – Seven Hits (14 Innings)

Photo: Jeff Marquis from San Carlos, CA, USA, CC BY 2.0 <https://creativecommons.org/licenses/by/2.0>, via Wikimedia Commons

Brandon Crawford came into the Giants August 18, 2016 game versus the Marlins (in Miami) hitting .265-10-68 in 108 games. On that day, as the Giants edged the Marlines 8-7 in 14 frames, the San Francisco SS went seven-for-eight (raising his average 13 points).

Second Inning – Lead off groundball single to 2B off Jose Fernandez;

Fourth Inning – Lead off groundball double to RF off Fernandez;

Fifth Inning – Inning-ending strikeout (Fernandez), with a runner on second and the Giants trailing 2-1.

Seventh Inning – One out, one-on groundball single to RF off Nick Wittgren.  

Side Note: Crawford’s single was the fifth of six straight hits to open the inning, as the Giants scored five times to take a 6-5 lead.

Eighth Inning – Two- out, RBI single to RF off Kyle Barraclough to tie the game at seven.

Eleventh Inning – None-out, one-on single to CF off Mike Dunn, putting runners on first and third. A strikeout, intentional walk and two groundouts kept the Giants from scoring.

Thirteenth Inning – One-out triple to RF off Dustin McGowan.  (Followed by an infield groundout, with Crawford having to hold, two intentional walks and a strikeout.)

Fourteenth Inning – A two-out, two-on RBI singe to CF off Andrew Cashner that proved to be the game winner.

2023 was Crawford’s 13th MLB season (2011-23 … Giants). His career stat line (1,654 games) reads .250-146-744. Crawford is three-time All Star and four-time Gold Glover. His best year at the plate was 2021, when he hit .298-24-90 – reaching career highs in all three categories, as well as in runs scored (79), stolen bases (11) and total bases (252).

_________________________________________

Honorable Mention- The Best Ever Six-Hit Game

Yes, the cutoff line was seven-hit games – but out of those 170 six-hit games one really stands out. On May 23, 2002 – as the Dodgers trounced the Brewers 16-3 In Milwaukee, Dodgers’ RF Shawn Green had a day to remember. He went six-for-six, with four home runs, a double and a single – six runs scored and seven RBI. Green hit an RBI double in the first inning; a three-run homer in the second; a solo home run in the fourth; a solo homer in the fifth; a single in the eighth; and a solo home run in the ninth.  In the Game, Green: 

  • Set a new MLB record for total bases in a game with 19;
  • Tied the MLB record for home runs in a game with four; and
  • Tied the MLB record for extra-base hits in a game with five.

Green by then way, is on The Roundtable’s list of underrated (or at least under talked about) major leaguers.  Just a two-time All Star, he put up a .283-328-1,070 line in 14 seasons. He had three seasons of 40+ home runs (a Dodger franchise record 49 in 2001); four seasons of 100 or more RBI; four seasons of 100+ runs scored; and 11 seasons of 30 or more doubles (three of 40+). While he only hit .300+ in one season, he hit .280 or better in nine  campaigns. He also stole 20 or more bases in four seasons- a high of 35 in 1998.

_______________________________________

Primary Resources:  Baseball-Reference.com; Baseball-Almanac.com; MLB.com


Baseball Roundtable – Blogging Baseball Since 2012.

100Baseball Roundtable is on the Feedspot list of the Top 100 Baseball Blogs.  To see the full list, click here.

Baseball Roundtable is also on the Anytime Baseball Supply Top 66 Baseball Sites list.  For the full list, click here

I tweet (on X) baseball @DavidBaseballRT

Follow/Like Baseball Roundtable’s Facebook Page here.  Find More baseball commentary; blog post notifications; PRIZES.

Member: Society for American Baseball Research (SABR); Negro Leagues Baseball Museum; The Baseball Reliquary.

P1011