BBRT would like to make a prediction for 2016 that may not be as much of a “given” as it might seem. I’d like to predict that a Pirate, Marlin or Oriole pitcher will throw a complete game sometime during the 2016 season. Why might that prediction put me out on a limb?
In 2015, the Pirates, Orioles and Marlins failed to record a single complete game among them. Notably, the lack of complete games did not seem to serve as an indicator of team performance.
- One of the three teams finished twenty or more games over .500 (Pirates, 98-64); one finished right at .500 (Orioles, 81-81); and one finished 20 or more games below .500 (Marlins., 71-91).
- They also finished sixth, fourteenth and twenty-second in quality starts (Pittsburgh-92; Miami-83; Baltimore-72. (MLB average-81).
- Despite the lack of a single complete game, the three teams recorded 35 shutouts on the season.
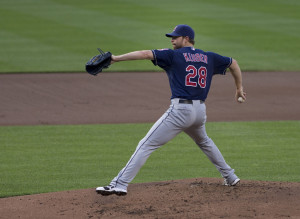
Corey Kluber tied for the MLB lead with four complete games – helping the Indians achieve a 2015 MLB-best 11 CG.
Photo by Keith Allison.
One the other side of the coin, the Cleveland Indians led all of MLB with 11 complete games in 2015 – as many as the Royals, Twins, Phillies, Brewers, Rays, Mets, Cardinals, Padres, Diamondbacks, Orioles, Pirates and Marlins COMBINED. Note: Four of those teams made it to the post season; the Cardinals finished with MLB’s lowest earned run average (despite only one complete game); and Pittsburgh, with no complete games, had MLB’s second-lowest ERA. The Indians finished seventh in quality starts (91) and notched 11 team shutouts.
These numbers from 2015 reflect the continuing disappearance of the complete game in major league baseball. Here are more “telling” statistics:
– In 1900, 82.3% of games started were complete games;
– 1925 – 49.2%
– 1950 – 40.3%
– 1975 – 27.2%
– 2000 – 4.8%
– 2010 – 3.4%
– 2015 – 2.2%
For BBRT’s comments (a rant actually) on five reasons why the complete games have become a thing of the past, click here.
Looking ahead? For BBRT’S 2016 National League Predictions (Division Races and Awards), click here. For 2016 AL Predictions, click here.
Fan of baseball trivia? BBRT has two 99 question (Ballpark Tours tested) trivia quizzes. For BBRT’s 99 favorite questions, click here. For a second 99, click here.
Ballpark Tours great 2016 excursion (10 days, 10 games, 7 cities), outlined here.
I tweet baseball @DavidBBRT
Member: Society for American Baseball Research (SABR); The Baseball Reliquary; Baseball Bloggers Alliance.