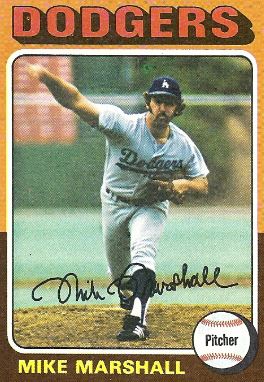
Mike Marshall pitched a record 208 1/3 innings in relief in 1974.
Spoiler alert … or Warning! This is going to be an “I remember when …” post. A look back at a time when the national pastime operated a bit differently. Specifically, when baseball’s top relievers earned The Sporting News “Fireman of the Year Award” … appropriately named because the bullpen leaders of the day often came in (early or late) to put out a fire and then stayed on the scene (and in the game) to make sure the fire stayed out. Multi-inning stints, inherited runners, 100+ inning seasons and 10+ W-L decisions were the rule, rather than the exception for MLB’s top firemen. (Actually, I’ll be going back a bit further than those Fireman of the Year Days, but they will be at the center of this commentary.)
I do miss those workhorse firemen of the past – who came to work early and stayed late.
BBRT April 26, 2017
This post is prompted by my memories of the days when the “end game” belonged to firemen like Lindy McDaniel, Roy Face (we called him Elroy), Wayne Granger, Dick “The Monster” Radatz, Hoyt Wilhelm, Rich “Goose” Gossage, Dan Quisenberry, Bill “Soup” Campbell, Rollie Fingers, Al “Red” Worthington, Ron Perranoski, Bruce Sutter and, of course, the durable Doctor Mike Marshall. (There are many more, but this is a pretty good list to start from.)
Note: The Sporting News Fireman of the Year Award was established in 1960 and became the Reliever of the Year Award in 2001. Today, we have the Mariano Rivera and Trevor Hoffman Awards, which tend to recognize today’s ninth-inning closers.
Today, of course, the closer is a new kind of pitcher – generally coming in for just the ninth inning, with a clean slate on the bases and tending to accumulate significantly more saves and fewer W-L decisions. The closer is preceded, most likely, by the seventh-inning specialist, the eighth-inning set-up man and, perhaps, a lefty or righty whose purpose is to retire one or two key hitters (not to mention the possibility of a middle-man or long reliever). Putting this post on paper does not mean I endorse one system over the other. I recognize baseball has to change and I am willing to accept the new order of things like one-inning closers, the near demise of the complete game and the growing number of infield shifts. (I make an exception to this acceptance for the DH and the new rule – taken right from slow-pitch softball – which sees batters simply waved to first on an intentional walk.) What this post does signify is that I do truly miss those workhorse relievers who used to came to work early and stay late.
In this post – to make a short story long – BBRT will look at where relief pitching is today – and nostalgically where it has come from. As is baseball tradition, I’ll try to tell the tale in both stories and statistics. To begin, here are a few statistics that will help tell the story (and which I will deal with in more detail later):
- In 1930, MLB pitchers racked up more games started than relief appearances, while in 2016 relief appearances outnumbered starts by more than three-to-one.
- In 1930, the Athletics’ Lefty Grove tied for the MLB league lead in games won as a starter (23), led MLB in total games won at 28 (thanks to five wins in relief) and topped MLB in saves with nine.
- In 1959, the Pirates’ Roy Face racked up an MLB record 18 relief wins (against one loss) to go with ten saves.
- In 1969, the Reds’ Wayne Granger notched 27 saves and, in 90 appearances (then a record), came in 62 times (68.9 percent of his appearances) with runners on base. He inherited an unofficial record 112 runners that season. In contrast, in 2002, the Twins’ Eddie Guardado led the AL with 45 saves, but (in 68 appearances) only once came in with runners (two) on base.
- 1974, NL saves leader Mike Marshall (21 saves), took the mound as a reliever in a record 106 games, and tossed a record 208 1/3 innings in relief. In 2016, only nine MLB starters pitched more than 208 innings and no reliever reached even 90 innings. (Brad Hand led all relievers with 89 1/3 innings in 82 appearances.)
- In 2016, MLB saves leader Jeurys Familia of the Mets (51 saves) pitched more than one inning in just five of 78 appearances (6.4%). In 1980, MLB saves co-leader Goose Gossage (33 saves) pitched more than one inning in 37 of 64 appearances (57.8%).
Those are jusst some of the numbers, but what does this story look like in practice?
 It was Monday, September 8, 1969 and the Reds were facing the Giants (in Cincinnati) in the first game of a doubleheader. (Remember those? A baseball fan’s dream.) Jim Maloney had started against the Giants’ Juan Marichal and took a 5-3 lead into the top of the ninth. (Both starting pitchers were still in the game. Remember complete games?) Giants’ catcher Dick Dietz led off the ninth and was safe on an error by Reds’ CF Bobby Tolan. Willie Mays pinch hit and drew a walk and then Leon Wagner (also pinch hitting) singled off Maloney to plate pinch runner Don Mason and send Mays to third. That’s when Reds’ manager Dave Bristol made the call to the bullpen and brought Wayne Granger to the mound. (We didn’t call them “closers” back then – “finishers” would have been a better word.) A quick fly ball and a double play grounder later, Maloney had his 20th save of the season (in his 73rd appearance).
A nice day’s work. But wait, Maloney was not done for the day. Game Two of the twin bill was tied 4-4 after seven innings and – in the top of the eighth – Bristol again called Granger to the mound. This time, the 6’2”, 165-pound, 25-year-old Granger (who would win the NL Fireman of the Year Award) came in to start the eighth inning – and he was still in there in the 15th, when the Reds won 5-4 and Granger picked up his eighth victory of the season. Granger gave up no runs, three hits and one walk, while fanning five in his eight-inning stint. Given that he had gone two innings in relief the day before, Granger had appeared in three games and pitched eleven scoreless innings of relief in two days. He did get September 9 off, but then ran off a string of seven appearances in seven days (September 10-16).
Looking back at Granger’s 1960 season, here are a few numbers to remember: He pitched 144 2/3 innings in relief; 57.8 percent of his relief appearances were for more than one inning (52 of 90); he came into the game with runners on base in 68.9 percent of his appearances (62 of 90); and he inherited an unofficial record 112 runners – more than one per appearance.
Looking at today’s (April 26) MLB leaderboard, there on top of the saves category is the Rockies’ Greg Holland with nine saves in ten appearances – with exactly ten innings pitched, no outings of more than one inning and no inherited runners.

Photo by Keith Allison 
Holland’s 2017 numbers too small a sample? Let’s look at one of 2016’s top relievers: the winner of the Mariano Rivera Award – Zach Britton. Britton appeared in 69 games for the Orioles – going 2-1, with 47 saves and a 0.54 ERA. Of those 60 appearances, only seven were of more than one inning and a single two-inning stint was his longest. He threw a total of 67 innings, meaning he averaged just under one inning per outing (0.97). Of Britton’s saves, 41 were of exactly one inning – two were less than one frame. In 69 games, he came in with runners on 12 times. Holland’s start to 2017 and Britton’s 2016 season accurately reflect the changing order of the guard in the bullpen – with closers replacing firemen and generally coming into the game after a cadre of relief specialists, starting with clean slate on the basepaths and throwing just one inning (the ninth). Thanks to Baseball-Reference.com, MLB.com and my trusty ESPN Baseball Encyclopedia, there are plenty of statistics available to shed some light on how we got here. Let’s take a look,
I won’t spend much time on the earliest days of the national pastime, when bullpens really had little role to play. Starters were expected to put in a full game’s work. Consider the first five years of the National League (1876-1880) – 92.1 percent of starts resulted in complete games. In 2016? Last season, there were 83 complete games (in 4,856 starts) for a complete-game percentage of just 1.7 percent. In fact, 36.7 percent off all innings pitched in MLB season were handled by hurlers coming out of the bullpen. (For BBRT’s take on the vanishing complete game, click here.)
The decline on complete games has amplified the importance of the relief staff (particularly closers) – and prompted the ascendance of the “save.” In 1900, just 2.2 percent of MLB wins also involved a “save.” In 1950, the save-to-win ratio was 23.3 percent; and last season, it was 52.5 percent. The chart below maps the decline of the complete game – and the ascendance of the save. The actual percentages are detailed at the end of this post.

And, as already noted, as relief staffs have taken on more work, they have also seen a division of labor – middle men, set-up men, lefty/righty specialists, closers – more relievers, making more appearances of fewer innings each.

As you can see from the trend lines in the charts, today’s specialized bullpens did not take form overnight. The bullpen evolution included times when:
- Starters were expected to finish each game (witness the 82.1 percent completion rate of 1900) and relievers were primarily lessor or declining pitchers who “mopped up” lost causes.
- Managers who went to the bullpen when a game was on the line looked primarily to starting pitchers who felt they could “go” that day. (In 1930, Lefty Grove led the AL with nine saves – starting 32 games and coming on in relief in 18 – also leading the league in win with 28, ERA at 2.54 and strikeouts with 209.)
- Key relievers were true workhorses out of the pen, and multi-inning saves and 100+ inning seasons among relievers were commonplace (In 1980, for example, the saves leaders were Bruce Sutter of the Cubs in the NL and Rich Gossage of the Yankees and Dan Quisenberry of the Royals in the AL. The trio appeared in a combined 199 games, threw 329 2/3 innings and 60 of their 94 combined saves – 63.8 percent – were more than one inning.) At this same time, reliever usage resulted in more won-loss decisions (versus saves) than we normally see today. (It wasn’t unusual for relievers – even closers – to run up a dozen or more decisions.)
- Then, relievers became more and more specialized, to the point that new statistics were developed to reflect their changing roles (saves in the 1960s – holds in the 1980s). Note: Saves were later award retroactively to relievers who proceded the new stat.
STARTING THE FINAL FRAME WITH A CLEAN SLATE
In 1972, the Reds’ Clay Carroll (who led the NL with 37 saves) became the first reliever to starts at least 1/3 of his appearances to open the ninth inning. In 1987, the Reds’ John Franco became the first reliever to start at least 1/2 of his appearances to open the ninth. In 1994, the Orioles’ Lee Smith (who led the AL with 33 saves) became the first reliever to start at least ¾ of his appearances opening the ninth.


With that background, let’s now take a look at some true workhorse firemen – and the kind of seasons we are not likely to see from bullpen occupants ever again. (The kind of seasons I kind of miss.)
MIKE MARSHALL – UNIQUE TO THE “Nth” DEGREE
We never saw a closer like Mike Marshall before he came along – and we’re not likely to see one like him again. In 1974, as a Dodger, he put up the grand-daddy of all relief seasons – setting the record for appearances with 106 and innings pitched in a season in relief at 208 1/3. He finished the season 15-12, with a league-topping 21 saves and a 2.42 ERA. Marshall was called on to go more than one inning in 74 games (68.5 percent of the time); and toiled three or more innings 22 times. A few other facts about Marshall’s remarkable season:
- His longest stint came on August 19, when he came on in the seventh inning of a 7-7 game against the Cubs – and went six innings, earning the win as the Dodgers topped the Cubs 8-7 in twelve innings.
- From June 18 to July 3, Marshall relieved in 13 consecutive regular season games –an MLB record later tied (1986) by the Rangers’ Dale M0horcic.
- From May 17-24, Marshall pitched eight straight days (no off days in that period).
- On July 7, Marshall picked up a pair of saves, as the Dodgers swept a doubleheader from the Expos. Marshall pitched 1 2/3 innings in Game One and came back to go three innings in Game Two.
Marshall holds the MLB and NL record for games pitched in relief in a season (106 – Dodgers, 1974), as well as the AL record (89 in relief – Twins, 1979 – he also had one start that year). The Blue Jays’ Mark Eichhorn tied Marshall’s AL record in 1987.
WILLIE HERNANDEZ – CY YOUNG AWARD AND MVP
In 1984, Tigers’ closer Guillermo “Willie” Hernandez won both the Cy Young Award and AL Most Valuable Player Award (for Twins’ fans, he edged out hometown hero Kent Hrbek in the MVP voting). Hernandez appeared in 80 games – going 9-3, 1.92 with 33 saves. He was asked to go more than one inning 45 times (56 percent of his appearances) – and 15 times he pitched at least three frames (twice for four innings.) Hernandez went 140 1/3 innings that season – averaging 1.75 innings per stint.
HOYT WILHELM OFF TO A GOOD “START” IN RELIEF
In 1952, in his rookie season, Hoyt Wilhelm appeared in 71 games in relief for the New York Giants – going 15-3 with 11 saves. His .833 winning percentage led the league. Of more significance, his 159 1/3 innings pitched (all in relief) qualified him for the Earned Run Average title, which he captured with a 2.43 ERA. Wilhelm won the ERA title again in 1950, when he went 15-11, 2.19 for the Orioles primarily as a starter (32 games, 27 starts).
A MONSTER SEASON FOR DICK RADATZ
In 1964, The Red Sox’ Dick Radatz not only led the AL in saves, with 29, he also picked up 16 wins (versus nine losses) in relief and set the MLB record for strikeouts in a season in relief at 181 (in 157 innings). Radatz’ ERA for the season was 2.29. In his first four MLB seasons (1962-65), the 6’6”, 230-pound right-hander – pitching only in relief – averaged 109.5 innings a season.
ELROY FACE PUTS UP 18 RELIEF WINS
In 1959, the Pirates’ Elroy Face, pitching solely in relief, set the MLB single-season winning percentage record – going 18-1, 2.70 with ten saves (93 1/3 innings pitched). Face had led the NL in saves in 1958, and would lead in the category in 1961 and 1962, as well.
FOR TWINS’ FANS – WITNESSING THE NEW AGE
In 1976, Twins’ fans had the pleasure of watching Bill “Soup” Campbell come in from the bullpen 78 times – on his way to tying John Hiller’s (1974) AL record of 17 relief wins in a season. And, no Campbell wasn’t a long man, middle reliever or even a set-up man. He was all of those and the closer – going 17-5, 3.01 with 20 saves. On the season, Campbell:
- Had 22 (W-L) decisions and 20 saves;
- Pitched 167 2/3 innings – 2.1 per appearance;
- Made 56 appearances (72 percent) of more than one inning and 23 appearances (29 percent) of three or more innings;
- Came into 45 games (57 percent) with runners on base – inheriting a total of 79 baserunners.
In 2002, Twins fans cheered as “Everyday Eddie” Guardado led the AL with 45 saves (2.93 ERA). In his 68 appearances, Guardado:
- Had four (W-L) decisions to go with his 45 saves;
- Pitched 67 2/3 innings – just shy of one inning per appearance;
- Made just two appearances of more than one inning – none more than two innings;
- Came into just one game with runners on base, inheriting a total of two baserunners.
DATA FROM COMMPLETE GAME/SAVES CHART
Year % of CG % of Wins with Save
1900 82.1 2.2
1910 62.1 10.2
1920 56.6 12.0
1930 44.4 18.6
1940 44.3 18.9
1950 40.3 23.3
1960 26.9 34.9
1970 21.9 43.8
1980 20.3 42.9
1990 10.1 55.7
2000 4.8 48.5
2010 3.4 49.5
2016 1.7 52.6
Follow and Like the Baseball Roundtable Facebook page. More baseball commentary there – and, in mid-May, the start of some bobblehead give-aways. (Beginning with Mariano Rivera and Derek Jeter bobbleheads.)
I tweet baseball @DavidBBRT
Follow the Baseball Roundtable Facebook page.
Member: Society for American Baseball Research (SABR); The Baseball Reliquary; The Negro Leagues Baseball Museum; Baseball Bloggers Alliance.