 When it comes to communications, Sarah Johnson is a researcher, analyst and strategist, with the ability to tell a story in creative and compelling prose. With a Master’s Degree in Business Communications from the University of St. Thomas (Minnesota), attention to detail and a Renaissance-style curiosity, Johnson’s writing has covered topics ranging from Minnesota’s role in the Battle of Gettysburg to the renowned Gothic Cathedral of Cologne (Germany) to Lima, Peru’s growing status as a “foodie” destination to the career of MLB pitcher Charles “Chief” Bender. Her work has appeared in such varied publications as the Minneapolis Star Tribune; Food Wine Travel Magazine; Minnesota History Magazine; and the SABR Baseball Research Journal. In addition to a successful freelance career, she has worked for such varied organizations as the Hennepin Theatre Trust, Midwest Food Connection and YouthLink MN.
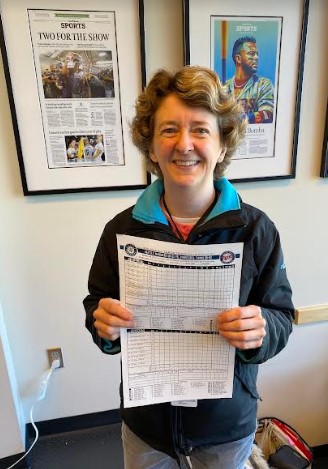
Johnson, however, is the subject of this Baseball Roundtable post for a different kind of story telling – one told in numbers (like 6-4-3) and acronyms (like HBP and RBI). Working at Target Field (home of the Minnesota Twins), Johnson is one of just five female official scorers (out of approximately 100 official scorers) in Major League Baseball.
Baseball Roundtable was pleased to have the opportunity to talk with Johnson about baseball and her work as an official scorer.
Johnson indicated she became interested in sports at an early age – from the sidelines, rather than on the field.
“I did not play sports growing up, but I have always loved watching baseball and spent considerable time watching my sisters play basketball and volleyball,” she explained. “My dad calls me the world’s greatest spectator!”
Baseball Roundtable Note: The choice of the phrase the “world ‘s greatest spectator” – as opposed to – “world’s greatest fan,” may have foreshadowed Johnson’s later work as a scorer and statistician. Clearly, in sports, unbiased interpretation of the play on the field (rather than fan-influenced observations) is a positive asset.
Sarah Johnson’s father may have been the first to see her potential as a scorer. As he tells the story, he took Sarah to her first professional game (Twins at the HHH Metrodome ) at a very young age. Johnson saw a woman ( Roundtable emphasis) keeping a scorecard and was very curious about what she was doing. At their very next game, Johnson’s father bought Sarah a scorecard and she taught herself how to score a baseball game. (More foreshadowing?)
Johnson’s advancement to the major-league scorer’s table was a logical one. It included serving as an official scorer for a high school tournament, the first round of the 2018 NCAA Baseball Tournament (at the University of Minnesota’s Siebert Field) and the independent minor-league Saint Paul Saints, as well as spending time shadowing veteran official scorers for the Twins and Saints.
Those shadowing sessions, particularly with long-time official scorer Stew Thornley (who Johnson met through the Halsey Hall Chapter of the Society for American Baseball Research), were a notable influence in Johnson’s eventual selection as an MLB scorer.
“I met Stew through SABR and knew he was one of the official scorers at Target Field, so I started asking him questions about unique game situations,” Johnson said. “They must have been the right questions, because he turned to me one day and said, ‘You should be an official scorer.’ Stew allowed me to shadow him during a game at Target Field and then I contacted the Saints and asked if I could shadow their official scorer.”
Baseball Roundtable Note: Both Thornley and Johnson are board members of the Halsey Hall SABR Chapter.
Johnson said those shadowing sessions were extremely helpful in building her understanding of what it takes to be an official scorer and what she needed to “work on and study” if she wanted to earn a spot in the scorer’s booth.
Johnson said a key part of preparation for a role as an official scorer (in addition to her practical experience with the Gopher and Saints) was an MLB program called the “Official Scoring University.” That program offers the opportunity to discuss rules and game situations in detail with veteran MLB scorers and MLB personnel. Johnson added that scorers also review judgement plays during the season, as well as take rules quizzes (and discuss their answers and reasoning in detail). The learning curve, she added, is ongoing.
“As the old cliché goes, anytime you go to a baseball game you may see something you’ve never seen before,“ Johnson said. “That’s the most challenging thing about scoring, but also what keep it interesting. There is always more to learn.”
Johnson’s first game as an official MLB scorer was on the Twins Opening Day in 2022, a day she recalls as a “whirlwind.”
“Amid all of the pageantry of the first day of a new season, I was busy figuring out how to get everything I would need during the game in place,” she said. “I remember spending most of the game trying not to forget anything I was responsible for. Fortunately, it was a fairly easy game. I didn’t have to make any tough judgment calls.”
Johnson, who scored 18 games at Target Field last season, described her game-day routine and responsibilities in detail for the Roundtable.
“Scorers have to be there an hour before the game, but I’m always early, because I like to get everything set up and tested so I can go and eat dinner before the game,” she explained. “I have my rule book, binoculars and pencils with me at every game. I know some official scorers keep score in pen and I don’t know how they do it. I’ve always kept score in pencil, but everyone’s system is a little different.
“We also have to have a laptop with us because we stream the game feed so we can watch a replay if we need to make a judgement call or have a crazy play,” Johnson continued. “We also have a program that provides clips of each play so that we can easily go back and watch something again and don’t have to search through the TV broadcast to find what we need.”
Johnson noted that weather conditions are one of the factors scorers are required to take into consideration for judgement calls, so she checks out current and expected weather conditions before she arrives at the ballpark.
There is always a microphone nearby, she added.
“The official scorer is in the press box during the game and has a microphone to announce decisions and other game information to those in the press box and scoreboard booth,” she said.
Baseball Roundtable Note: Note: Johnson also scores University of Minnesota Gophers and Saint Paul Saints games and, last season, scored approximately 40 games among the Twins. Saints and Gophers.
Official scorers are selected by and are employees of Major League Baseball, not any specific team, and are paid by MLB. Scorers are paid approximately $35/hour depending on qualifications and experience.
Johnson added that there is just one official scorer for each game, but MLB does provide some support for the decision-making process.
“The lone official scorer at each game is responsible for making every decision,” she explained. “However, we are assigned an official scoring support person for each game – typically a veteran official scorer for another market whose team is on the road. We communicate with them via Slack (instant messaging software) and they can help provide a second opinion or help clarify a rule if something crazy happens. Ultimately, however, the final decision lies with the official scorer at the ballpark.”
Johnson told Baseball Roundtable that her role has an official scorer has changed the way she watches a game, but not how much she enjoys the national pastime.
“When you’re working the game, you’re definitely not just sitting there relaxing as you would be as a fan, but it’s particularly enjoyable to be constantly involved in the game,” she said. “Scorers are responsible for paying attention to every pitch, no matter what the score, no matter who is on the field or what the situation is, and no matter how long the game lasts. You definitely have to be a huge baseball fan to maintain that intense level of attention for that long.”
I asked Johnson what the toughest calls to make are – like a possible error on a ball that went untouched, giving an error on thrown ball to the fielder who made the throw or the player who was its target or calling a hit or error on a tough fielding chance.
“The short answer is … all of them! But the hardest part about doing official scoring for me is when you have a crazy inning where things just keep happening and you’re not only making judgement calls, but have to constantly keep track of everything so you can reconstruct the inning,“ she said. “I had a Gophers game where I had three errors and a passed ball in the same half inning. At the time, you just do the best you can to keep track of everything and keep going … and then you can go back and reconstruct the inning after the game is over.”
Johnson recalled a couple of particularly exciting games she scored in 2022.
“Being involved in a no-hitter or near no-hitter is always one of the most exciting, but also nerve-wracking, games to work as a scorer, “ she said. “I had two such experiences last year. I was the official scorer for the first no-hitter in CHS Field history at a Saints game. Then, in my third MLB game as an official scorer, Justin Verlander took a no-hitter into the eighth inning against the Twins. I didn’t have to make any controversial judgement calls in either one, but constantly knowing that I might have to on the next pitch was stressful!”
Johnson added that an official scorer needs to have a thick skin.
“In addition to being detail-oriented and having a love of the game – so you can pay attention to every pitch as long as the game lasts – you have to have a thick skin and calm demeanor,” Johnson said. “You’re constantly making judgment calls and, no matter what the call, there’s a chance someone might be upset. You have to remain calm – and be able to articulate why you called a certain play the way you did.”
Asked for any advice she’s give to prospective scorer, Johnson suggested :
- Get a copy of MLB’s official rules and read it, especially the section on official scoring; and
- Get experience in scoring whenever and wherever you can – high school, town ball, college, the minor leagues.
Johnson strongly stressed the importance of knowing and relying on the rule book. “No matter what level you are scoring, use the rule book to work through situations as they come up during a game,” she said. “I frequently pull mine out – even when I’m at home watching a game.”
Johnson’s sports-related work, by the way, is not limited to baseball. She is also one of the scoreboard operators for the NBA’s Minnesota Timberwolves and does scorekeeping for boys and girls basketball at the high school level; activities she says “keep my scorekeeping brain active while I’m waiting for the next baseball season to begin.”
If you want to learn more about MLB’s group of female official scorers, just click here.
Baseball Roundtable – Blogging Baseball Since 2012.

 Baseball Roundtable is on the Feedspot list of the Top 100 Baseball Blogs. To see the full list, click here.
Baseball Roundtable is also on the Anytime Baseball Supply Top 66 Baseball Sites list. For the full list, click here.
I tweet (on X) baseball @DavidBaseballRT
Follow Baseball Roundtable’s Facebook Page here. More baseball commentary; blog post notifications.
Member: Society for American Baseball Research (SABR); Negro Leagues Baseball Museum; The Baseball Reliquary.