Ranking Fifteen Tense 1-0 Games … and More

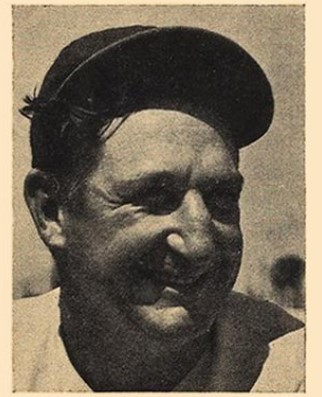
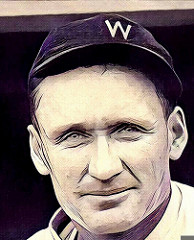
Walter Johnson. Photo by pingnews.com

It’s the dreaded baseball off-season and, as usual, Baseball Roundtable is drawn to random musings driven by the baseball record book.  And – also as usual – as I approached this task, one thing led to another.  In this case, a look at Hall of Famer Walter Johnson’s record in 1-0 games, led to a foray into unique 1-0 contests in MLB history.

Let’s start with Johnson, in his 21 MLB seasons, The Big Train took the mound in 65 1-0 contests – putting up a 38-26 (with  one no-decision) record.  His 65 appearances included 62 starts and three relief appearances and – an illustration of how times have changed – Johnson threw complete games in 60 of those 62 starts.

By comparison, in 24 seasons, Roger Clemens took the mound in 21 games that ended in a 1-1 score, going 8-5, with eight no-decisions.   He started all 21 games and completed four.  In 2005,  Roger Clemens started for the Astros in five games that ended in a 1-0 score. The Astros lost all five, with Clemens getting five no-decisions.  In those five no-decisions, Clemens pitched 35 innings, giving up 15 hits and no runs, while walking eight and fanning 37. In the 2005 season, the Astros were shutout in nine of Clemens’ 32 starts. I warned you that “one thing leads to another.”

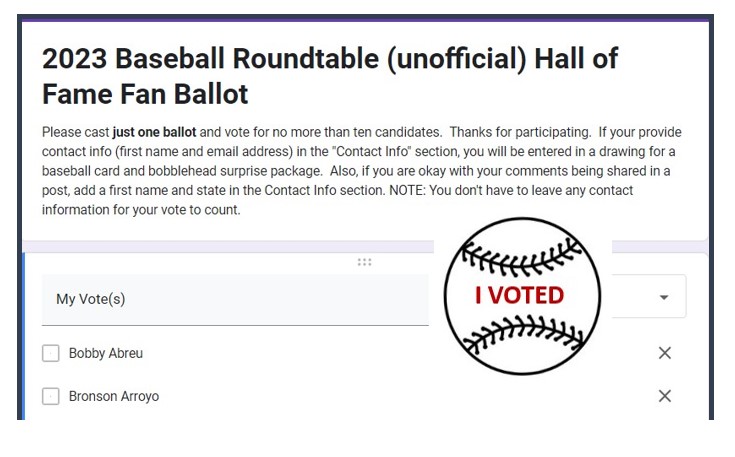
NOTE:  THERE IS STILL TIME TO VOTE IN BASEBALL ROUNDTABLE’S FAN 2023 HALL OF FAME BALLOTING.  CLICK HERE TO GO TO THE POST THAT HAS A LINK TO THE BALLOT. 

Now, lets look at some notable 1-0 tilts, starting with one  by the layer who spurred this post.  I should add hat I have ranked these games subjectively, in terms of their interest to me – as opposed to their objective significance.

Number One – Probably Never See This  Again

Hall of Famer Walter Johnson is one of four players to share the record for the longest complete-game shutout in MLB history.  Three of the four ended in 1-0 scores.  Johnson  shutdown the Chicago White Sox 1-0 over 18 innings on May 15, 1918.  Johnson gave up ten bits and one walk, while fanning nine. His mound opponent, Lefty Williams, also went the distance, gave up just eight hits, with two walks and three strikeouts. Johnson – a good-hitting pitcher – played a role in the 18th inning score. Senators’ catcher Eddie Ainsmith rapped a one-out single, with Johnson singling him to third and Ainsmith scoring on a wild pitch. In this age of pitch counts and relief specialists, we’re not likely to see another 18-inning complete game.

The other complete-game, 18-inning 1-0 winners:

  • The Providence Grays’ John Montgomery Ward shut out the Detroit Wolverines 1-0 over 18 innings on August 17, 1882.  Ward started is career as a pitcher/outfielder  (leading the league in wins with 47 in 1878 and tossing a perfect game that season). An arm injury resulted in his switching to a full-time infielder after seven MLB seasons. Montgomery earned a Law Degree in the off-seasons and set up the first-ever players union in 1885.

Walk-Off Winner

John Ward’s 18 inning 1-0 win is reportedly the first 1-0 game won by a walk-off home run, The dinger was hit by Hall of Fame pitcher Charles “Old Hoss” Radbourn, who was playing outfield that day.

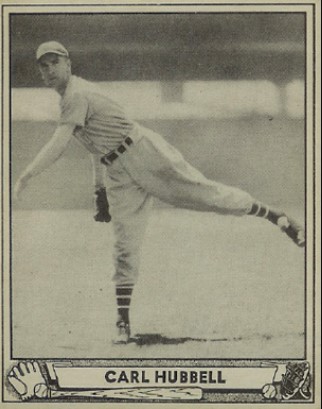
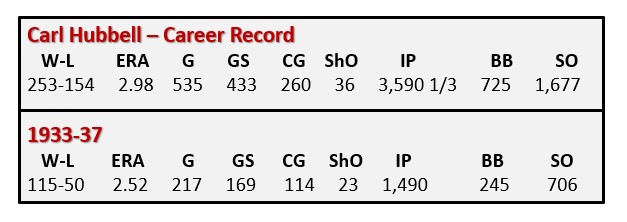
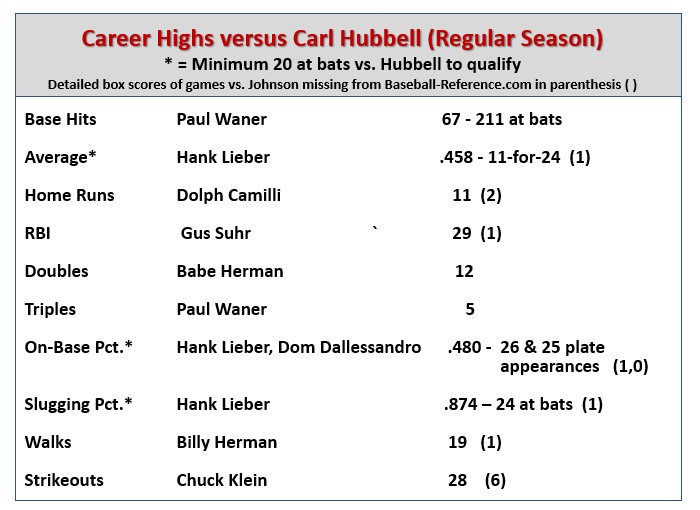
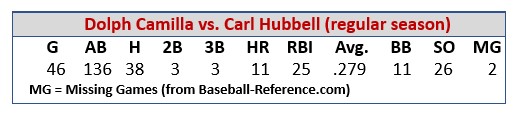
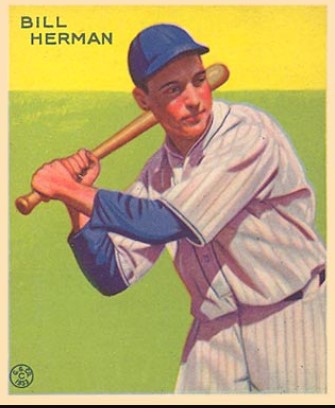
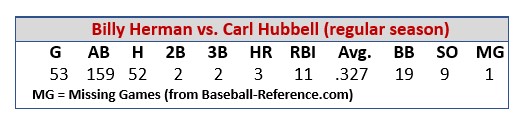
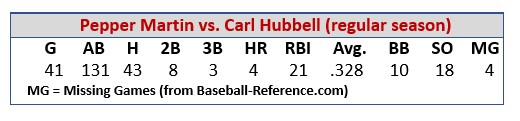
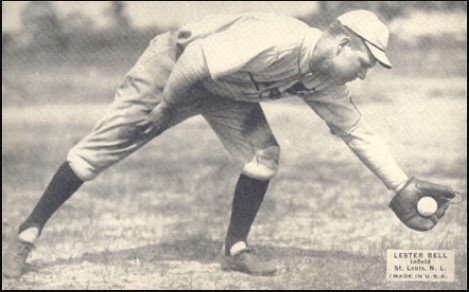
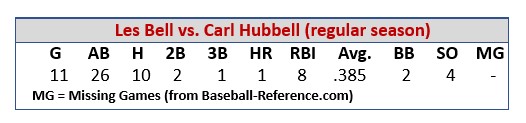
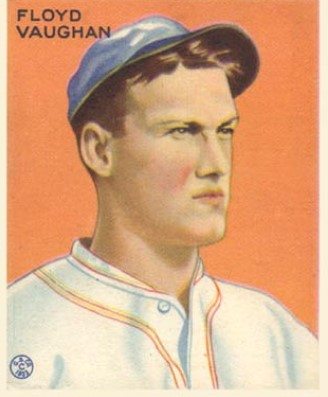
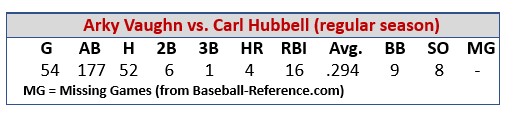
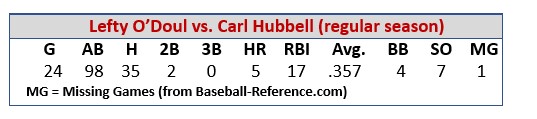
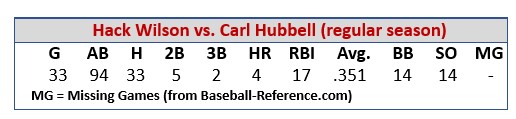
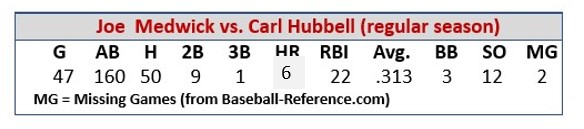
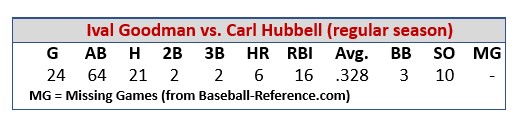
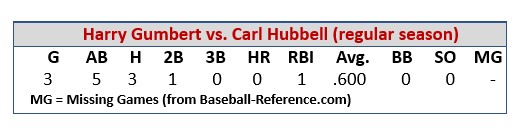
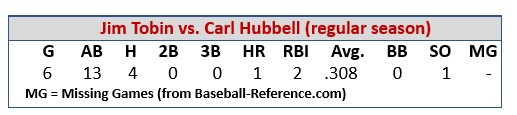
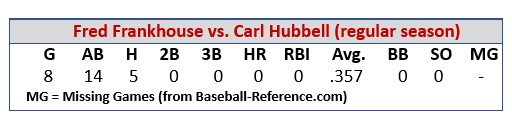
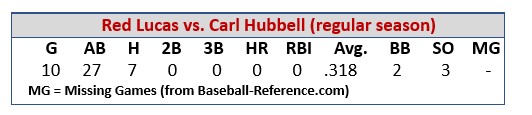
  • The Giants’ Carl Hubbell whitewashed the Cardinals 1-0 over 18 innings on July 2, 1933.

The other pitcher to toss 18 shutout innings in a game was the Tigers’ Ed Summers, who on July 16, 1909, held the Washington Senators to no runs on seven hits (two walks ten strikeouts) over 18 innings in a contest that ended in a 0-0 tie.  (Two Senators’ hurlers gave up just six hits, with seven walks and seven whiffs.) Summers pitched in five MLB season, going 68-45, 2.42. (He was 24-12, 1.64 as a rookie in 1908.) His career was cut short by arm issues.

Walter Johnson Tidbit

Walter Johnson’s MLB-record 110 complete-game shutouts and record (tied) for leading the league in shutouts (seven seasons) provide ample evidence that he is the “King of the Whitewashing.” On Labor Weekend 1908 – in just his second MLB season – the 20-year-old  future Hall of Famer gave notice of what lie ahead.

Johnson’s Senators were in New York for a weekend series against the Highlanders (Yankees).  Johnson started on Friday, September 4 and threw a six-hit, complete-game shutout. He came back on Saturday the fifth and was even better, tossing a four-hit shutout. Sunday, fortunately for Johnson’s arm, was an off day (no Sunday baseball).  On Monday, Johnson was back on the mound and he was even better, this time tossing a two-hit shutout. So, in four days, he threw three complete-game shutouts, pitching 27 innings, giving up just 12 hits (one walk, 12 strikeouts). No probably here – we will never see that again.

Number Two – 1-0 … Almost 3-0 … Almost Perfect

Subtitle – The Unlucky 13th

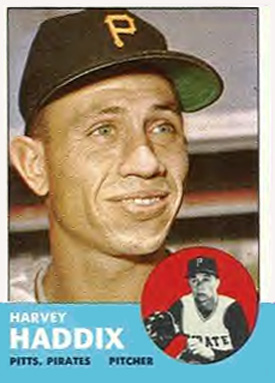
On May 26, 1959, Pirates’ southpaw Harvey Haddix took the mound against the power-laden Milwaukee Braves (who had won the National League pennant the previous two seasons and came into the game again leading the league).  Haddix retired the first 36 hitters in order – fanning eight over 12 perfect innings.  A 20-game winner in 1953, the 33-year-old Haddix had come into the game 4-2, with a 2.67 ERA in seven starts – and had thrown complete games in his two previous outings. (He would end up 12-12, 3.13 on the year.)

Unfortunately, the Braves’ Lew Burdette, despite giving up 12 hits and fanning only two, had held the Pirates scoreless. (Like Haddix, Burdette had not issued a single free pass.) Milwaukee 2B Felix Mantilla led off the 13th by reaching on error by Pirates’ third baseman Don Hoak. Slugging 3B Eddie Mathews bunted Mantilla over to second, which led to an intentional walk to RF Hank Aaron, bringing up 1B Joe Adcock.  Adcock rapped a 1-0 pitch over the right field fence for what appeared to be a three-run home run.  However, the Braves, in celebrating the tension-filled victory, forgot how to run the bases. Adcock passed Aaron between second and third and, after some deliberation, Adcock was called out – ultimately changing his three-run homer to a one-run double. So, despite 12 perfect innings, Haddix lost the no-hitter, the shutout and the game itself.  But he did etch his name forever into baseball lore; and countless trivia quizzes – and made this one memorable 1-0 ball game.  This game got extra points in my subjective ratings because, as an 11-year-old Braves fan at the time, I was listening to the game on the radio.

Haddix spent 14 seasons (1952-65) in the major leagues (Cardinals, Phillies, Reds, Pirates, Orioles), going 136-113, 3.48.  His best seasons were with the Cardinals in 1953-54. In those two campaigns, Haddix put up lines of 20-9, 3.06 and 18-13, 3.57.  The 5’9”, 170-pounder was a three-time All Star and led the NL in shutouts (six) in 1953.

Harvey Haddix Tidbit

Harvey Haddix 12 perfect innings on May 26, 1959, were particularly improbable. One, Haddix was suffering from the flu that day.  Two, it was later reported that the Braves were stealing the signs  laid down by Pirates; catcher Smoky Burgess (and they still couldn’t hit him.)  

Number Three – One Game … Two pitchers … One Hit … 1-0
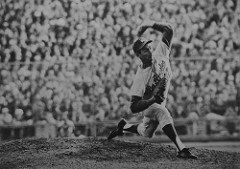
Photo by cliff1066™

When Dodgers’  icon Sandy Koufax tossed a perfect game on September 9, 1965, he pretty much needed it. He was opposed by Cubs’ right-hander Bob Hendley (who went 48-52, 3.97 in a seven-year MLB career), who was on top of his game as well. After eight innings, Hendley had given up just one hit and one walk (versus three strikeouts). The only hit had been a harmless double by Dodgers’ LF Lou Johnson in the bottom of the seventh. Hendley had allowed just one run in eight frames – and even that wasn’t his fault.  The pesky Johnson had led off the fifth with a walk; moved to second on a sacrifice by RF Ron Fairly; stole third; and scored as Cubs’ C Chris Krug made a wild throw past third baseman Ron Santo.

Hendley’s efforts, however, weren’t nearly enough that day. Koufax, who came into the game already a 20-game winner (21-7 on the season), threw a perfect game – striking out 14 Cubs. A high-rating here, for the perfect game and  the fewest combined hits ever allowed in an M LB game.

Number Four – A Hard Day’s Night

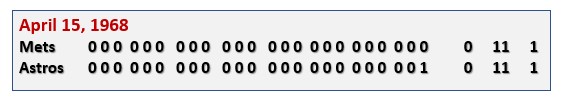
On April 15, 1968, the Astros and Mets started a 1-0 contest that did not end until 1:37 a.m. April 26.  It tied for the fourth-longest game in MLB history – and the 24 innings represent the single-game record for the longest any game remained scoreless.  Points were given here for the length of game and how each team’s offensive futility mirrored the other. A few tidbits:

  • Each team collected eleven hits in 79 at bats during the game (won by the Astros with one out in the ninth) – a combined batting average for the game of .139.
  • Mets’ pitchers faced 87 batters; the Astros 88.
  • Each team had ten singles and one double;
  • Each team left 16 men on base.
  • Each team made one error.
  • Each team threw two wild pitches.
  • Each team turned one double play.
  • Each team used four pinch hitters
  • The two starting pitchers, Tom Seaver and Don Wilson, came in with ERAs of 3.24 and 3.00, respectively – and left with ERAs of 1.47 and 1.50, throwing ten and nine scoreless innings, respectively.

A few other overall facts:

  • A total of 39 players appeared.
  • 27 of the 48 half-innings were 1-2-3 frames.
  • There were 35 strikeouts in the game.
  • The Mets’ CF Tommie Agee and RF Ron Swoboda each went zero-for-ten in the game.
  • The game took six hours and six minutes.
  • The winning run scored on a groundball error.

Game Tidbit

After 23 1/2 scoreless frames, the deciding bottom of the 24th went like this:  With Les Rohr on the mound for the Mets, Astros’ RF Norm Miller (at the time 0-for-seven) singled to right; Rohr balked him to second; LF Jim Wynn was intentionally walked; Rusty Staub grounded out second-to-first, with the runners moving up to second and third base; PH John Bateman was intentionally walked; 3B Bob Aspromonte (at the time 0-for-8) reached on an error by Mets’ SS Al Weiss, with Miller scoring the game’s lone run.

Number Five – 61 in ‘61
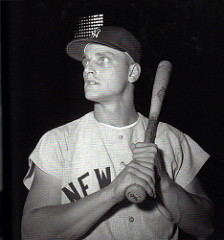
Photo by rchdj10

One of my favorite trivia questions has always been: What was the score of the game in which Roger Maris hit his then record-breaking 61st homer?  Since this post is about 1-0 games, you can be sure that was the score. On October 1, 1961 – in the Yankees’ final game of the regular season – Roger Maris hit his 61st home run of the season.  The shot came off Tracy Stallard with one out in the bottom of the fourth inning. Breaking an iconic record, on the final day of the season, in a tight 1-0 game, versus the  arch-rival Red Sox earns this spot in the Roundtable rankings

Roger Maris Tidbit

1961, the year Roger Maris hit 61 home runs, was the only season in his 12-year MLB career that he did not draw a single intentional walk.  

 Number Six – A Double No-No … Well, Almost

On May 2, 1917 the Reds faced the Cubs in Chicago, with righty Fred Toney starting for the Reds and southpaw  Jim “Hippo” Vaughn on the bump for the Cubs. Toney, who would win 24 games that season, came in with a 4-1, 1.88 record and five complete games in five starts.  Vaughn, on his way to a 23-win season, stood at 4-2. 2.25, with three complete games in four starts. The expected pitching duel materialized.

After nine innings, the game was knotted at 0-0 and neither Toney nor Vaughn had surrendered a hit (the only MLB game ever in which both pitchers held the opposition hitless for nine frames). Vaughn seemed to be getting the better of it. Each pitcher had walked just two batters, but Vaughn had fanned ten to Toney’s one.  In the top of the tenth, Vaughn faltered and a pair of singles and an outfield error led to an unearned run. Toney pitched a 1-2-3 bottom of the inning (strikeout-fly out-strikeout) to leave the mound with a 1-0 no-hitter win.

Toney pitched 12 MLB seasons (1911-13, 1915-23), going 139-102, 2.69 and twice won 20 or more games. Vaughn pitched in 13 MLB seasons (1908, 1910-21), going 178-137, 2.49 – and won twenty or more games in five seasons. In 1918. Vaughn won the pitching Triple Crown, leading the NL in wins (22), ERA (1.74) and strikeouts (148).

Hippo Vaughn Tidbit

The last two MLB hitters Hippo Vaughn faced (Giants’ C Frank Snyder and the opposing pitcher Paul Douglas) both homered against him (a Grand Slam and a solo shot) with one out in the fourth inning of a Giants’ 6-5 win over Vaughn and the Cubs on July 9, 1921. Vaughn was pulled from the game and reportedly left the club – never to play in the major leagues again. Various explanations for Vaughn’s departure (and subsequent suspension) from the major leagues have surfaced, but none have been officially confirmed. According the Vaughn’s  Society for American Baseball Research biography (written by Jan Finkel) Vaughn did go on to pitch for several years in a number of semi-pro leagues.  In his final M LB season, he was 3-11, 6.01.

Number Seven – Let’s Get This Party Started

On Opening Day 1940 (April 16), the Indians’ Bob Feller no-hit the White Sox 1-0 in Chicago, walking five and fanning eight. The 21-year-old Feller would go on to post a 27-11, 2.61 record that season – leading the AL in wins, ERA, starts (37), complete games (31), shutouts (4), innings pitched (320 1/3) and strikeouts (261).

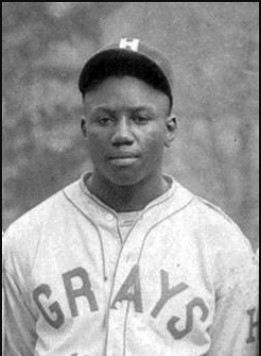
Six seasons later – on Opening Day 1946  – Leon Day of the Negro National League Newark Eagles no-hit  the Philadelphia Stars 2-0.  The only other no-hitter recorded on MLB Opening Day.  Feller’s 1-0 win remains the first Opening Day NO-NO and the only Opening Day 1-0 no-hitter – and worth of this spot on this list.

Number Eight- Another Johnson Shutout

On Opening Day 1926 (April 13), Walter Johnson went the distance in a 15-inning 1-0 win (Washington Senators over the Philadelphia Athletics). Johnson gave up  just six hits and three walks, while fanning nine.  His mound opponent, Eddie Rommel, was nearly as good. Going the distance and giving up just one run on nine hits (six walks/one whiff).  Three of those nine safeties – and the game’s lone run –  came in the bottom of the fifteenth (the longest MLB Opening Day, complete-game shutout).

Walter Johnson tidbit

Walter Johnson threw a record seven Opening Day shutouts (in 14 Opening Day starts).

Number Nine – Something Old … Something new … One Pitcher to Go Home Blue

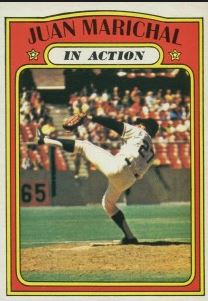
On July 2, 1963, 42-year-old southpaw Warren Spahn (already an 11-time 20-game winner) faced off in San Francisco versus the Giants’ 25-year-old righty Juan Marichal, who was on his way to his first 20+ win season. Spahn came into the game at 11-3. 3.12, coming off a June 28 complete-game shutout of the Dodgers (besting Don Drysdale by 1-0 score). Marichal was at 12-3, 2.38.

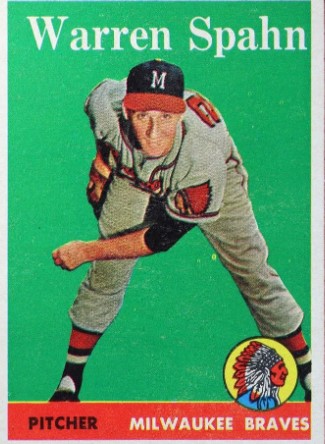
The two high-kickers went on to an epic pitching duel – both going the distances in a 1-0, 16-inning Giants’ win. The game was scoreless through 15 innings. Marichal held the Braves at bay in the top of the 16th inning and with one out in the bottom of the 16th, Willie Mays hit a walk-off home run off Spahn to end he contest.

At the close of the game, Marichal had thrown 227 pitches, giving up just eight hits and four walks, while fanning ten.    Spahn has launched 201 pitches, giving up nine hits (and that one run), while walking one and fanning two.  Spahn finished the season at 23-7, 2.60, with a league-leading 22 complete games. Marichal went 25-8, 2.14 and lead the NL in wins as well as innings pitched (321 1/3).

1963 Tidbit

Neither Warren Spahn or Juan Marichal received a single vote in the Cy Young balloting, as the Dodgers’ Sandy Koufax was a unanimous choice at 25-5, with a league-low 1.88 ERA, a league-topping 306 strikeouts and a league-best 11 shutouts.

Points given here for the classic old and crafty master versus the hard-throwing youngster matchup.

Number Ten – Leave Me In, Coach

The 1991 World Series was one for the ages. It went seven games, five of which were decided by one run and three of which went extra innings. The seventh and final game was a ten-inning 1-0 affair, with Twins’ starter Jack Morris going the distance, giving up seven hits and two walks, while fanning eight. This one is here partially because I was at this tense contest – and by the fact that Morris fashioned ten scoreless innings in the winner-take-all game.

Number Eleven – Talk about Stealing a Game

As I prepared this post, I came across more than a dozen 1-0 (AL/NL) games in which the only run was a steal of home and nearly three dozen games that ended with a walk (run)-off steal of home. However, I found only one 1-0 game that ended with a walk-off steal of home.   That occurred on April 28, 1906, as the Cubs, with Cubs ‘first baseman Frank Chance (of Tinkers-to Evers-to Chance fame) swiping home in the bottom of the ninth to break a 0-0 tie. Chance, by the way, didn’t have to wait for the manager’s signal to take the risk – he was, at the time, the Cubs’ first baseman, cleanup hitter and manager (in fact, he managed the Cubs to a 116-36 record that season).  Chance played 17 MLB seasons (1898-1914), hitting .296-20-596, with 403 steals. He had a 768-389 record in eight seasons as a manager,  winning four pennants and two World Series Championships.

Number Twelve – Another Way to Get the Party Started

There have been 28 AL/NL 1-0 games in  which the only run came on a leadoff home run. Not rare enough to catch Baseball Roundtable’s eye.  However, there have been only two 1-0 games (that I could document) in which that leadoff home run came on the very first pitch.

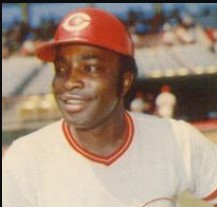
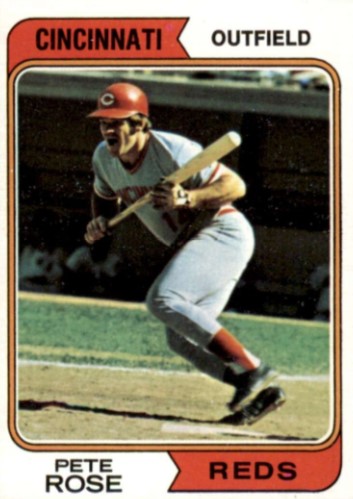
On September 2, 1963, Pete Rose was playing second and leading off as the  Reds faced Mets’ righty Jay Hook in New York. Rose hit Hook’s first offering of the game for a home run to deep left – and the long ball proved to be the only run of the game. The Reds’ Jim Maloney picked up his 20th win of the season, tossing a three-hit, six-walk, 13-whiff shutout.  Hook – who ended the season 4-14, 5.48, pitched one f his best games of the season – going nine-innings and giving up just the one run (four hits, one walk and five strikeouts.)

Jay Hook Tidbit

Despite his 5.00+ ERA and 4-14 record in 1963, three of Hooks’ four wins were complete games in which he gave up two or fewer runs.

On May 18, 2013 the Diamondbacks faced the Marlins (and starting pitcher Tom Koehler) in Miami. Gerardo Parra was leading off and playing RF for the Diamondbacks and he hit Koehler’s first pitch of the game for a home run to right.  It proved to be the only run of the game, as Koehler and three Miami relievers  allowed just one walk and three singles the rest of the way,  Diamondbacks’ starter Brandon McCarthy – who came into the game 0-3, 5.63 in eight starts – was up to the challenge, holding the Marlins scoreless  for a three-hit, complete -game shutout and his first win of the season.  It was one of just four shutouts in McCarty’s 13-season (2005-09, 2011-18) MLB career.

A first pitch home run as the only scoring deserves recognition.

Number Thirteen – The All Star Game without an RBI

“Who had the game-winning RBI in three 1968 All Star Game? “ Answer: No One – Not a single RBI was awarded as the National League topped the American League 1-0 on July 9, 1968.

The only run in this game scored in the bottom of the first.  National League CF Willie Mays singled off Luis Tiant to open the inning and went second on a botched pick-off (error on Tiant). LF Curt Flood then walked and, on a wild pitch, Mays went to third. 1B Willie McCovey then grounded into a double play, scoring Mays, but with no RBI (an unearned run).  From that point on, no one scored. The game saw a total of only eight hits (three by the winning NL squad) – four doubles and four singles. The 12 pitchers walked six (all by the AL hurlers) and fanned 20 (11 by the NL moundsmen).

It was “The Year of the Pitcher,” but still you have to give a shout out to the moundsmen that held all those All Star bats at bay: Luis Tiant (who gave up the sole – unearned – run); Blue Moon Odom; Denny McLain; Sam McDowell; Mel Stottlemyre; Tommy John; Don Drysdale; Juan Marichal; Steve Carlton; Tom  Seaver; Ron Reed; Jerry Koosman.

Number Fourteen – Cy-anora

On September 22, 2011, Cy Young took the mound for the Boston Rustlers (versus the Pittsburgh Pirates). The future Hall of Famer – at the age of 44 – twirled a nine-hit (no-walk, three-whiff) shutout for a 1-0 victory.  It was his 511th – and final – regular-season win.  Young started three more games before retiring from the big-league mound at the end of the campaign and took the loss in all three.

You have to acknowledge the great Cy Young’s final victory.

Number fifteen – Number Short, But Sweet

Don Fisher was a 29-year-old rookie right-hander –  signed by the Giants (off the Cleveland sandlots) in 1945 –  getting his chance to pitch in the major leagues when the rosters were depleted by World War II.  He made his debut on in relief on August 25, 1945, giving up four runs in five innings of relief.   A month later (September 30), on the final day of the season,  he pitched in his second (and final) MLB game, starting for the Giants against the Braves in Boston. That proved to be a memorable 1-0 game, as Fisher pitched a 13-inning, ten-hit, complete-game shutout (three walks and two strikeouts). The lone run scored on a home run by Giants’ third baseman and number-eight hitter Nap Reyes. Notably, it was Fisher’s final MLB appearance and only MLB win, as well as  Reyes’ final major-league hit. Reyes got only one more MLB at bat (on April 27, 1950). Reyes played in four MLB seasons (1943-45, 1950) and hit .284-13-110 in 279 games. Fisher went to Spring training with the Giants in 1946, but was sent down to the minors where he went 3-85.02 in his only other professional seasons.

Primary Resources: Baseball-Reference.com; Baseball-Almanac.com

Note: Some of  he MLB records noted in this post have the potential to change as Major League Baseball recognizes and further incorporates Negro League records from 1920-48. 

Baseball Roundtable – Blogging Baseball Since 2012.

100Baseball Roundtable is on the Feedspot list of the Top 100 Baseball Blogs.  To see the full list, click here.

I tweet (on X) baseball @DavidBaseballRT

Follow Baseball Roundtable’s Facebook Page here.  More baseball commentary; blog post notifications.

Member: Society for American Baseball Research (SABR); Negro Leagues Baseball Museum; The Baseball Reliquary. 

Baseball Roundtable 2023 Baseball Hall of Fame (unofficial) Fan Ballot

The 2023 Baseball Writers Association of America (BBWAA) Baseball Hall of Fame ballots are out – and that means the 2023 Hall of Fame Debate Season is officially underway!  Eligible BBWAA members have until December 31 to cast their ballots (they can vote for up to ten candidates), with results announced  January 23, 2023 and the 2023 Induction Ceremony slated for July 23.  This year’s traditional ballot includes 14 holdovers from last year, along with an equal number of  newcomers.  This also means the Baseball Roundtable (unofficial) Baseball Hall of Fame Fan ballot is once again open for voting. This unofficial balloting will officially close on the morning of January 3.

In this post, BBRT will share:

  • BBRT’s ballot (if I had one);
  • A deep look into all the candidates on the ballot;
  • A link to BBRT’s unofficial fan ballot – please take a few minutes to follow the link and cast your votes – you could become eligible for a baseball card and bobblehead surprise package. 

–PARTICIPATE IN BASEBALL ROUNDTABLE’S  2023 FANS’ HALL OF FAME BALLOT—

Baseball Roundtable is once again conducting an unofficial fan ballot – to cast your vote(s), click here.   Remember, you can vote for up to ten of the nominees for 2023 induction.  If you want to read through the nominees’ bios first, there is another link to the BBRT Fan Ballot following the bios (near the end of this post).  BBRT will be providing updates on the fan balloting, as well as a post-election comparison of fan votes as compared to the final BBWAA results.  Voting on the BBRT Fan Ballot will remain open until January 2, 2023.

Also, if you leave your email address in the Contact Info section at the end of the ballot, you will be entered in a bobblehead and baseball card “surprise-prize” drawing.  You will find a link to the ballot after the biographies. 


To skip the post and go directly to the fan ballot, click here.  


As you consider this year’s slate of candidates, BBRT would stress that all the players on the ballot – even those who remain for only one voting cycle – deserve recognition. To rise to the major leagues, last ten years and make it past the Hall of Fame Screening Committee is a significant accomplishment in itself.  In fact, the annual ballot release is a highlight for Baseball Roundtable, as it provides a chance to acknowledge the accomplishments of all the candidates – not just the favorites for election.  For example, a review of the ballot gives us the opportunity to honor Matt Cain’s perfect game;  Jered Weaver’s no-hitter; Jacob Ellsbury’s 30-30 season; Andre Ethier’s 30-game hitting streak; John Lackey’s two World Series-clinching wins; Bronson Arroyo’s nine straight seasons of 30+ starts; and much more.

Now on to the official 2023 Baseball Hall of Fame election process itself – and, then, a look at the players on the ballot for 2023.

BASEBALL HALL OF FAME ELIGIBILITY/CRITERIA FOR ELECTION

The basic rules for eligibility are that a player must have played at least ten seasons and be retired for at least five years. In addition, the player must be approved for the ballot by the Hall of Fame Screening Committee.

A player can remain on the ballot for up to ten years, but must receive at least five percent of the vote in the preceding year’s ballot to remain on the ballot.  Each voter can vote for up to ten candidates.  Election requires that a player be named on at least 75 percent of the ballots cast.

The criteria for election: “Voting shall be based upon the player’s record, playing ability, integrity, sportsmanship, character, and contributions to the team(s) on which the player played.”

A few of preliminary comments.

  • This year’s ballot is not as crowded with strong newcomers as those as those we have seen in some recent years.  In the last five balloting sessions, for example, we have seen Derek  Jeter, Mariano Rivera, Roy Halladay, Chipper Jones, Jim Thome, David Ortiz and Ken Griffey Jr. all elected on their first ballots.
  • The strongest first-time candidates this year would appear to  Carlos Beltran and Francisco Rodriguez.
  • The 2023 ballot also includes just one player in his final year of eligibility – Jeff Kent.  Players can often expect a “final year” boost in support. Kent, however, was only at 32.7 percent last year, so it would take quite a boost.
  • The PED-controversey should play less of a role in this year’s balloting, with some pretty big names dropped from the ballot.  (That also may free up some votes for other candidates.)
  • The holdovers  with the most support year ago are Scott Rolen (63.2 percent); Todd Helton (52.0%); and Bill Wagner (51.0%).

Baseball Roundtable thinks a shutout is very possible this year. The candidates I would rank with the best chance for election appear to be Scott Rolen, Carlos Beltran and  Francisco Rodriguez (in that order).  Now, let’s take a look at how BBRT would vote if I had a ballot; and, along the way, the bios of these year’s candidates.

Again, to jump directly to the ballot itself, click here.

— PLAYERS WHO WOULD GET BBRT’S VOTE …

Jeff Kent – (Second Base/Third Base/First Base, 1992-2008) …  Tenth (final)  year on the ballot, 32.7 percent last year.

KentBBRT has long believed Jeff Kent is a deserving candidate, but he has not been getting much support from the writers.  Kent holds the all-time MLB record for home runs by a second baseman (351 of his 377 career round trippers were hit while in the lineup at second base). He has a healthy .290 career batting average; his 1,518 RBI are 54th all-time; and his 560 doubles 30th.  His 984 extra base hits are 43rd all-time.

Kent was a five-time All Star and the 2000 NL MVP.  As primarily a middle infielder, he hit 20 or more home runs in 12 seasons (a high of 37 in 2007) and topped 100 RBI eight times. He hit .276, with nine home runs and 23 RBI in 49 post-season games.

Running with the Big Boys …

Jeff Kent has more career runs batted in (1,509 in 17 seasons) than such noted Hall of Famers (who played a comparable number of seasons) as Mickey Mantle (1,508 in 18 seasons), Billy Williams (1,475 in 18 seasons), Eddie Mathews 1,453 in 17 seasons), Duke Snider (1,333 in 18 seasons) and Orlando Cepeda (1,365 in 17 seasons). Not bad for a middle infielder.

Kent has the credentials, but BBRT has a hunch the writers may keep him on the bench – a couple of Gold Gloves, at this traditionally defense-oriented position, would have really helped his case.  Kent played for the Blue Jays (1992), Mets (1992-1996), Indians (1996), Giants (1997-2002), Astros (2003-2004) and Dodgers (2005-2008).

Jeff Kent’s Best Season: With the Giants in 2000, Kent put up these stats – 159 games; 196 hits; .334 average; 33 home runs; 125 RBI; 114 runs; 12 steals. His performance earned him the NL MVP Award.

Kent gets BBRT’s vote – and I believe the BBWAA’s support is overdue (but not forthcoming).  This is one HOF “snub” that somewhat confuses BBRT.  (Over the past three ballots, Kent has moved from 27.5 percent to 32.7 percent. The odds are against him.

_________

Todd Helton – (First Base, 1997-2013) … Fifth year on the ballot, 52.0 percent last year.

HeltonTodd Helton moved from 16.5 percent of the vote to 52 percent between his first and fourth  years on the ballot. He faced some pretty strong competition on past ballots and this year’s lighter ballot should help boost his numbers.  (I expect he might reach 60-65 percent). Still, he is hampered by the fact that he spent his entire 17-year career with the Rockies (playing half his games in hitter-friendly Coors field).  Helton, who put up a .316 career average, hit .345 at home and .287 on the road. Despite that home/road split, Helton’s body of work deserves HOF consideration.

Helton was a five-time All Star, three-time Gold Glover and four-time Silver Slugger. He hit over .300 in 12 seasons – and won the NL batting crown in 2000 with a .372 average. His 59 doubles that season are tied for the seventh-most all-time. Helton drove in 100 or more runs in five seasons and scored in triple figures six times. His 1,335 walks (38th all-time) indicate the respect he earned at the plate.  Helton also ranks fifth in games played at first base, third in career assists at the position, 13th in putouts and third in double plays.

400 Rocks

Todd Helton is one of only 18 players to reach 400 or more total bases in a season – and one of only seven players to have multiple 400+ total base campaigns. He is also one of only 12 players with 100 or more extra-base hits in a season; one of only three with multiple seasons with at least 100 extra-base hits and the only player with consecutive seasons of 100 or more extra-base hits (2000-2001).

Todd Helton’s Best Season: In 2000, Helton won the NL batting crown with a .372 average – and also led the league in base hits (216), doubles (59), RBI (147), on-base percentage (.463), slugging percentage (.698) and total bases (405).  He also scored 138 runs and hit 42 home runs.

Helton will stay on the ballot and has a chance at entry into the HOF – he’s just not likely to overcome the Coors Field-bias in this year’s voting – the jump from 52 percent may just be too far.   He gets BBRT’s vote (as he has in the past).

Francisco Rodriguez – (RHP, 2002-17) –  First Year on the Ballot.

Photo: Toasterb at the English language Wikipedia project, CC BY-SA 3.0 <http://creativecommons.org/licenses/by-sa/3.0/>, via Wikimedia Commons

Francisco Rodriguez played in 16 MLB seasons (2002-17 … Angels, Mets, Brewers, Orioles, Tigers). He went 52-53, 2.86 with 437 saves (fourth all-time) in 948 mound appearances (21st all-time).

Rodriguez was a six-time All Star. He led the AL in saves three times and saved 40 or more games in six seasons and 20 or more in 11. In the five seasons from 2005 through 2009, he averaged 46 saves per season.

Rodriguez had an earned run average under 2.00 in two seasons and under 2.50 in seven campaigns. A true closer, Rodriguez pitched 976 innings in his 948 appearances, fanning 1,142 batters (10.5 per nine innings).

Francisco Rodriguez, who saved 62 games for the 2008 Angels, is the only pitcher in MLB history with 60 or more saves in a season.

In his 2002 debut MLB season, the 20-year-old Rodriguez pitched in 11 post-season games for the Angels – recording five wins (one loss) – giving up four earned runs in 18 2/3 innings, while fanning 28. What makes this especially surprising is that Rodriguez made his MLB debut on September 18 of that season and went 0-0, with no saves in five games (5 2/3 innings). So, he had five post-season victories before he recorded his first regular-season decision of any kind.

Francisco Rodriguez’ Best Season: In 2008 (Angels), Rodriguez saved an all-time record 62 games – in 69 opportunities.  He put up two wins (three losses) and a 2.24 ERA in 76 appearances – and fanned 77 batters in 68 1/3 innings.

BBWAA voters have traditionally been very demanding of relievers (although the recent inductions of Mariano Rivera and Trevor Hoffman may be a good sign – but they, of course, both had 600+ saves). It also helps that Lee Smith (478 saves) was elected by the Today’s Game Committee in 2019.  I expect Rodriguez to get notable support. There does seem an outside chance he could make it on the first ballot (but I think it would take 500 saves for that honor).  I’m looking for votes in the 40-52 percent range.

_________

Billy Wagner – (LHP 1995-2010) … Eighth year on the ballot, 51 percent last year.

WagnerBilly Wagner played for the Astros (1995-2003), Phillies (2004-2005), Mets (2006-2009), Red Sox (2009) and Braves (2010). Wagner was a seven-time All Star, who amassed 422 saves (sixth all-time) in a 16-season MLB career.  He had nine seasons of 30 or more saves; a career ERA of 2.31; 1,196 career strikeouts in 903 innings; and 47-40 won-lost record.

Whiff-and-Poof

In 1992, playing for Ferrum College, Billy Wagner set an NCAA record for strikeouts per nine innings in a season at 19.3.

Billy Wagner’s Best Season: In 2003, Wagner went 1-4, 1.78 for the Astros, saving 44 games and fanning 105 batters in 86 innings.

BBRT thinks Wagner belongs in the Hall (based on his 400+ saves) – and hopes that momentum continues to build.  Wagner has been gaining more support lately – in the last five ballots his percentages have gone 11.1, 16.7, 31.7, 46.4 and 51.0.  He should gain more ground in this year’s ballot, but 75 percent may be a bit too much of a jump.  I’d like to see Wagner at least move up to the mid-60s. He gets my vote.

__________

Scott Rolen – (Third Base, 1996-2012) … Sixth  year on the ballot, 63.2 percent last year.

Photo: User Darwin’s Bulldog on en.wikipedia, CC BY-SA 3.0 <http://creativecommons.org/licenses/by-sa/3.0/>, via Wikimedia Commons

Scott Rolen played for the Phillies (1996-2002), Cardinals (2002-2007), Blue Jays (2008-2009) and Reds (2009-2012). Those who read Baseball Roundtable regularly know how I lean toward players who flash the combination of leather and lumber – and Scott Rolen did. The seven-time All Star (including in two of his final three seasons) earned eight Gold Gloves, rapped 316 home runs. and even swiped 118 bases. He finished with a .281 average, 316 home runs, 1,287 RBI, and 1,211 runs scored. Rolen hit 25 or more home runs seven times, with a high of 34 in 2005.  He also put up five 100+ RBI seasons, scored 100+ runs in two campaigns and reached double digits in steals five times.

Off to a Good Start …

Scott Rolen was the NL Rookie of the Year in 1997 (.283-21-92, with 16 steals).

Scott Rolen’s Best Season: In 2004, with the Cardinals, Rolen hit career highs in average, home runs and RBI (.314-34-124) and won a Gold Glove.

Rolen has been climbing steadily on the ballot  since 2017, his vote percentages have been 10.2, 17.2, 35.3, 52.9 and 63.2.  He may not jump all the way to 75 percent this year, but he has a chance and is is moving in the right direction. If only he had hit 400 home runs or led the league in one of the major offensive categories, he might already be there.  (Or if his numbers hadn’t been dampened along the way by multiple  shoulder surgeries.) He would  get Baseball Roundtable’s vote – and has a solid chance to reach the 75 percent threshold within the next couple of ballots.

_________________________________

Carlos Beltran – (Outfield, 1998-2017) … First year on the ballot. 

Photo: djprybyl on Flickr (Original version) UCinternational (Crop), CC BY 2.0 <https://creativecommons.org/licenses/by/2.0>, via Wikimedia Commons

Carlos Beltran played in 20 MLB seasons – Royals (1998-2004), Astros (2004. 2017), Mets (2005-2011), Giants (2011), Cardinals (2012-13), Yankees (2014-16) and  Rangers (2016).  He had his best years with the Mets, making the All Star team in five of seven seasons. (Beltran  was a nine-time All Star. )

Let’s Get This Party Started

Beltran was the American League Rookie of the Year in 1999, when he hit .293-22-108 for the Royals, with 27 steals and 112 runs scored. 

In his 20 MLB campaigns, Beltran hit .279-435-1,587, with 312 stolen bases and 1,582 runs scored. He ranks in MLB’s top 50 in home runs (47th), RBI (41st) and total bases (34th). His 2,725 hits are 62nd all-time and his 1,582 runs scored 53rd.

Among players with at least 200 stolen base attempts, Carlos Beltran’s 86.4 percent success rate is fourth all-time. With 361 steals, he is the only player in the top 12 (percentage-wise) with more than 200 steals. 

Beltran drove in 100 or more runs in eight seasons, scored 100 or more runs in seven seasons, hit 30+ home runs in four campaigns (a high of 41 in 2006), stole 25 or more bases five times (a high of 42 in 2004). He was also a three-time Gold Glover.  Beltran was  also a solid post season performer, hitting .307-16-42 in 65 post-season games. In 2004, with the Astros, he hit .435, with 20 hits, eight home runs, 14 RBI, 21 runs scored and six steals in 12 post-season games (NL Division Series & NL Championship Series).  You read that right, 21 run scored in 12 games.

Carlos Beltran’s Best Season: In 2006, Beltran hit .275, with 41 home runs, 116 RBI, 127 runs scored and 18 stolen bases and also won a Gold Glove. He finished fourth in the NL MVP voting.

Beltran would get Baseball Roundtable’s vote and should finish north of 35 percent in his first year on the ballot. His .279 career average and the fact that he never led the league in any of the major offensive categories may keep some voters from considering him a first-ballot inductee.

______________________________________

Andruw Jones – (CF 1996-2012  … Sixth Year on the ballot, 19.4 percent last year.

Photo: Carl Fredrickson (Digi360) from Roswell, GA, USA, CC BY 2.0 <https://creativecommons.org/licenses/by/2.0>, via Wikimedia Commons

Andruw Jones played for the Braves (1996-2007), Dodgers (2008), Rangers (2009), White Sox (2010) and Yankees (2011-2012). In a 17-season career – primarily patrolling centerfield – he won ten Gold Gloves (consecutively, 1998-2007). At the plate, he hit .254, with 434 home runs (48th all-time), 1,289 RBI and 1,204 runs scored. He topped 25 home runs in ten seasons (six over thirty and a league-leading and career-high 51 in 2005). He scored 100 or more runs four times, drove in 100+ five times and stole twenty or more bases in a season four times.  Jones appeared in 76 post-season games, hitting .273, with ten home runs and 34 RBI.

On the Big Stage ,,,

In the 1996 World Series, Andruw Jones – just 19-years-old – hit .400 (8-for-20) with two home runs and six RBI, becoming the youngest player to go yard in the Fall Classic.

Andrew Jones’ Best Season: In 2005, Jones hit only .263, but led the NL in home runs (51) and RBI (128) – finishing second in the MVP voting to Albert Pujols (.330-41-117).

Jones’ ten Gold Gloves work in his favor, but – over the long haul – that .254 average (he only hit .300 or better once and over .270 only four times) dampen his HOF chances. Still that power and his defense get him Baseball Roundtable’s vote.

___________

Torii Hunter – (OF, 1997-2015) … Third Year on the Ballot year on the ballot.

Photo: Keith Allison, CC BY-SA 2.0 <https://creativecommons.org/licenses/by-sa/2.0>, via Wikimedia Commonshoto:

Okay, this may be a bit a a “homer” vote, since Torii Hunter was a star with my home team Twins – but it also reflects my special admiration for “leather and lumber” guys. Torii Hunter played 19 MLB seasons, suiting up for the Twins (1997-2007, 2015), Angels (2008-12) and Tigers 2013-14). He was a five-time All Star, and nine-time Gold Glover.

For his career, Hunter hit .277 (2,452 hits), with 353 home runs, 1,391 RBI, 1,296 runs scored and 195 stolen bases. He hit 20+ home runs in 11 seasons, drove in 100+ runs twice and stole 20+ bases in three campaigns. Hunter hit .274-4-20 in 48 post-season games. Hunter led his league in CF assists three times, CF putouts once and double plays turned out of CF four times. He also led his league’s right fielders in putouts, assists and double plays once each.

Spider-Man

Torii Hunter earned the nicknamed spider-man for his outstanding outfield play.

Torii Hunter’s Best Season:  In 2007 (Twins), Hunter hit .287, with 28 home runs, 107 RBI, 94 runs scored and 18 steals – although he can look back on at least four seasons with very similar numbers.

Nine Gold Gloves, five All Star selections and 353 home runs represent some pretty good credentials.   Hunter’s  chances to make the Hall would have bee better with a couple of standout/spectacular/memorable seasons mixed in with all those consistently very, very  good campaigns that fans came to expect.

___________________________________________

Andy Pettitte – (LHP/Starter, 1995-2010, 2012-13) … Fifth  year on the ballot, 10.7 percent last year.

Andy Pettitte - 19 career post-season wins.

Andy Pettitte – 19 career post-season wins.

As I’ve noted in past years, I had to think for a while on this one (and will probably get some push back from readers), largely because a major part of Andy Pettitte’s HOF resume was achieved in the post-season and there was some PED-controversey surrounding Pettitte.  (Note: Pettitte admitted to using HGH while recovering from elbow surgery – a couple of years before the substance was banned.  He took responsibility and apologized.)

Pettitte holds the MLB post-season marks for most wins (19 … versus 11 losses), innings pitched (276 2/3), games started (44) and is fourth in strikeouts (183). His post-season accomplishments include a 3.81 career ERA and the 2001 American League Championship Series MVP Award.

Pettitte also was no slouch in the regular season (Yankees – 1995-2003, 2007-2010, 2012-13) and Astros (2004-06).  He finished with 256 wins (153 losses) and a 3.85 ERA. His 256 wins currently rank 42nd all-time and his 521 starts 40th.  Pettitte won 20 games in two seasons and 14 or more games 12 times – leading the AL with 21 wins in 1996. The three-time All Star struck out 2,448 batters (46th all-time) in 2,316 innings.

Ready, Willing and Able …

Andy Pettitte started 30 or more games in a season 12 times, leading his league three times (1997, 2006, 2007).

Pettitte’s post-season numbers, plus 256 regular-season victories and the fact that he had 100+ more career wins than losses secure BBRT’s vote. He has a long way to go with the BBWAA voters, however, never having gotten more than 13.7 percent of the vote.

Andy Pettitte’s Best Season: In 1997, following a 21-8 campaign in 1996, Pettitte went 18-7, with a 2.88 ERA (fourth-best in the AL), leading the league in starts with 35, finishing third in innings pitched (240 1/3) and eighth in strikeouts (166).

__________

THE REST OF THE SLATE 

So, with BBRT’s unofficial ballot covered, let’s look at the remainder of candidates – in alphabetical order.  Note: Here you will find a host of players with solid (but perhaps not HOF-level) career numbers and accomplishments – as well as a few that remain on the sidelines for other reasons.

Bobby Abreu – (OF, 1996-2012, 2014) … Fourth Year on the Ballot, 8.6 percent one year ago.

A solid .291 career hitter (2,470 base hits), Abreu hit .300 or better in six seasons. He hit 20 or more round trippers in 10 campaigns, stole 20 or more bases 12 times (a high of 40 in 2004), drove in 100 or more runs eight times and scored at least 100 runs eight times.   Abreu also walked 1,476 times – including 100 or more free passes in eight straight seasons (1999-2006).

In the Top 50 … 

Bobby Abreu’s 1,476 walks are 20th all-time; his 574 doubles are 25th; his 3,733 putouts as a RF are 12th; and his 130 assists as a RF 28th. 

Abreu played for the Astros (1996-97, Phillies (1999-2006), Yankees (2006-2008), Angels (2009-1012), Dodgers (2012) and Mets (2014).

In 20 post-season games, Abreu went 19-for-67 (.284), with one home runs and nine RBI.

Bobby Abreu’s Best Season: In 2004, as a Phillie, Abreu hit .301, with 30 home runs and 40 steals. An All Star that season, he also drove in 105 runs and scored 118.

Abreu’s 400 steals are an HOF plus, as are his 30-40 season in 2004 and his eight campaigns with 100 or more RBI.  Had he reached 300 home runs; it would have really boosted his status with the writers.  He’s also hurt by the fact that he only made two All Star teams in his 18 seasons.

_____________________

Bronson Arroy0 –  (RHP, 2000-2014, 2017)  – First Year on the Ballot.

Bronson Arroyo pitched in 16 MLB seasons – Pirates (2000-02), Red Sox (2003-05), Reds (2006-13, 2017) and Diamondbacks (2014).  Arroyo went 148-137, 4.28 over his career – 419 games, 383 starts, 16 complete games.  He won ten or more games in eight seasons and 14 or more six, with a high of 17 in 2010. He was a one-time All Star and one-time Gold Glover.  Arroyo led the NL in  innings pitched once, shutouts once and games started twice, He started 30 or more games in nine straight seasons (2005-13).

In 2005, The Bronson Arroyo Band released the Album Covering the Bases – featuring covers of a dozen rock songs by groups from the Goo Goo Dolls to Pearl Jam to Stoner Temple Pilots.

Bronson Arroyo’s Best Season: In 2020, Arroyo went 17-10, 3.88 in 33 starts.

_______________________________________

Mark Buehrle – (LHP, 2000-15) …. Third year on the ballot, 5.8 percent one year ago. 

Mark Buehrle pitched in 15 MLB campaigns – White Sox (2000-11), Marlins (2012), Blue Jays (2013-15) – and threw 200 or more innings in all but his rookie and final seasons. Buehrle was a five-time All Star and put up a 214-160, 3.81 record, with 1,870 strikeouts in 3,283 1/3 innings. He twice led his league in starts and twice topped his league in innings pitched. He won ten or more games in 15 consecutive seasons and six times won 15 or more.  Buehrle also  earned four Gold Glove Awards.

Near-Perfect and Perfect

Mark Buehrle’s HOF resume is bolstered by a no-hitter tossed on April 18, 2007 – when his White Sox topped the Rangers 7-0 and Buehrle faced the minimum 27 batters.  The only Texas’ base runner came on a fifth inning, one-out walk to Sammy Sosa, whom Buehrle then picked off first base.  Buehrle notched eight strikeouts in the game, which was so-o-o very close to a “perfecto.”

Buehrle got his perfect game two years later (July 23, m 2009), when he recorded a clean slate in a 5-0 ChiSox win over the Rays.  He fanned six in that one.

Mark Buehrle’s Best Season:  In 2005, Buehrle went 16-8, 3.12 for the White Sox.

If he had 250 wins to go with the no-hitter, perfect game and four Gold Gloves, Buehrle would have had my vote.  With just 214 wins, no Cy Young Award and no 20-win season, Buehrle appears short of what voters are looking for. He dropped from 11 percent his first year on the ballot to 5.8 percent in year two.

__________

Matt Cain –  (RHP, 2005-17) –  First Year on the Ballot.

Matt Cain played 13 MLB seasons (2005-17), all for the Giants. The three-time All Star went 104-118, 3.68 in 342 games (331 starts). He won 12 or more games in five seasons and led the NL  in complete games with four in 2009.

On June 13, 2012, Matt Cain threw a perfect game as his Giants topped the Houston Astros 10-0.  Cain threw 125 pitches (86 strikes), fanning 14. He reached a three-ball count on only four batters in the gem. 

Cain won twelve or more games in five seasons (a high of 16 in 2012). He led the NL with 34 starts in 2008.

Matt Cain’s Best Season:  In 2012, Matt Cain went 16-5, 2.79 in 32 starts. He fanned a career-high 193 batters (219 1/3 innings).

________________________________

R.A. Dickey – (RHP, 2001-17) – First Year on the Ballot.

R.A. Dickey pitched in 15 MLB seasons (2001, 2003-06, 2008-17 … Rangers, Mariners, Twins, Mets, Blue Jays, Braves).   He went 120-118, 4.04 in 400 games (300 starts). Dickey was a one-time twenty-game winner and won at least ten games in seven seasons. He was a one-time All Star, the 2012 NL Cy Young Award Winner and a one-time Gold Glover.

R.A. Dickey was the first primarily knuckleball pitcher the Cy Young Award.

R.A. Dickey’s Best Season: In 2012, Dickey went 20-6, 2.73 for the Mets – leading the NL in starts (33), complete  games (5), shutouts (3); innings pitched (233 2/3); and strikeouts (230). He was an All Star and the NL Cy Young Award winner.

_____________________________________

Jacob Ellsbury – (OF, 2007-2017) – First Year on the Ballot.

Jacob Ellsbury played 11 MLB seasons (2007-17 … Red Sox, Yankees).   He was a center fielder with good speed and a good glove – winning one Gold Glove and leading the AL in steals three times, triples once and total bases once.  His final stat line was .284-104-512, with 749 runs scored and 343 steals (in 1,235 gamers).

Ellsbury stole 30 or more bases in five seasons (a high of 70 in 2009), scored 90+ runs in four seasons (a high of 119 in 2011) and drove in 100+ runs once.  In 2001, Ellsbury hit a career-high 32 home runs – the  only season in which he exceeded 16 roundtrippers. The one-time All Star hit .280 in 45 post-season contests (27 runs scored, 17 RBI, 11 steals).

In 2011, Jacob Ellsbury handled 394 fielding chances (154 games) without an error. He also had error-free seasons of more tan 100 games in 2008 (140 games) and 2015 (110 games). The most games played  in a single season without an error by an outfielder is 162 (Juan Pierre, White Sox, 2006).

Jacob Ellsbury’s Best Season: In 2011, Jacob Ellsbury joined the 30-30 club – hitting.321, with 32 home runs and 39 stolen bases.  That season – his only All star campaign – he set his career-highs in RBI (105),  runs (119), hits (212), batting average (.321) doubles (46) home runs (32) and total bases (a league-leading 364). He also won a Gold Glove.

_____________________________________

Andre Ethier – (OF, 2006-17) – First Year on the Ballot.

Andre Ethier played 12 MLB seasons (2006-17), all for the Dodgers. He was a career .285 hitter, with 162 home runs and 687 RBI (in 1,455 games). Ethier was a two-time All Star (2010-11) and one-time Gold Glover.   He hit 20 or more home runs in four seasons, with a high of 31 in 2009.  He also drove in 100+ runs once, also in 2009.  Ethier hit .300+ in two seasons, including .308 in his rookie campaign.  He also recorded 30 ore more doubles in seven seasons. Ethier played in 51 post-season games, hitting .246, with five homers and 11 RBI.

After being held hitless in the second game of the 2011 season, Andre Ethier embarked on a 30-game hitting streak  (April 2 through May )  – during which he hit .397-3-17.  The streak included 11 multi-hit games.

Andre Ethier’s Best Season:  Ethier’s best season was 2009, when he hit .272 and reached what would be his career highs in home runs (31), RBI (106), runs scored (92), doubles (42), hits (162), and total bases (303).

_________________________________

J.J. Hardy – (Shortstop, 2006-17) – First Year on the Ballot.

J.J. Hardy played in 13 MLB seasons (2005-17 … Brewers, Twins, Orioles).  Hardy was a two-time All Star and a three-time Gold Glover.  His final MLB stat line (1,561 games) was .256-188-688, with 718 runs scored. Hardy hit 20+ home runs in five seasons, with a high of 30 for the 2011 Orioles. While he never reached 100 RBI, he did top 75 in four seasons.

J.J. Hardy’s Best Season: Hardy’s best season was 2007 (Brewers), when he was an All Star and hit .277 (his second-highest single-season average), popped 26 home runs (also second highest in his career), drove in a career-high 80 tallies, scored a career-high 89 times and also had a career-high 164 hits.

_________________

John Lackey – (RHP, 2002-17) – First Year on the Ballot.

John Lackey pitched in 15 MLB seasons (2002-11, 2013-17 … Angels, Red Sox, Cardinals, Cubs).  He missed the 2012 season recovering from Tommy John surgery. Lackey went 188-147, 3.92 in 448 games (466 starts/18 complete games, eight shutouts.) He fanned 2,294 batters in 2,840 1/3 innings.

Lackey was a one-time All Star and logged at least ten wins in every one of his MLB seasons except his rookie year, when he was 9-4, 3.66 after a late-June MLB debut. Lackey led the AL in shutouts three times (with two each time).  His chances for the Hall are dimmed by the the fact that he only recorded at least 15 or more wins in just one season.

John Lackey was 8-6, 3.44 in 29 post-season games. He won the clinching Game Seven in the 2002 World Series (Angels over Giants) and and the title-clinching Game Six in the 2013 World Series (Red Sox over Cardinals).

John Lackey’s Best Season:  In 2007, his lone All Star season, Lackey was 19-9 (a career-high in wins). He led the AL in earned run average (3.01), and shutouts (2). He started 33 games and fanned 179 batters in 219 innings.

_______________________________________

Mike Napoli – (C/1B , 2006-16) – First Year on the Ballot.

Mike Napoli played 12 MLB seasons (2006-17 … Angels, Rangers, Red Sox, Indians). He hit .246-267-744, with 697 run scored in 1,392 games. The one-time All Star topped 20 home runs in eight seasons (a high of 30 in 2011) and had 100+ RBI in one campaign.

In Mike Napoli’s first MLB at bat (May 4, 2006), he hit a home runs (leading off the third inning for the Angels) on a 1-2 pitch from Tigers’ starter Justin Verlander. That season, Verlander went 17-9, 3.63 and was the American League Rookie of the Year. Napoli went .228-16-42 in 99 games, 

Mike Napoli’s Best Season:  In 2011 (for the Rangers), Napoli hit .320, with 30 home runs and 75 RBI (in 113 games). It was his only 30-home season and the only season in which he hit .300 or better.

___________________________________

Jhonny Peralta –  (SS/3B, 2003-17) – First Year on the Ballot.

Jhonny Peralta played in 15 MLB seasons (2003-2017 … Indians, Tigers, Cardinals). He was a three-time All Star and hit .267-202-873, with 841 runs scored (in 1,798 games).

Jhonny Peralta made his first All Star team in his ninth MLB season.

Peralta hit 20+ home runs four times, had 75 or more RBI six times and hit .290 or better  three times (a high of .303 in 2013).

Jhonny Peralta’s Best Season: In 2011, Jhonny Peralta hit .299, with 21 home runs and 86 RBI for the Tigers.

___________________________________

Alex Rodriguez – (SS/3B, 1994-2013, 2015-16) … Second  year on the ballot, 34.3 percent last year. 

Alex Rodriguez played 2,784 games over 22 MLB seasons.  He hit .295, with 3,115 hits (22nd all-time); 2,021 runs scored (eighth); 696 home runs (fifth) and 2,086 RBI (fourth).  He is also among MLB’s top 50 in total bases (seventh); doubles (33rd); walks (36th); and extra-base hits (seventh).

Rodriguez was a three-time league MVP, 14-time All Star and two-time Gold Glover.  He led his league in home runs five times and hit 30 or more long balls 14 times (with a high of 57 in 2002). He led his league in runs scored five times (with 100 or more in 13 seasons); led the league in RBI twice, (with 100 or more in 14 seasons and a high of 156 in 2007).  He also led the league in hits once; doubles once; average once (.358 in 1996); and total bases four times.

Rodriguez played for the Mariners (1994-2000). Rangers (2001-2003); and Yankees (2004-13 & 2014–16).

Alex Rodriguez’ Best Season:  So many to choose from here. Let’s go with his 2007 MVP season (Yankees), when he hit .314; led MLB in runs scored (143), home runs (54) and  RBI (156); and led the AL in slugging percentage (.645) and total bases (376).

A-Rod’s numbers belong in the Hall, but I think his 2014 full-year PED-related suspension will keep him on the outside looking in for now.  When the PED dam finally cracks (most likely  first through Era Committee voting), Rodriguez should find his way intro the Hall.  Right now, he has eight years for the voters to change their minds.

____________________________________

Jimmy Rollins – (SS, 2000-2016) … Second year on the ballot, 9.4 percent one year ago.  

Jimmy Rollins was a three-time All Star, four-time Gold Glover and the 2007 NL MVP.  Over a 17-season MLB career, he hit .264-231-936, with 2,455 hits (115th all-time), 470 steals (46th) and 1,421 runs scored (88th). He led the league in triples four times (topping double-digits in five seasons) and stolen bases  once (reaching 30 or more in ten seasons). He also led the NL in runs scored once, and scored 100 or more runs in six campaigns. He ranks 46th all-time in putouts at shortstop, 20th in assists and 12th in double plays. He was truly an “everyday” player, appearing in 150 or more games in ten seasons.

Jimmy Rollins is one of only four MLB players with a 20-20-20-20 season (at least 20 doubles, 20 triples, 20 home runs and 20 steals). See his 2007 “best season” below for details. The others are Curtis Granderson (2007), Willie Mays (1957) and Frank Schulte (1911). 

Rollins played for the Philllies (2000-2014); Dodgers (2015); and White Sox (2016).

Jimmy Rollins’ Best Season:  In his 2007 MVP season, he hit .296 – with  212 hits, 38 doubles, a league-leading 20 triples, 30 home runs, 94 RBI, a league-leading 139 runs scored and 41 steals.

Rollins’ .264 average and the fact that he made only three All Star squads are negatives for the long haul in balloting.  That 20-20-20-20 season, his  four Gold Gloves,  470 steals and 1,400+ runs scored should be enough to keep him on the ballot for some time going forward.

____________________________________

Gary Sheffield … (Outfield/Designated Hitter/Third Base/Shortstop, 1988-2009) … Ninth  year on the ballot, 40.6 percent last year.

Gary Sheffield played for the Brewers (1988-1991), Padres (1992-1993), Marlins (1993-19998), Dodgers (1998-2001), Braves (2002-2003), Yankees (2004-2006), Tigers (2008) and Mets (2009).  Sheffield was a nine-time All Star (in 22 MLB seasons). He launched 509 career home runs (26th all-time) and topped 30 home runs in a season eight times (a high of 43 in 2000). He also maintained a .292 career average (hit .300+ in eight seasons); and collected 1,676 RBI (30th all-time).  Sheffield won the 1992 NL batting title (.330); topped 100 RBI eight times; and scored 100 or more runs in a season seven times.

Gary Sheffield is one of only four players to hit MLB home runs as teenagers and in their 40’s. The others are Ty Cobb, Rusty Staub and Alex Rodriguez.

Gary Sheffield’s Best Season: In 1996 (Marlins), Sheffield hit .314, with 42 home runs, 120 RBI, 188 runs scored and 16 steals.

Sheffield has the offensive numbers, but defensive questions and the shadow of PEDs are likely to keep him on the outside looking in for now.  He did jump from 13.6 percent of the vote in three years ago to 40.6 percent last year – so that’s progress.

___________________________________

Huston Street – (RHP, 2005-17) – First Year on the Ballot.

Huston Street played in 13 MB seasons (2005-17 … A’s, Rockies, Padres, Angels). Street put up a 42-34 record with a 2.95 earned run average and 324 saves in 668 appearances (all in relief). While he never led the league in saves, he saved 20 or more games in ten seasons (forty or more in two of those).  Street was a two-time All Star and the 2005 American League Rookie of the Year, when he went 5-1, 1.72 with 23 saves in 53 appearances for the A’s (as a 21-year-old).

Huston Street’s Best Season: Ironically, Street was trade in the middle of his best season. going from the Padres to the Angels on July 19, 2014.  Street was 1-0, 1.09 with 24 saves for the Padres at the time of the trade.  He then went 1-2, 1.171 with 17 saves for the Angels – helping them to make the 2014 post  season. On the season, he was 202, 1.37, with a career-high 41 saves.

Until BBWAA members vote in those relievers with 400+ saves, Street will have to wait.

_______________

Omar Vizquel – (Shortstop/Third Base, 1989-2012) … Fourth year on the ballot, 23.9 percent last year.

Photo by Keith Allison

Photo by Keith Allison

Omar Vizquel got off to a good start toward a HOF plaque, grabbing 37 percent support on his first-ballot year, moving up to 42.8 percent in his second year and 52.6 in his third shot.  However, the two most recent ballots have dampened his outlook (he received just 23.9 percent in last year’s voting), perhaps related to off-field concerns .  Vizquel who won 11 Gold Gloves, also  finished his 24-season MLB career just 123 hits short of that milestone 3,000 safeties.

Vizquel delivered premier defense to the Mariners (1989-1993), Indians (1994-2004), Giants (2005-2008), Rangers (2009), White Sox (2010-2011) and Blue Jays (2012). He was a three-time All Star – and put together a string of nine straight Gold Gloves at shortstop (1993-2001).

Sacrificing for the Team

Omar Vizquel led his league in sacrifice bunts four times.

In the field, Vizquel has the highest career fielding percentage (.9847) among shortstops with at least 500 games at the position.  Vizquel is also the all-time leader among shortstops in double plays (1,734), ranks third at the position for career assists and 11th in putouts. He shares the record (with Cal Ripken, Jr.) for the fewest errors by a shortstop in a season of at least 150 games played (three).

On offense, Vizquel put up a serviceable .272 career average, with 80 home runs, 951 RBI and 1,445 runs scored. He also swiped 404 bases – topping twenty steals eight times (a high of 42 in 1999).

Omar Vizquel’s Best Season: In 1999, with the Indians, Vizquel hit a surprising .333, with five home runs, 66 RBI, 112 runs scored and 42 stolen bases – and, of course, won a Gold Glove at shortstop.

As noted,Vizquel’s chances for the Hall have been dampened by off-field issues.  (I’ll let readers look those up.)

__________

Jered Weaver – (RHP, 2008-17) – First Year on the Ballot.

Jered Weaver went 150-98, 3.63 in 12 MLB seasons (2006-2017 … Angels, Padres; all but the final season for the Angels). He made 331 appearances (all starts), and had 14 complete games and eight shutouts.  Weaver was a three-time All Star and led the American League in wins twice, games started twice and strikeouts once. He won 15 or more games in four season and ten or more a total of ten times.

Jered Weaver finished in the top five in AL Cy Young Award voting in three consecutive seasons (2010-12).

Jered Weaver’s Best Season:  In 2012, Weaver led the AL in wins with 20 (nine losses) and put up a 2.81 ERA in 30 starts.

Jered Weaver pitched a no-hitter on May 2, 21012 , as the Angels topped the Twins 9-0. Weaver walked one and fanned nine in the contest.

___________

Jason Werth – (OF, 2002-2017) –  First Year on the Ballot.

Jason Werth played 15 MLB seasons (2002-05, 2007-17 … Blue Jays, Dodgers, Phillies, Nationals). He hit .267, with 229 home runs, 888 runs scored and 132 steals in 1,583 games.  Werth hit 20 or more home runs in five seasons (a high of 36 in 2009). The one-time All Star also hit 20 or more doubles eight times, leading the league with 46 in 2010.  Werth also had 15 post-season homers, to go with a .251 average in 63 post-season games. He scored over 100 runs in one season and hit .290 or better in five.

Jason Werth’s Best Season: In 2009,Jason Werth hit .268 for the Phillies and set career-highs in home runs (36) and RBI (99).

Again, to access Baseball Roundtable’s unofficial Hall of Fame Fan Ballot, click here.

Primary Resources: National Baseball Hall of Fame; Baseball-Reference.com; Baseball-Almanac.com. MLB.com.

100Baseball Roundtable is on the Feedspot list of the Top 100 Baseball Blogs.  To see the full list, click here.

I tweet (on X) baseball @DavidBaseballRT

Follow Baseball Roundtable’s Facebook Page here.  More baseball commentary; blog post notifications.

Member: Society for American Baseball Research (SABR); Negro Leagues Baseball Museum; The Baseball Reliquary. 

Who’s Your Daddy? … Edition Seventeen … Carl Hubbell

Who’s Your Daddy – A Baseball Roundtable Series

Welcome to  the 17th post  in the Baseball Roundtable’s “Who’s Your Daddy?” series, where we take a look at Roundtable-selected lineups that performed exceptionally well against some of MLB’s greatest pitchers ever.

Photo: Play Ball cards, published by Bowman Gum, Public domain, via Wikimedia Commons

As always, I would stress that the pitchers included in the Who’s Your Daddy? series are among the “best in the business.”  They are selected not because of the players who performed well against them, but rather because success among hitters when they were on the mound was the exception rather than the rule.  We’ve looked at pitchers from a wide range of eras – from Bob Feller to Nolan Ryan to Justin Verlander.  This time, we’re going back to Hall of Famer Carl Hubbell, who took the mound for the New York Giants from 1928 to 1943.


___________________________

Before we get started on this edition,  here are links to the previous editions of this series. Please note: For still active pitchers, the stats are as they stood on the date of the post.

  • Nolan Ryan, click here.
  • Sandy Koufax, click here.
  • Pedro Martinez, click here.
  • Bob Gibson, click here.
  • Randy Johnson, click here.
  • Greg Maddux, click here.
  • Justin Verlander, click here.
  • Bob Feller, click here.
  • Roger Clemens, click here.
  • Max Scherzer, click here.
  • Tom Seaver, click here.
  • Mariano Rivera, click here.
  • Warren Spahn, click here.
  • Lefty Grove, click here.
  • Steve Carlton, click here.
  • Robin Roberts, click here.

If you go back through past editions of “Who’s Your Daddy?”, you may find a few surprises – like how Will Clark owned Nolan Ryan, Jerry Lynch‘s .714 average versus Sandy Koufax or Junior Spivey‘s six hits, one walk and one HBP in his first seven plate appearances versus Greg Maddux. There are a handful  of surprises in the Hubbell addition as well, like:

  • While Hubbell led the National League in strikeouts-to-walks ratio five times (each time fanning more than three times as many as he walked) and was in the top five a total of ten times, Billy Herman walked 19 times (versus nine whiffs) in his career against Hubbell;
  • Ernie Lombardi fanned just four times in 126 plate appearance versus Hubbell;
  • Hank Lieber – a .288 career hitter – was Hubbell’s teammate on the Giants in seven of Lieber’s ten MLB seasons. Lieber hit .458 versus Hubbell in the three seasons he faced him and, if you take out his at bats versus Hubbell, Lieber’s career average would be seven points lower.
  • Lefty O’Doul – who hit .357 against Hubbell – faced nine Hall of Fame pitchers in his career and hit .375 against them.

Before getting into the lineup (and more tidbits), let’s look at why Carl Hubbell is a solid choice for this series.

Hubbell, known for his darting and baffling screwball, pitched in the major leagues for 16 seasons (1928-43) – all with the New York Giants. He made it to the major leagues – at the age of 25 – in July of 1928, in the middle of his fifth professional season. At the time, the 6’/170-pound southpaw was 12-9, 2.97 for the Class-A Beaumont Explorers.  Hubbell’s progress while in the Tiger’s system was reportedly stymied  by the belief that relying on the screwball (a “reverse-curve” that, at the time, was  termed a fade-away) would be too hard on his arm to be sustained for any significant period of time.   The Tigers sold Hubbell to Beaumont before the 1928 season, where – now set free to use his screwball extensively –  he was spotted by a New York Giants’ scout.   His contract was purchased by the Giants, he was quickly brought to the major-leagues and the rest, as they say, is history.

Hubbell pitched for the Giants for 16-seasons and earned the nicknames “King Carl” and “The Meal Ticket” – a well as a ticket to the Baseball Hall of Fame.  Over that span, Hubbell was a nine-time All-Star, five-time 20-game winner and  led the NL in earned run average three times, complete games once, innings pitched once, strikeouts once and strikeout-to-walk ratio five times.  He was also selected as the National League’s Most Valuable Player twice (1933 & 1936).

Hubbell pitched in five All Star Games, putting up a 2.79 ERA and fanning 11 batters in 9 2/3 innings. He also started six World Series games, going 4-2, 1.79, with four complete games.  In the 1933 World Series, he started twice and pitched and won  two complete games (one an 11-inning contest),  giving up no earned runs (three unearned).

Carl Hubbell Makes All Star Game History

In the 1934 All Star Game (just the second AL/NL All Star Game), Carl Hubbell struck out six batters to set a single-game All Star record that has since been matched, but remains unbroken.  And, Hubbell did it in grand – even legendary – fashion, fanning five future Hall of Famers in a row.  After starting the game by giving up a single to AL 2B Charlie Gehringer and a walk to LF Heinie Manush, Hubbell  fanned RF Babe Ruth, 1B Lou Gehrig and 3B Jimmie Foxx to get out of the inning. He then opened the second frame by fanning CF Al Simmons and SS Joe Cronin.  After a Bill Dickey single, Hubbell fanned a sixth future Hall of Famer (pitcher Lefty Gomez).

How did those five future Hall of Fame position players do after Hubbell left the game? They went a combined seven-for-fifteen (four doubles), with two walks, six runs scored and four RBI.

So, there’s a look at King Carl, now let’s take a look at his Who’s Your Daddy? lineup.  You should note that I evaluate these players not just on pure stats, but also on when those statistics were achieved (Hubbell for example was a much more dominant pitcher from 1928-1937 -winning an average of 19 games per season – then from 1938-43 (with an average of ten wins per season). And, as you saw in the earlier chart, he was particularly dominant from 1933-37.  Here are the statistical leaders:

Why’d We Trade This Guy?

Outfielder Hank Lieber was a teammate of Hubbell’s on the Giants from 1933-38 –  before being traded to the Cubs – and a teammate of Hubbell’s again in 1942 (after the Cubs traded him back to the Giants). While a Cub, Lieber faced Hubbell 26 times in seven games over three seasons.  He collected 11 hits against Hubbell, including a double and three home runs. Among players with at least 20 at bats versus King Carl, Lieber had the highest batting average, highest on-base percentage; and highest slugging percentage. So, why didn’t he make the final “Who’s Your Daddy?” lineup – mainly because he did all this damage from 1939-1941, when Hubbell was 33-30, 3.36. Still Lieber deserves a shout out in this post. Lieber, by the way, was a pretty good ballplayer. In ten MLB seasons, he went .288-101-518 (813 games) and was a three-time All Star.

_______________________________________

Now for the lineup.

Catcher – Ernie Lombardi

Photo: Cincinnati Reds – 1940 Team Issue, Public domain, via Wikimedia Commons

Hall of Famer Ernie Lombardi faced Carl Hubbell in 42 games between 1931 and 1942, reaching him for a .331 average (25 points above Lombardi’s career average), with six homers (second-most against Hubbell by any batter) and 18 RBI (ninth-most). His 40 base hits were also the ninth-most against King Carl.  In 1939, a season in which Hubbell went 11-9, 2.75, Lombardi went five-for-eight against him, with a double, a home run and five RBI in three games. Lombardi hit .400 or better versus Hubbell in five of the 11 seasons he faced him.

_________________________________

Ernie Lombardi caught both of Johnny Vander Meer’s consecutive no-hitters (June 11 & 15, 1938).

_______________________________

Ernie Lombardi struck out in his first plate appearance versus Carl Hubbell (April 27, 1931). He then went sixty-seven plates appearance against him before fanning again (July 26, 1936). In 126 career plate appearances  versus Hubbell, Lombardi fanned just four times.

Lombardi played 17 MLB seasons (1931-47 … Robins, Reds, Braves, Giants). He was an eight-time All Star, the 1938 National League MVP and won two batting titles. Lombardi hit .300+ in ten seasons and under .280 just twice. Lombardi’s final stat line was .306-189, 890.

Note: I also looked at Al Todd, who hit .325-4-11 versus Hubbell over 32 games – but drew zero walks, while fanning 14 times. Todd played 11 MLB seasons (1932-41, 1943) and hit .276-35-366 in 863 games.

____________________________________________

First Base – Dolph Camilli

Photo: Goudey, Public domain, via Wikimedia Commons

While Dolph Camilli hit just .279 ( about equal to his career .277 average) versus Hubbell (in 46 games), His 11 home runs versus Hubbell are far-and-away the most of any batter (the next highest is six) and his 25 RBI are second all-time against Hubbell. Note: Camilla’s 11 round  trippers versus Hubbell are also  the most Camilli hit against any pitcher.

__________________________________

After two seasons facing Hubbell (1933-34), Dolph Camilli was just 2-for-25 (.080), with no walks and six strikeouts versus The Meal Ticket. Then in 1935 – when Hubbell went 23-12, 3.27 – Camilli seem to figure something out, going 11-for-23 (.478) against Hubbell, with three home runs and six RBI (in seven games). Between 1935 and 1942, Camilla hit .400 or better against Hubbell in four seasons.

________________________________________

Camilli played 12 MLB seasons (1933-43, 1945 … Cubs, Phillies, Dodgers, Red Sox). He was a two-time All Star and, with the Dodgers in 1941, led the NL in home runs (34) and RBI (120), while hitting .285 and capturing the National League MVP Award. His final stat line was .277-239-950. He hit 20 or more home runs in eight seasons and drove in 100 or more runs in five.

Note: At first base, I also looked at Gus Suhr, who drove in 29 regular-season runs versus Hubbell (the most of any hitter). Suhr, however, hit only .255, with just two home runs against Hubbell. Suhr was a career .279-84-818 hitter (11 seasons … 1930-40).

_____________________________________________

Second Base – Billy Herman

Photo: Goudey, Public domain, via Wikimedia Commons

Billy Herman (a career.304 hitter) hit  .327, with a .399  on-base percentage in 53 games versus Carl Hubbell (1931-42). He hit .400 or better in four seasons against him and was particularly effective against Hubbell’s vaunted screwball in 1935 (when Hubbell went 23-12, 3.27). That season, Herman torched Hubbell for a .550 average (11-for-20), with three home runs and eight RBI in six games.

Hall of Famer Herman played 15 MLB seasons (1931-43, 1945-47 … Cubs, Dodgers, Braves, Pirates), hitting .304-47-839, with 1,163 runs scored. He was a ten-time All Star, and led his league in hits once, doubles once and triples once. Herman hit .325 or higher in five seasons and finished in the top-five in the MVP voting three times. His best season was with the  1935 Cubs, when he hit .341-7-83, scored 113 runs and led the league with 222 hits. 57 doubles and 24 sacrifice bunts.

Let’s Get This Party Started

Billy Herman shares the record(s) for the most base hits and most extra-base hits in an Opening Day game. On the Cubs’ Opening Day in 1936 (April 16 in St. Louis), Herman collected five hits (three doubles, a home run and a single) in five at bats, as the Cubs pounded the Redbirds 12-7.   

Note: I also looked at Pete Coscarart at second base. Although he faced Carl Hubbell late in Hubbell’s career, the Dodgers’ 2B-SS got off to a good start against King Carl.  In his first six plate appearances against Hubbell, Coscarart went single, single, single, strikeout, hit-by-pitch, single. In 14 games against Hubbell (1939-43), Coscarart (a career .243 hitter), hit .412 (14-for-34). In, putting Herman ahead of Coscarart, I considered Coscarart faced Hubbell over the final five years of Hubbell’s career and his 14 hits produced just one RBI (in eight games).

________________________________________

Third Base –  Tie:  Pepper Martin & Les Bell

Pepper Martin – Cardinals’ spark plug Pepper Martin started against Carl Hubbell in LF, CF, RF and 3B – and makes it here at third base because he started more games (against Hubbell) there than at any other position.  Martin’s 43 hits were the fifth-most against Hubbell, his eight doubles also fifth, his three triples tied for third, his four home runs tied for sixth and his 21 RBI tied for sixth. A career .298 hitter, Martin hit .327 versus Hubbell.

________________

Pepper Martin had five singles (and a strikeout) in his first six plate appearances versus Carl Hubbell.

__________________

Martin played 13 MLB seasons (1928, 1930-40, 1944), all for the Cardinals. He hit .298-59-501, with 146 steals and 756 runs scored in 1,189 games. He was a four-time All Star and led the NL in stolen bases three times.  Martin hit .300 or better in six campaigns and scored 100+ runs three times (each time surpassing 120 runs scored). He played in 100 or more games in just five of his 13 MLB seasons.

Photo: Exhibits, Public domain, via Wikimedia Commons

Les Bell  – Les Bell hit .385, with one home run and eight RBI in  11 games against Hubbell (1928-31) – including a pinch-hit Grand slam on May 26, 1929. His .429 on-base percentage against Hubbell was the seventh-best among player with at least 25 plate appearances against The Meal Ticket.  Bell played in nine MLB seasons (1923-31 … Cardinals, Braves, Cubs), hitting .290-86-509 in 896 games. His best season was 1926, when he hit .325-17-100, for the Cardinals and finished sixth in the MVP voting.

_____________________________________

Shortstop – Arky Vaughn

Photo: Goudey, via Wikimedia Commons

Arky Vaughn had 52 hits in 54 games against Carl Hubbell (the second-most regular season safeties of any player).  His four home runs tie for the sixth-most and his 16 RBI tie for fourteenth.  Vaughn hit ,333 or better in five of the 11 seasons he faced Hubbell and he was particularly effective in 1937 (when Hubbell went 22-8, 3.20 and Vaughn hit .444, with two home runs against him in five games).

Vaughn played 14 MLB seasons (1932-43, 1947-48 … Pirates, Dodgers).  The nine-time All Star hit .318-96-926, with 1,173 runs scored. He led the NL in runs scored three times, triples three times, steals once, batting average once and walks three times.

.300 … That’s a Nice Round Number

Arky Vaughn his .300 or better  in each of his his first ten MLB seasons and in 12 of his 14 MLB campaigns. 

____________________________________________

Outfield – Lefty O’Doul

Photo: Goudey, Public Domain via Wikimedia Commons

Lefty O’Doul hit .357 against Carl Hubbell in 25 games, with five home runs (fifth-most against Hubbell) and 17 RBI (tied for tenth most). Surprisingly, O’Doul started his career as a pitcher. In fact, in 1921 – at the age of  24 – he went 25-9, 2.39 (pitching in 47 games) for the Pacific Coast League San Francisco Seals and, in 1924, he appeared on the mound in 23 games for the Red Sox.  Note: This does not mean his bat was silent.  In that 25-win season for the Seals, he also hit .338 (in 74 games).  Ultimately, a sore arm led him off the mound and to a career .349 MLB average.

In 1929, Left O’Doul hit .520 (13 for 25) with three home runs and seven RBI against Carl Hubbell (in six games).

O’Doul played 11 MLB seasons (1919-20, 1922-23 and 1928-34 … Yankees, Red Sox, Giants, Phillies, Dodgers). He was a career .349 hitter and twice led the NL in average (.398 in 1929 for the Phillies and .368 in 1932 for the Dodgers). O’Doul’s career stat line was .349-113-542 (in 970 games).

Lefty O’Doul Liked to Face the Best

Available stats show that in 360 at bats against nine Hall of Fame pitchers, O’Doul hit .375, with 16 home runs and 70 RBI (with 37 walks versus just 16 strikeouts).

_________________________________________

Outfield – Hack Wilson

Photo: Conlon, Charles Martin, 1868-1945 (Photographer), Public domain, via Wikimedia Commons

Hack Wilson hit .351 against Carl Hubbell in 33 games. His four home runs is tied for the sixth-most against Hubbell, his 17 RBI tied for tenth, his .427 on-base percentage tenth and his .575 slugging percentage eleventh. Wilson also drew 14 walks against Hubbell, the third-most of any player. Wilson hit .333 or better in six of the seven seasons he faced Hubbell (1928-34). Of note, in the one season he failed to it at least .333 against King Carl, Hubbell held Wilson  hitless in ten at bats.

In 1933, when Hubbell went 23-12, with an MLB-low 1.66 earned run average, Wilson hit .476 against him in seven games.

_________________

Hack Wilson holds the single-season MLB record for RBI. He put up a .356-56-191 line for the 1930 Cubs. 

_____________________

A Hall of Famer, Wilson played 12 MLB seasons (1923-34 … Giants, Cubs, Dodgers, Phillies). He led the NL in home runs four times – a high of 56 in 1930 – RBI twice and walks twice. He hit over .300 in five seasons and his career stat line was .307-244-1.063.

____________________________________________

Outfield  – Tie …. Joe Medwick and Ival Goodall

For the third outfield spot, we have a tie between a name you’ve heard a lot – and another you might not be familiar with.  I’d add that filling this final spot was no easy call.

Photo: St Louis Cardinals / MLB, Public domain, via Wikimedia Commons

Joe Medwick … Joe “Ducky” Medwick hit .313 versus Hubbell in  47 games.  His 50 hits versus King Carl are tied for fourth-most all-time, his six home runs tied for second, his nine doubles tied for third and his 22 RBI are fourth,  So, why was this a difficult call?  (This should provide more insight into how  I select these lineups.)

  1. Medwick’s .313 average was below his ,324 career mark.
  2. His on-base percentage (.325) against Hubbell  was only 12 points above his average.
  3. Medwick really padded his stats against Hubbell in the final two year he faced him (which were two of Hubbell’s final three campaigns). Medwick, who faced Hubbell in ten seasons, hit .480 against him in those two campaigns– collecting 24 percent of his career hits versus Hubbell and 31 percent of his career RBI.
  4. Balancing all this was the fact the Medwick  hit .365 (19-for-52), with two home runs and six RBI in 1936-37 – two seasons in which Hubbell posted a combined 48-14, 2.71 mark.


Medwick, a Hall of Famer, played 17 MLB seasons hitting .324-205-1,383. He led the league in runs scored once, hits twice, doubles three times, triples once, home runs once, RBI three times, total bases three times and batting average once.  He was a ten-time All Star and the 1937 National Leaguer MVP (when he won the Triple Crown).

Photo: Cincinnati Reds – 1940 Team Issue, Public domain, via Wikimedia Commons

Ival Goodman …  A bit less well-known than Ducky Medwick (understatement there), Ival Goodman played in just 25 games versus Hubbell (64 at bats), but his six homers tied for the second-most against Hubbell and his 16 RBI were 14th and, notably, everyone ahead of him on the lists in those two categories had at least 49 percent more at bats versus Hubbell.  Goodman’s .328 average versus Hubbell was more than 40 points higher than his career averages (.281).

_______________________________

Ival Goodman’s first hit off Carl Hubbell (in his first game against him) was an inside-the-park home run – the only inside-the-park homer of Goodman’s MLB career. 

__________________________

Goodman played in 11 MLB seasons (1935-44 … Reds Cubs), hitting .281-95-515 in 1,107 games. He was a two-time  All Star and twice led the National League in triples.  His best season was 1938, when he went .292-30-92 for the Reds.

Goodman played football, basketball and track in high school (his high school did not field a baseball team) and was recruited off a townball team. He was  known more for his speed and defense than his power (he had 85 career triples and 95 career home runs).   Over his career, Goodman averaged one home run per  every 46.7 at bats – against Hubbell he laced one home per every 10.6 at bats.

Ival  Goodman drove in the first run in the first night game in MLB history. It came in the bottom of the first frame of a Reds 2-1 win over the Phillies on May 22, 1935.

Note: I also looked at Paul Waner (.318-0-24), whose 67 hits were the most of any batter versus Hubbell (Waner’s .318 average was below his career average and there were those zero home runs) and Jack Rothrock (.350-2-9 in 11 games versus Hubbell).

Pitcher(s) – Harry Gumbert, Jim Tobin, Fred Frankhouse and Red Lucas

For obvious reasons, individual opposing pitchers did not rack up significant numbers of plate appearances versus Hubbell.  With that disclaimer, here are a few who hit him well.

Harry Gumbert … Righty Harry Gumbert was a career .184 hitter (with five home runs and 45 RBI) in 708 at bats. However,  he hit .600 (in three  games) versus Carl Hubbell.   As a pitcher, Gumbert went 143-13 over 15 MLB seasons (1935-44, 1946-50 … Giants, Cardinals, Reds, Pirates). He appeared in 508 games (235 starts). Gumbert’s best season as a hitter was 1941, when he .292 (17-for-64), with two home runs and six RBI (for the Giants and Cardinals). His best season on the mound was 1937, when he went 18-11, 4.32 for the Giants (as a teammate of Hubbell). Gumbert won ten or more games in eleven seasons.  In the three games in which he pitched and batted  against Hubbell, Gumbert went 2-1, 2.53, while Hubbell went 101, 3.92.

________________________________________

Jim Tobin … No surprise to find right-hander Jim Tobin here.  He was one of the best-hitting pitchers of all-time (in fact, appearing as a pinch-hitter 108 times). Tobin played in the major leagues from 1937 through 1945 (Pirates, Braves, Tigers). At the plate, his career stat line was .230-17-102 (in 796 at bats). As a pitcher, he went 105-112, 3.44 in 287 games (227 starts). As a moundsman, Tobin finished over .500 in just three of nine seasons.  His best season as a batsman was his 1937 rookie campaign, when he hit .441 (15-for-34) in 21 games. (He had a five-homer, 17-RBI season in 1945 (his final MLB season), but hit just .137. In the games in which Tobin both pitched and batted against Hubbell (he was used as a pinch hitter versus Hubbell twice), Tobin went 2-1, with a 1.70 earned run average to Hubbell’s 2-2, 1.68.

Jim Tobin is one of only two MLB pitchers to hit three home runs in a game.  On May 13, 1942 – in a 6-5 Braves’ win over the Cubs – Tobin pitched a complete-game five-hitter (three earned runs) for the Braves and smacked three home runs (four RBI). Pitcher  Guy Hecker hit three home runs for the Louisville  Colonels in a 22-5 win over the Baltimore Orioles on August 15, 1886. 

________________________________________

Fred Frankhouse … Righty Fred Frankhouse was a solid hitter (for a pitcher), putting up a .208 career average (132-for-636), with one homer and 58 RBI –  and hitting .357 versus Carl Hubbell.  He played 13 MLB seasons (1927-39 … Cardinals, Braves, Dodgers) and went 106-97, 3.92 in 402 games (213 starts). His best season season was 1934 – his only All Star year – when he went 17-9, 3.20 for the Braves. He won ten or more games in five seasons(1933-36).  His best season at the plate was 1930, when he hi t.359, with seven RBI in 27 games.  In games in which he pitched and batted against Hubbell, Frankhouse had some “hard luck,.” He was 1-4, with a 1.98 earned run average to Hubbell’s 5-1, 2.39.

Hard Luck

On April 20, 1933, Frank Frankhouse pitched a complete game for the Braves (versus Carl Hubbell and the Giants), giving up just one earned run.  Hubbell, however, pitched a four-hit, 13-strikeout shutout.  Frankhouse, by the way, had two of the four hits versus Hubbell.

In the first three games that Frankhouse pitched versus Hubbell, Frankhouse surrendered just four earned runs in 26 innings, while Hubbell gave up just two earned tallies in 28 innings (one was a 10-inning contest). For his quality efforts, Frankhouse picked up three losses. 

________________________________________

Red Lucas …  Left-handed hitting (right-handed pitching) Red Lucas is probably on a lot of lists like this – having made 396 appearances as a pitcher and 506 as a pinch-hitter.  At the plate, Lucas hit .281 (404-for-1,439), with three home runs and 190 RBI. (He hit .318 versus Hubbell.) On the mound, Lucas was 157-135, 3.72 in 396 games (303 starts/204 complete games/22 shutouts).  His best season on the bump was 1929 (Reds), when he went 19-12, 3.60 and led the NL with 28 complete games. Lucas won 15 or more games three times and led the NL in complete games three times. His best season with the bat was 1927, when he hit .313 (47-for-150) and drove in 28 runs.  Lucas hit .300 or better in six of his 16 seasons. In games in which he pitched against Hubbell (Lucas was never used as a pinch hitter versus King Carl), Lucas held his own.  He went 4-6, 3.10 to Hubbell’s 5-4, 2.97.

Primary Resources: Baseball-Reference.com


Baseball Roundtable … blogging baseball since 2012. 

100Baseball Roundtable is on the Feedspot list of the Top 100 Baseball Blogs.  To see the full list, click here.

I tweet (on X) baseball @DavidBaseballRT

Follow Baseball Roundtable’s Facebook Page here.  More baseball commentary; blog post notifications.

Member: Society for American Baseball Research (SABR); The Baseball Reliquary; The Negro Leagues Baseball Museum.


Baseball Roundtable Presents an All-Time, All-Rookie Lineup

MLB just announced its 2022 Rookies of the Year.  Congratulations to the Mariners’ Julio Rodriguez and the Braves’ Michael Harris. (For a look at Baseball Roundtable’s 2022 All-Rookie Lineup, click here. )

In this post, we’ll take a look at Baseball Roundtable’s All-Time, All-Rookie Lineup. There are some surprises (and coincidences) along the way. For example:

  • In his rookie season, the starting second baseman actually finished second in Rookie of the Year balloting to another second baseman;
  • The starter at third base played 112 games at the hot corner in his rookie campaign – and never played there again in his 14-season MLB career;
  • One of the starters played thirty or more games at four different positions in his rookie season;
  • In college, one of the players was a two-time baseball All American and two-time academic All American;
  • Another of the players hit a Grand Slam and turned an unassisted triple play in his first college game;
  • Nearly half of the featured members of the “Lineup” (six of 13) had their stellar rookie campaigns in their age-23 seasons;
  • The lineup includes one 20-year-old (the youngest) and two 27-year-olds (the oldest); 
  • And more.

Before we start, a few words about the selection process (and, as with all baseball ratings, all my choices are open too discussion and debate). I looked primarily at traditional statistics (for example, I did not consider WAR) and compared the candidates to the players of their time (more than to each other).  I also added weight to those who led the league (or were in the top five) in statistical categories or captured such honors as All Star selections, MVP Awards or Cy Young Awards in their rookie seasons.  As usual, I tended to lean towards players who had more hits and/or fewer unproductive at bats (an admitted bias toward higher averages or on-base percentages and fewer strikeouts). Another productivity measure I looked at was runs created.  I hope you enjoy the read and find some food for thought.

So, here we go.

CATCHER – Josh Gibson, 1933 Pittsburgh Crawfords

Photo: Harrison Studio, Public domain, via Wikimedia Commons

As a 21-year-old rookie in 1933, Josh Gibson helped lead the Pittsburgh Crawfords to the Negro National League title. He played in 68 of the Crawfords’ 89 games and was behind  the plate in 48 of them.   In the process, he led the league in hits (94), triples (7), home runs (18), RBI (74), total bases (177), on-base percentage (.442), and slugging percentage  (.774).  He finished second in batting average, and third in runs scored, doubles and walks.

Side: note: MLB rules indicate a player qualifies as a rookie unless he has exceeded 130 at bats or 50 innings pitched in the major leagues. From 1930-32, Gibson played primarily  for independent clubs.

Gibson went on to play a total of 14 seasons in the Negro Leagues (MLB now considers the Negro Leagues from 1920 to 1948 to be major leagues) – putting up a .374-165-730 line. He twice won the Triple Crown (1936 and 1937), led the league in home runs 11 times, RBI seven times, runs scored five times, hits twice, batting average three times and total bases six times.

Honorable  Mentions:  Mike Piazza, 1993 Dodgers (.318-35-112); Benito Santiago, 1987 Padres, who went .300-18-79 and swiped 21 bases in 146 games); Carlton Fisk, 1972 Red Sox  (.293-22-61, with a league-leading nine triples).

_________________________________________

Special Mention – Mike Piazza

Who could have predicted that the 1,390th player selected in the 1988 MLB draft would not only be the 1993 Rookie of the Year, but would also earn a spot in the National Baseball Hall of Fame? Mike Piazza was also an All Star and Silver Slugger winner in his 1993 rookie campaign (Dodgers). In his 24-year-old rookie season, Piazza finished seventh in the AL in batting average (.318); sixth in home runs (35) and fourth in RBI (112).

Piazza hit .308, with 427 home runs and 1,335 RBI in 16 MLB seasons (Dodgers, Marlins, Mets, Padres, A’s). He was a two-time All Star, won ten Silver Slugger awards, topped 20 home runs nine times, 100 RBI six times, produced a .300+ average in nine campaigns and four times finished among the top four voter getters for MVP. Not bad for a 62nd-round draft pick.

_____________________________________________________

FIRST BASE – Mark McGwire, 1987 A’s

Photo: Silent Sensei from Santa Cruz, USA, CC BY 2.0 <https://creativecommons.org/licenses/by/2.0>, via Wikimedia Commons

Mark McGwire’s original call up was not an eye-opener (18 games in 1986, with a .189-3-9 stat line.) However, he made good on his promise in his first full season – going .289-49-118 for the A’s as a 23-year-old in 1987; and setting a rookie HR record that stood for three decades.  In 1987, McGwire led the American League in home runs and slugging percentage, was third in RBI and second in total bases. He finished sixth in the AL MVP balloting. McGwire went on to a 16-season MLB career in which he hit .263, with 583 long balls and 1,414 RBI. McGwire led his league in home runs four times (a high of 70 in 1998) and in RBI once (147 in 1999).

McGwire was drafted by the A’s in the first round (tenth overall) of the 1984 MLB Draft (out of the University of Southern California).

From Pitcher to First Base … Not a Bad Move

In three seasons (1982-84) at the University of Southern California, Mark McGwire hit .358, with 51 home runs and 139 RBI in 120 games (with all those hits coming in his final two campaigns). Some might be surprised to learn that, in 1982, McGwire was a pitcher (and did not come to the plate). He went 4-4, 3.04 in 20 games (four starts). McGwire was the Sporting News College Player of the Year in 1984, when he put up a .387-32-80 stat line in 67 games.

Honorable Mentions: Pete Alonso, 2019 Mets (.260-53-120), the AL leader in home runs, while setting a new MLB rookie record for round trippers); Dale Alexander, 1929 Tigers (.343-25-137,  with a league-leading 215 hits); Buck Leonard, 1935 Homestead Grays, who hit a league-leading .389 (40 games).

Special Mention – Jackie Robinson

You could not post about an All-Time, All-Rookie Lineup with a shout out to Jackie Robinson (after all, the Rookie of the Year Award is now known as The Jackie Robinson Award). Robinson won the award as a first baseman in 1947 – the season he broke MLB’s color line. Robinson hit .297, with 12 home runs, 48 RBI, 125 runs scored and a league-tipping 29 steals – while dealing with the pressures of an historic season.  While his offensive numbers do not match those of some of the others rookies at this traditionally offensive-focused position, there is no doubt about his, character courage and performance under pressure. And there is no double any post focusing on outstanding rookies would be incomplete without him. 

____________________________________________________

 SECOND BASE – Joe  Morgan, 1965 Astros

Photo: Unknown author, Public domain, via Wikimedia Common

This one was a tough call. I  found myself comparing speed (like Bump Wills’ 28 steals and 87 runs scored in 1997) to power (like Gleyber Torres’ 24 home runs and 77 RBI in 2018).  Ultimately, I went for a rookie second baseman who gave me some of each. Joe Morgan hit .271 as a 21-year-old rookie in 1965.  He tossed in 14 home runs, 20 steals and 100 runs scored.  In addition, his 97 walks led the league (helping him to a .373 on-base percentage, tenth in the league) – and he fanned just 77 times.

Morgan played basketball and baseball in high school, but was not recruited by four-year colleges – perhaps due to his size (5’7”).   He schooled and played instead at Oakland City College (a two-year institution), where he began to attract some  attention from scouts.  (In his second year at Oakland City College, he hit .367 and led the team in average, home runs and stolen bases.)

Morgan signed with the Astros (as an amateur free agent) in 1962 and was a major-league regular by 1965. He, in fact, made his MLB debut in as a 20-year-old in September of 1963.  (Morgan played in 18 MLB games in 1963-64.) In his final minor-league campaign, Morgan hit .323-12-90, with 47 steals in 140 games for the 1964 Double-A San Antonio Bullets.

Morgan went on to a 22-season MLB career. Hitting .271-268-1,133, with 689 stolen bases and 1,650 runs scored. He was a ten -time All Star, two-time Most Valuable Player and five-time Gold Glover.

Honorable Mentions:  Gleyber Torres, 2018 Yankees (.271-24-77); Del Pratt, 1912 Browns (.302-5-69, with 24 steals and 76 runs scored); Bump Wills, 1977 Rangers  (.287-9-62, with 28 steals and 87 runs scored); Dustin Pedroia, 2007 Red Sox (.317-8-50, with 86 runs scored).

Does This Seem Fair?

In 1965, Baseball Roundtable’s choice for second base on this All-Time, All-Rookie Lineup (Joe Morgan) finished second in the National League ROY balloting to another second baseman. Jim Lefebvre of the Dodgers got 14 first-place votes to Morgan’s four. Each played in 157 games with Morgan outhitting  Lefebvre .271 to .250, outscoring him 100 to 57, hitting 14 home runs to Lefebvre’s 12, stealing 20 bases to Lefebvre’s three, drawing 97 walks to the Dodgers’ second sacker’s 71 – and outdistancing  him in both on-base percentage and slugging percentage. Lefebvre did best Morgan in RBI (69-to-40). Their fielding stats were fairly equal, with Morgan making 27 errors in 867 chances and Lefebvre making 24 errors in 802 chances (Lefebvre’s fielding percentage was  .970 to Morgan’s .969).  

Side note: Jim Gilliam’s 1953 season for the Dodgers  (.278-6-63, with 125 runs scored and a league-topping 17 triples) would have made this list a few years ago.  But now that the Negro Leagues (1920-48) are considered major leagues, his rookie season would be with the Baltimore Elite giants in 1947.

__________________________________________

THIRD BASE – Ryan Braun, 2007 Brewers

Photo: Ian D’Andrea from Philadelphia, PA, CC BY-SA 2.0 <https://creativecommons.org/licenses/by-sa/2.0>, via Wikimedia Commons

Ryan Braun put up a .324-34-97 line, with 91 runs scored, 15 steals and a league-topping .634 slugging percentage in 2007. Notably, he started 112 games at third base that season – and did not start there again in his 14 MLB seasons (defensive issues at the hot corner led to a move to the outfield).

Braun was  a first-round pick (fifth overall) of the Brewers in the 2005 draft – after three seasons at the University of Miami, where he was .365-45-195 over 165 games.

Ryan Braun College Stardom

In 2003 (while playing for the University of Miami), Ryan Braun was Baseball America’s National Freshman of the Year after going .364-17-74. He was also a 2005 All American (and Atlantic Coat Conference Player of the Year) – after a .388-18-76 season. (College Stats from TheBaseballCube.com)

Braun rose quickly through the minor-league ranks – hitting .352-10-45 in 47 games at Rookie- and A-Ball in 2005; .289-22-77, with 26 steals at High-A and Double-A in 2006; and  .342-10-22 in 34 games at Triple-A in 2007.  He made his MLB debut, at the age of 23, May 25, 2007.

Braun went on to a 14-season MLB career (.296-352-1,154, with 216 stolen bases).  He was the 2007 NL Rookie of the Year, a six-time All Star and the 2011 National League MVP.

Honorable Mentions: Dick Allen, 1964 Philllies (.318-29-91, with a league-leading 125 runs scored.);  Al Rosen,  1950 Indians  (.287-37-116, with 100 runs scored); Kevin Seitzer, 1987 Royals (.323-15-83, with 12 steals and 105 runs scored); Pete Ward, 1963 White Sox (.295-22-84).

__________________________________________

SHORTSTOP – Nomar Garciaparra, 1997 Red Sox

Photo: Jon Gudorf Photography, CC BY-SA 2.0 <https://creativecommons.org/licenses/by-sa/2.0>, via Wikimedia Commons

Nomar Garciaparra’s rookie season saw the 23-year-old lead the American League in at bats, hits, and triples, while scoring 122 runs and putting up a .306-30-98 stat line, with 22 stolen bases. Garciaparra was drafted (by the Brewers) in the first round of the 1994 draft (out of the Georgia Institute of Technology, where he had hit .372-23-166 with 66 steals over three seasons – 174 games).

Like most players on this list, Garciaparra’s rise to the major leagues was swift – coming in just his third professional season. He was called up  in late 1996 and got in 24 games for the Red Sox, hitting .241-4-176 (and keeping his rookie status for 1997).

All Star on the Field and in the Classroom

Nomar Garciaparra was a two-time, first-team All American and a two-time Academic All American.

Garciaparra went on to a 14-season MLB career, hitting .313-229-936.  He was a six-time All Star and won back-to-back AL batting titles in 1999 (.357) and 2000 (.371).

Honorable Mentions: Corey Seager, 2016 Dodgers (.308-26-72, with 105 runs scored); Hanley Ramirez, 2006 Marlins (.292-17-59, with 51 steals and 119 runs scored); Troy Tulowitzki, 2007 Rockies (.291-24-99, with 104 runs scored); Johnny Pesky, 1942 Red Sox, (.331-2-51, with 205 hits, 12 steals and 105 runs scored); Harvey Kuenn, 1953 Tigers (308-2-48, with a league-leading 209 hits).

_____________________________________________

LEFT FIELD – Wally Berger, 1930 Braves

Wally Berger made his major-league debut for the Boston Braves on April 15, 1930 – after three minor-league seasons over which he hit .352, with 144 home runs in 499 games. As a 24-year-old MLB rookie, he finished third in the National League in home runs – and his 38 long balls were the record for an MLB  rookie that stood for 57 years.

Berger went on to play 11 MLB seasons, hitting .300, with 242 home runs and 898 RBI. He was a four-time All Star and led the NL in home runs (34) and RBI (130) in 1935.

Honorable Mentions: Mitchell Page, 1977 A’s (.307-21-75, with 42 steals and 85 runs scored); Frank Robinson, 1956 Reds (.290-38-83, with a league-leading 122 runs scored – at the ripe young age of 20); Jeff Heath, 1938 Indians (.343-21-112, with 104 runs scored); Kiki Cuyler, 1924 Pirates (.354-9-85, with 32 seals and 94 runs scored).

______________________________________________

CENTER FIELD – Fred Lynn, 1975 Red Sox

Photo: Unknown author, Public domain, via Wikimedia Commons

The first player to win Rookie of the Year and a Most Valuable Player Award in the same season, Lynn had shown his promise the season before. Called up from the Triple-A Pawtucket Red Sox (where he hit .282-21-68 in 124 games), Lynn closed out the 1974 season hitting .419 in 15 games for Boston.  In 1975, the 23-year-old hit .331 (second in the AL), with 21 home runs, 105 RBI (third in the AL) and an AL-leading 103 runs scored  – and he won a Gold Glove for his defensive play in center field.

Lynn was selected by the Red Sox in the second round of the 1973 MLB draft. He played his college ball at the University of Southern California, where he hit .320-28-111 over three seasons and was a first-team All American in 1972.

Lynn went on to a 17-season career during which he was an All Star in nine seasons and a four-time Gold Glover. His career stat line was .283-306-1,111 .

Honorable Mentions: Mike Trout, 2012 Angels (.326-30-83, with 49 steals and 129 runs scored); Turkey Stearnes, 1923 Detroit Stars (.362-17-85); Oscar Charleston, 1920 Indianapolis ABCs (.353-5-59, with a league-leading 122 hits, 80 runs scored and 11 triples); Cristobal Torriente, 1920 Chicago American Giants – the Negro National League batting champions as a rookie (.411-2-58); Kenny Lofton, 1992 Indians (.285-5-42, with 96 runs scored and 66 steals).

__________________________________________________

RIGHT Field – Tie … Shoeless Joe Jackson, 1911 Indians,  Ichiro Suzuki, 2001 Mariners & Ted Williams, 1939 Red Sox

Yes, I know a three-way tie is kind of a cop-out, but there was so much to choose from here – a .400+ hitter; a batting champ who who, in 2001,  put up (at the time) the ninth-most hits ever in an MLB season (and the most since 1930) and a 20-year-old who drove in 145 runs ans scored 131.

Photo: Miscellaneous Items in High Demand, PPOC, Library of Congress, Public domain, via Wikimedia Commons

Joe Jackson … The 23-year-old Indians’ outfielder had been called up for the proverbial MLB “cup of coffee” in 1908, 1909 and 1910, but had seen action in only 30 games – retaining his rookie status. After a 1910 season that saw Jackson hit .354 in 136 games for the Class-A New Orleans Pelicans and then .387 in 20 contests for the Indians, Jackson had cemented a spot with the 1911 AL Indians’ squad.  That season, he started 96 games in right field and 50 in center.

In 147 games, he hit .408, with 233 hits, 126 runs scored, 45 doubles, 19 triples, seven home runs, 83 RBI and 41 stolen bases.   In 1911,  Jackson was second in MLB in batting average (to Ty Cobb’s .420); first in on-base percentage (.468); second (to Cobb) in slugging percentage at .590; second in runs scored (again to Cobb); second in hits (Cobb); second in doubles (Cobb); and second in total bases with 337 (Cobb, 367). He finished fourth in the MVP voting.

If it took Ty Cobb in his prime to outhit you in your rookie season, you’ve earned a spot in this lineup.

Jackson – caught up in the Black Sox scandal of 1919 – went on to a 13-year career in which he  averaged .356, three times led the AL in triples, twice led the AL in hits, twice topped the league in total bases and racked up single seasons leading the AL in doubles, on-base percentage and slugging percentage. By the way, Jackson hit .375 in that infamous 1919 World Series.

Photo: Jeffrey Hayes, CC BY 2.0 <https://creativecommons.org/licenses/by/2.0>, via Wikimedia Commons

Ichiro Suzuki … Like Fred Lynn in this outfield, Suzuki was the Rookie of the Year and League MVP in the same season. As a 27-year-old MLB rookie, he led the AL with a .350 average and 242 hits – and added a league-leading 56 stolen bases and a Gold Glove. Keep in mind, that Suzuki had nine seasons in Japan before making the “major leagues” (.353 average and seven batting championships in Japan).

Like Elvis, Cher and Madonna, Ichiro became a a star who needed only one name.  After a spectacular rookie season in MLB, Ichiro just kept on hitting.  He amassed  200+ hits in each of his first ten MLB seasons, leading the league in safeties seven times – and picked up a pair of batting titles along the way.  He was also a Gold Glover in each of his first ten seasons. Ichiro retired with  a .311 MLB average, 3,089 hits, 117 home runs, 780 RBI, 1,420 runs scored. And 509 steals.

Photo: Apex Photo Company, Public Domain, via Wikimedia Commons

Ted Williams …   Teddy Ball Game broke into the big leagues in 1939 – a 20-year-old rookie. It was his fourth professional season and, in three minor-league campaigns, his average had gone from .271 to .291 to .366. In 1939, Williams hit .327, banged out 31 home runs, led all of MLB with 145 RBI, led the American League with 344 total bases and scored 131 times. He finished seventh in the AL in batting average; fifth in hits (185); first in total bases (344); second in doubles (44); fifth in triples (11); and third in home runs (31).

Williams went on to a Hall of Fame career that included 19 All Star selections, two MVP Awards and two Triple Crowns.  He led his league in batting average six times; home run four times; runs scored six times; RBI four times; total bases six times; on-base percentage 12 times; slugging percentage nine times; and, not surprisingly, walks eight times and intentional walks nine times.  He set the tone for this remarkable career in his rookie season.

A Hero On and Off the Field

Ted Williams lost approximately five years of MLB playing time while serving in the U.S military – as a combat fighter pilot –  in World War II and the Korean War. 

Honorable Mentions: Aaron Judge, 2017 Yankees (.284-52-114, with 128 runs scored); George Watkins, 1930 Cardinals (.373-17-87, with 85 runs scored);  Tony Oliva, 1964 Twins (,323,-32-94, with 109 runs scored and 12 steals and the AL tops in hits and average).

__________________________________________

DH/UTILITY – Albert Pujols, 2001 Cardinals

Photo: SD Dirk on Flickr (Original version)  UCinternational (Crop), CC BY 2.0 <https://creativecommons.org/licenses/by/2.0>, via Wikimedia Commons

Some may be surprised that Albert Pujols is not at first base in this lineup. The reason is that in his rookie season (2001), the 21-year-old Pujols started just 31 of 161 games played (19.2%) at first base. In his rookie season, Pujols started 52 games at 3B; 38 in LF; 33 in RF; 31 at 1B; and 2 at DH.

In 2001, Pujols put up the first in a string of remarkable seasons –  hitting  .329, with 37 home runs, 130 RBI and 112 runs scored and earning Rookie of the Year Award and a fourth-place finish in the MVP balloting. Over the first ten seasons of his career, he topped a .300 average, 30 home runs and 100 RBI every season.

Pujols scores points for making a .300-30-100 season seem a bit mundane – right from his rookie season.  He also gets extra credit for versatility.

Pujols was drafted by the Cardinals in the 13th round of the 1999 MLB Draft (out of Metropolitan Community College -Maple Woods, Kansas City). Pujols hit .461, with 22 home runs in his only college season.

That’s a Good Start

In his first college game, Albert Pujols started at shortstop and hit a Grand Slam Home Run AND turned an unassisted triple play.

One That Got Away,” Gordon Edes, Boston Globe, October 11, 2006

Retiring after the 2022 season, Pujols’ stat line is .296-703-2,218 (with 3,384 hits).   The 11-time All Star and three-time MVP led his league in runs scored five times, home runs twice, RBI once and average once. He also picked up a pair of Gold Gloves along the way. As a rookie, he got a Hall of Fame career off to a great start

_________________________________________

STARTING PITCHER – Russ Ford,  1910 Yankees

Photo: Bain News Service (publisher), Public domain, via Wikimedia Commons

Unlike many of the players on this list, after a spectacular rookie season, right-handed hurler Russ Ford did not go on to a long and illustrious MLB career. Before making the New York Highlanders (Yankees) roster in 1910, Ford did get a somewhat disappointing  “cup of major-league coffee” in 1909 – one game, three innings pitched, four hits, four walks, three hit batsmen, three earned runs, two strikeouts.

Still a rookie in 1910, the 27-year-old righty went 26-6 with a 1.65 ERA. In his initial full campaign, Ford was second in the AL in wins (26); second in winning percentage (.813); seventh in ERA (1.65); fourth in strikeouts (209); fifth in games started (33); fourth in complete games (29); second in shutouts (8); allowed the fewest hits per nine innings (5.89); and had the second-lowest Walks and Hits per Innings Pitched (0.88).  On a Highlanders’ team that finished second with an 88-63 record, Ford led the team in virtually every positive pitching category.

Ford followed that rookie season with a 22-11, 2.27 record in 1911, but then led the AL in losses (13-21, 3.55) in 1912 and lost 18 games (versus 12 wins) in 1913. He jumped to Buffalo of the Federal League in 1914, going 21-6, 1.82 … and 5-9, 4.52 in 1915. Historians report that Ford’s career was cut short (he did not pitch in the majors after 1915) with the banning of his signature pitch – the well-scuffed “emery ball.”  His final MLB line, over seven seasons, was 99-71, 2.59.

Honorable Mentions: Grover Cleveland (Pete) Alexander, 1911 Phillies (28-11, 2.57 – leading the league in wins, complete games with 31 and shutouts with seven);  Dwight Gooden, 1984 Mets (17-9, 2.60, while leading the NL in complete games with 16, innings pitched with 276 2/3 and strikeouts with 276); Fernando Valenzuela, 1981 Dodgers ( 13-7 in the strike-shortened 1981 season – winning both Rookie of the Year and the Cy Young Award – and leading the league in complete games with 11, shutouts with eight, innings pitched with 192 1/3 and strikeouts with 180); Mark Fidrych, 1976 Tigers (19-9, 2.34 – leading the league in ERA, complete games with 24, throwing complete games in 11 of his first 12 MLB starts and topping the league in talking to baseballs).

__________________________________________________

RELIEF PITCHER – Craig Kimbrel, 2010 Braves

Photo: LWY on Flickr (Original version) UCinternational (Crop), CC BY 2.0 <https://creativecommons.org/licenses/by/2.0>, via Wikimedia Commons

In 2011, 23-year-old Craig Kimbrel set the rookie record for saves, with 46 – leading the National League. He put up a 2.10 ERA in a league-leading 64 appearances (fanning 127 in 77 innings).

Kimbrel was  selected (by the Braves) in the third round of the 2008 MLB draft (out of Wallace State Community College). In his freshman season at Wallace State (2007), Kimbrel went 8-0, 1.99. He followed that up with a 9-3, 2.88 record in 2008.

After being drafted by the Braves, Kimbrel went 8-7, 1,85 with 51 saves and 242 whiffs in 151 innings over three minor-league seasons. He did pitch for the Braves in 2010, going 4-0, with a 0.44 ERA in 21 appearances (his 20 2/3 innings pitched enabled him to retain his rookie status into 2011.)

Kimbrel, still active in 2022, is an eight-time All Star and has led his league in saves four times. His career record at the end of the 2022 season was 41-36, 2.31, with 394 saves and 1,098 strikeouts in 688 1/3 innings pitched.

Honorable  Mentions: Neftali Felix, 2010 Rangers (4-3, 2.73 with 40 saves in a league-leading 59 appearances); Andrew Bailey, 2009 A’s (6-3, 1.84 with 26 saves); Huston Street, 2005 A’s (5-1, 1.71 with 23 saves); Kaz Sasaki, 2000 Mariners (2-5, 3.16 with 37 saves).

Primary Resources:  Baseball-Reference.com; TheBaseballCube.com


Baseball Roundtable … blogging baseball since 2012. 

100Baseball Roundtable is on the Feedspot list of the Top 100 Baseball Blogs.  To see the full list, click here.

I tweet (on X) baseball @DavidBaseballRT

Follow Baseball Roundtable’s Facebook Page here.  More baseball commentary; blog post notifications.

Member: Society for American Baseball Research (SABR); The Baseball Reliquary; The Negro Leagues Baseball Museum.


A Handful of World Series I Recall Fondly

With the 2022 World Series about to start, I find myself (as usual) reflecting on World Series past. In my two most-recent posts, I’ve looked at record-setting  single-game World Series performances (click here for that post) and single World Series marks (click here).  In this post, I am reflecting on a handful of World Series – and specific games –  that I recall fondly.  These are not necessarily the brightest and best of past World Series.  They are just a few that have a special  place in my memory and heart. The reasons are varied: a home-team connection, a favorite player, an iconic moment – you get the idea.

Number-One … The 1957 World Series – won by the Braves (of my hometown Milwaukee) over the Yankees. I was just ten-years-old and already a baseball fanatic. I most fondly remember Game Four when Eddie Mathews (my childhood hero and still all-time favorite player) hit a two-run, tenth-inning walk-off home run to win the game. The whole experience was made all the sweeter by the fact that my Braves were significant underdogs – and the city of Milwaukee was getting no “love.” (One of the Yankees’ traveling staff was reportedly even quoted as referring to Milwaukee as “Bush League.”)

New York at the Center of the Baseball World

In the ten seasons prior to 1957:

  • The Yankees had won seven of the ten World Series;
  • New York-based teams had won nine of ten Series titles;
  • There were seven all-New York World Series;
  • Of the twenty World Series “slots,” 16 were filled by New York -based teams,

My Braves upset the favored Yankees four games-to-three in a Series that featured the likes of Hank Aaron, Eddie Mathews and Warren Spahn on one side  and Mickey Mantle, Yogi Berra and Whitey Ford on the other.  Not a bad World Series to start your Fall Classic memory bank on. The hero, star and MVP  of the Series, however, was Braves’ righty “Fidgety” Lew Burdette (a former Yankee), who won three games versus the Yankees (all complete games – two shutouts) and gave up just two runs in 27 innings pitched.

“He (Lew Burdette) could make coffee nervous.”

                        Braves Manager Fred Haney.

As a kid, I was focused not only on the stars (and Hall of Famers), but also on a rookie Braves’ outfielder named Bob “Hurricane” Hazle, who had been called up in late July (due to an injury to the Braves’ Billy Bruton) and had taken MLB by storm – playing a notable role in getting the Braves to the Fall Classic. Hazle (whose previous MLB experience had been six games with the Reds in 1955 – three singles in 13 at bats) played in 41 of the Braves last 55 regular-season games – hitting .403, with seven home runs and 27 RBI. (He also walked 18 times versus 15 strikeouts.) While Hazle hit just .154 in four World Series Games, he did collect two hits and score a pair of runs in the Braves’ 5-0 win in the seventh and deciding game.

Side note: Bob Hazle  got off to a slow start in 1958, hitting just .179 in 20 games with the Braves before being sent to the Tigers. He finished the season as .211-2-10 in 63 games and did not play in the major leagues again. Still, he finished with a career MLB average of .310.

____________________________________

Number-Two … The 1960 World Series won by the upstart Pirates over the Yankees – despite the fact that the Yankees outscored the Pirates 55-27, outhit them .338 to .256 and out-homered them 10-4.

In 1960, the New York Yankees set the record for the highest batting average, most hits and most run scored (55) in a World Series (seven-game format) – and lost to the Pirates four games-to- three.

I took great pleasure  in this one for a couple of reason.  First, the Yankees were still considered the titans of baseball and so this was a true upset.  Second, I saw this as payback for 1958, when the Yankees came back from being down three games-to-one to beat my Braves in the World Series.

Mazeroski’s 1960 home run trot earned him a immortalized at PNC Park.

I most fondly remember Game Seven – a see-saw battle won by Pirates 10-9 on a walk-off home run in the bottom of the ninth by Bill Mazeroski.  As a Karpinski, I always rooted for MLB’s “skis.”  For more on this World Series, click here.

Yankee second baseman Bobby Richardson drove in a  World Series record 12 runs and was selected as the WS Most Valuable Player – still the only WS MVP from a losing squad.

For the Record – But Not for the Win

In 1964, Bobby Richardson added to his World Series resume, setting the record for base hits in a World Series (seven-game format), going 13-for-32 (.406) against the Cardinals.  The Yankees lost that series four-game to three. 

____________________________________________________

Number Three … The 1991 World Series, when my Twins (I moved to Minnesota in 1969) topped the Braves four games to three. I most fondly remember the tension of Game Seven (I was in the park for Games Two and Seven), when Jack Morris (the Series MVP) pitched a ten-inning, complete-game shutout for 1-0 win. The Series was actually filled with tension, including five one-run ball games – three decided in extra innings,

Worst -to first

The 1991 World Series was the first Fall Classic in which two teams that had finished in last place the previous season advanced to the World Series. In 1990, the Braves finished last in the NL West at 65-97, while the Twins finished in the cellar of the AL West as 74-88).

I recall lots of tension filled innings and the fact that Mark Lemke (a .234 hitter in the regular season) torched Twins pitching for a .417 average with three triples (he had just two three-baggers in 136 games during the regular season).

Like Mazeroski, Kirby Pucket tgot a statue. Photo by compujeramey

Before Game Six  – a must-win for the Twins – in the 1991 World Series, Twins star center-fielder Kirby Puckett told is teammates “You guys should jump on may back tonight, I’m going to carry us.”  Puckett then backed up his words with a run-saving leaping catch in the third inning – along with a three-for-four (two runs, three RBI ) game that include walk-off home run in the bottom of the eleventh inning to give the Twins a 4-3 win.

The next game was, of course, Jack Morris’ ten-inning, complete-game shutout that gave the Twin a 1-0 win and the Series title (and Morris the Series MVP Award).

_______________________________________

Number Four … The 1988 World Series, as the, as the Dodgers topped the A’s in five games. Who can forget gimpy Dodger Kirk Gibson’s iconic, pinch-hit, walk-off home run off premier closer Dennis Eckersley to end Game One.  I also recall fondly how capably  and enthusiastically former Twin (and a favorite of mine) Mickey Hatcher filled in for Gibson during the Series (hitting .368 with two homers). To this day, I still feel Hatcher should have shared the Series MVP award with Oral Hershiser, who picked up two complete-game wins for the Dodgers.  Hatcher, who hit .293, with just one home run and 25 RBI in 88 regular-season games, hit .368, with two home runs and five RBI in the five-game World Series.

Kirk Gibson, despite being  a league MVP (NL-1988)  and AL Championship Series MVP (Tigers – 1984) never made an All Star Team in his 17-season MLB career.

___________________________________________

Number Five … The 1987 World Series (I attended this one), as My twins topped the favored Cardinal four-games to three – with Kirby Puckett‘s four-for-four performance in Game six being a key factor. What I remember most fondly as the enthusiasm of the fans and the spectacle of 40,000+ homer hankies waving wildly in the stands.  Pure excitement!

The stage (and tone) for the 1987 World Series (for Minnesotan) was set when the Twins returned home after topping the Tigers in the American League Championship Series. On the flight home, they were told a few thousand fans were waiting at the Metrodome to welcome back the victorious warriors.  As the team’s motorcade approached the ballpark, the players knew that something truly unique was taking place. The were people on overpasses and along the streets waving banners and homer hankies and, the closer they got to the Metrodome, the more packed the crowds became.  And, once the players were in the Dome, they found it filled to capacity – an estimated 50,000+ wildly cheering fans. The team was so moved that many several players and family member were brought to tears. That excitement spilled over to the World Series – earning it a place on the Fall Classics I recall most fondly.

1987 was the first World Series when the home teams won every game.  The Twins were lucky to have four  games at home.  On the season they were 56-25 at home (the most 1987 home wins  of any MLB team ) and 29-52 on the road (the fifth-fewest road wins of any MLB team that season).

I recall spending most of Game Seven “on the edge of my seat.” The Twins fell behind 2-0 in the top of the second, as Twins’ starter (and eventual Series MVP) Frank Viola got touched up  for four hits. The Twins came back to score one in the second and one in the fifth before taking the lead for good with one in the sixth. (They won 4-2). Viola settled down to go eight innings (six hits, two runs, no walks, seven whiffs.).

We Twins fans were also treated to Grand Slams by Dan Gladden in Game One and Kent Hrbek in Game Six.

Now to watch the Phillies/Astros and add some more World Series memories.

Primary Resource: Baseball-Reference.com

For past posts ranking the World Series Top Ten Shutouts (click here) and Ranking the Top World Series Walk-Off Home Runs click here.

Baseball Roundtable … blogging baseball since 2012. 

100Baseball Roundtable is on the Feedspot list of the Top 100 Baseball Blogs.  To see the full list, click here.

I tweet (on X) baseball @DavidBaseballRT

Follow Baseball Roundtable’s Facebook Page here.  More baseball commentary; blog post notifications.

Member: Society for American Baseball Research (SABR); The Baseball Reliquary; The Negro Leagues Baseball Museum.


These Pitchers Took Control of the Situation

This post is another of those Baseball Roundtable “one thing leads to another” random musings.  With the Twins having faded from post-season contention, I found myself looking at some past Twins players. One thing led to another and I noted that a pair of Twins’ pitchers hold the MLB single-season records for fewest walks per nine innings and best strikeouts-to-walks ratio (post 1888).  This led me to look at the all-time leaders in those “very controlling” categories.

Note:  I used post-1888 numbers to reflect rules changes over time. In the late 1870s, it took nine balls outside the striking zone to earn a walk. In 1880, the figure was dropped to eight balls. It slid down to six in 1884; five in 1887; and the current four-ball rule came into play in 1889.

Let’s start with walks per nine-innings  (among qualifying pitchers).

Carlos Silva – Single-Season Fewest Walks Per Nine Innings

The single-season MLB record holder for fewest walks per nine innings (among qualifiers) is righty Carlos Silva, who walked just 0.43 batters per nine frames for the 2005 Twins.In 2005, Silva went 9-8, 3.44. He walked just nine batters in 188 1/3 innings (fanning 71) and two of those free passes were intentional. If you are looking for an obscure trivia questions, you might ask “How many right-handed batters did Silva walk in 2005? “ The answer would be one:   Tigers’ outfielder  Craig Monroe – and that walk, by the way,  was an intentional pass. In his 27 2005 starts, Silva averaged seven innings per start and never walked more than one batter in any contest.

Carlos Silva is the only pitcher – among  the top 25 in fewest walks per nine innings – whose record season came after the four-ball walk rule was introduced.

Silva pitched in nine MLB seasons (2002-2010 … Phillies, Twins, Mariners, Cubs), going 70-70, 4.68 in 180 starts and 136 relief appearances. He finished in his league’s top five  in fewest walks per nine innings four times.

Side note: Silva is seventh on the all-time single-season list, but all those ahead of him recorded their “controlling” seasons between 1876 and 1880, when it took either eight or nine balls to complete a free pass. The ultimate leader is George Zettlein of the 1876 Philadelphia Athletics at 0.23 walks per nine.  

______________________________________

Cy Young led the league in fewest walks per nine innings in 14 seasons

and in strikeout-to-walk ratio in 11. 

______________________________________

Deacon Phillippe – Fewest Career Walks Per Nine Innings (minimum 1,000 innings)

Righty Deacon Phillippe played in 13 MLB seasons (1899-1911 … Louisville Colonels, Pittsburgh Pirates). He waked just 363 batters over 2,607 1/3 innings pitched (1.25 walks per nine innings).

Phillippe’s career mark was 189-109, 2.59. He won 20 or more games in six seasons. He led is league in fewest walks per nine innings five times (finishing in the top five eight  times) and strikeout-per-walk ratio four times (top five seven times). His best season was 1903, when he went 25-9, 2.43 and completed 31 of 33 starts.

Side Note: Phillippe is 16th all-time in fewest walks per nine frames, but all those ahead of him spent all or the bulk of their careers pitching before the four-ball rule was put in place.  In first place on the full list is righty Candy Cummings, who pitched in six MLB  seasons (1872-77) and walked just 113 batters in 2,149 innings. Cummings, a Hall of Famer, went 145-94, 2.42 over those six campaigns. From 1872 through 1875, he went 124-72 (averaging 31 wins per season), 2.35, with 193 complete games in 198 starts.  

__________________________________________

In the “ stream of  “one thing leads to another” thought, I also look a look at pitches who appeared to best combine control with swing-and-miss stuff.  They weren’t the stingiest with walks, but had the combination of stuff and command to help themselves a lot more with strikeouts than they hurt themselves with free passes. Here, I found a few more recent moundsmen.

Phil Hughes – Best Single-Season Strikeout -to-Walk Ratio (among qualifiers)

Right-hander Phil Hughes is number-one all time in single-season strikeout-to-walk ratio – at 11.63 for the 2014 Twins. That season, Hughes went 16-10, 3.52, fanning 186 batters and walking just 16 (one intentionally) in 209 2/3 innings. Surprisingly, Hughes’ next best season in strikeout-to-walk ratio was only about half his 2014 ratio – 5.88 in 2015.

*Marco Gonzalez is still active. His stats are through September 25, 2022.

Hughes pitched in 12 MLB seasons (2007-2018 … Yankees, Twins, Padres). He went 88-79, 4.52. He was an All Star in 2010, when he went 18-8, 4.19 for the Yankees. He recorded three seasons of 16 or more victories. The 2014 season is the only one in which he finished in his league’s top five for fewest walks per nine innings, as well as his only top-five season in strikeout-to-walk ratio.

A Quick Turnaround

In the year Phil Hughes set the single-season strikeout-to-walk ratio record, he walked four batters in his first ten  innings pitched. He then went on to walk just 12 more batters over his next 199 2/3 innings. He did not walk a batter in 19 of 32 appearances and only twice walked more than one in a game.

_____________________________________

Chris Sale – Career Strikeout-to-Walk Ratio (minimum 1,000 innings pitched)

Southpaw Chris Sale (still active) leads the pack in career strikeout-to-walk ratio at 5.33.  In 1,678 1/3 innings pitched, he has fanned 2,064 batters and walked 387.

*Chris Sale, Jacob deGrom and Corey Kluber are active in the major leagues this season.

Their stats are through September 25.

Sale has pitched in 12 MLB seasons (2010-19, 2021-22 … White Sox, Red Sox). The seven-time All Star  and has led his league in strikeouts twice (top five five times), strikeouts per nine innings three times (four times in the top five) and strikeout-to-walk ratio once (five times in the top five). Sale has a 114-74, 3.03 record.

________________________________________

Another possible trivia question to fool your friends. Ask them to rank these pitchers in order of career walks per nine innings – fewest to most: Josh Tomlin, Brad Radke, Bret Saberhagen, Rick Reed, Greg Maddux. The ranking is in the order they are presented: Tomlin (1.29); Radke (1.63); Saberhagen (1.65); Reed (1.66); Maddux (1.80).

Primary Resource:  Baseball-Refeence.com.


Baseball Roundtable … blogging baseball since 2012. 

100Baseball Roundtable is on the Feedspot list of the Top 100 Baseball Blogs.  To see the full list, click here.

I tweet (on X) baseball @DavidBaseballRT

Follow Baseball Roundtable’s Facebook Page here.  More baseball commentary; blog post notifications.

Member: Society for American Baseball Research (SABR); The Baseball Reliquary; The Negro Leagues Baseball Museum.

Robin Roberts – 1950’s King of the Hill

By way of introduction to this post, I was born in 1947 – which means my formative years, as a baseball fan, were the 1950’s. I went to my first minor-league game in 1951, my first major-league game in 1953 (when the Braves moved to my home town of Milwaukee) and my first World Series game in 1957.  I played my first Little League game in 1955.

It wasn’t a bad time to start a life of fandom. There were players who debuted early in the decade and made their mark quickly – like Whitey Ford (MLB debut in 1950); Willie Mays (1951); Mickey Mantle and Eddie Mathews (1952); Ernie Banks (1953); Hank Aaron and Harmon Killebrew (1954); and Roberto Clemente (1955).  There also were more established stars like Stan Musial, Warren Spahn, Ted Williams, Duke Snider and Ralph Kiner.  (Not to mention the underrated Richie AshburnOh, I guess I did mention him. ) And, for a kid whose last name ended in “ski,” the likes of Ted Kluszewski and Bill Mazeroski.

Ralph Kiner won the NL home run crown as a rookie in 1946 and went on to lead the league in homers for each of the next six seasons.

I would like to dedicate this post to one of the hardball heroes of my youth – Robin Roberts, who was clearly one of the  (if not the) Kings of the Hill in the 1950’s.

Multi-Sport Athlete

Robin Roberts not only starred on the Michigan State University baseball team (tossing six shutouts in 1946), he was also a basketball standout was captain and leading scorer for the Michigan State basketball squad.

Photo: Bowman, Public domain via WikiCommons

While attending Michigan State, Roberts also pitched for the Twin City Trojans (Montpelier, Vermont) in the summer semi-pro Northern League. His performance at MSU and in the Northern League (he was 18-3 for the semi-pro squad in 1947) led to a contract with the Philllies’ organization and – after putting up a 9-1 record in 11 games for the  B-Level  Wilmington Blue Rocks – Roberts made his MLB debut, as a 21-year-old, on June 18, 1948.  In that game, he went eight strong innings (five hits and two earned runs) in a 2-0 loss to the Pirates. Over the 1948-49 seasons, he went 22-24, 3.50 (with 20 complete games in 51 starts).  Then, in 1950, it all fell into place, as Roberts put up a 20-11, 3.02 season, with 21 complete games in 39 starts and a league-leading five shutouts. It would start a string of six straight seasons of 20 or more wins – during which he would lead the league in wins four times, starts six times, complete games four times, innings pitched five times and strikeouts twice.

A Working Man’s Game

From 1950 through 1955, Robin Roberts recorded six consecutive seasons of more than 300 innings pitched.

How good was Robin Roberts in the 1950’s?  In the ten seasons from 1950 through 1959, Roberts:

  • Averaged just over 300 innings pitched per season (3011 2/3 innings pitched with six seasons over 300); (check)
  • Pitched 1,013 1/3 innings in the three seasons from 1952 through 1954;
  • Was second only to Warren Spahn in victories – 199 to Spahn’s 202;
  • Was second only to Early Wynn in strikeouts (1,516 to Wynn’s 1,544);
  • Led all MLB pitchers in complete games (237);
  • Had the lowest Walk + Hits Per Innings Pitched (WHIP) of all pitchers with at least 1,000 innings pitched (1.129);
  • Was a six-time 20-game winner and a seven-time All Star;
  • Led the league in wins four straight season (1952-55);
  • Led the league in games started six straight seasons (1950-55);
  • Led the league in complete games five straight seasons (1952-56);
  • Over the ten seasons, averaged 7.96 innings per start;
  • Over the ten seasons, had a .571 winning percentage, while the Phillies had a .496 winning percentage;
  • In 1952, averaged 8.8 innings per start.

In 1952, Robing\ Roberts went 28-7, with a 2.59 earned run average. In 37 starts he threw 30 complete games and threw less than eight innings in just four contests.

  • In 370 starts over the 1950’s, went at least seven innings in 301;
  • Completed 28 consecutive starts from August 28, 1952 through July 5, 1953 (with one relief appearance interrupting the string);
  • For those into the new stats, had the highest Win Above Replacement (WAR) among pitchers (for the decade) at 60.5.

Pitch Count.  We don’t Need NO Stinkin’ Pitch Count

On September 6, 1952, Robin Roberts threw a 17-inning complete game in a 7-6 win over the Boston Braves in Philadelphia (holding the Braves scoreless over the final nine frames). How did all that work affect his arm?  Five days later, he threw a complete game in a 3-2 win over the Cardinals.  In fact, in the 22 days after that 17-inning outing, Roberts threw five complete-games (all wins); giving up 12 earned runs over the 54 innings (2.40 earned run average).

Hall of Famer Roberts pitched 19 seasons in the major leagues (1948-66 … Phillies, Orioles, Astros, Cubs), going 286-245, 3.41. He threw 305 complete games in 609 starts. (50.8%). Over his career he averaged 7.5 innings per start.

Side note:  An argument can be made that the heavy workload in the first half of the 1950s eventually took a toll on Robert’s right arm. But you can also look at the fact that from 1956-66, he still pitched to a 3.78 earned run average.

How the Game Has Changed

The AL and NL 2012 Cy Young Award Winners (Robbie Ray and Corbin Burnes) made a combined 60 starts, with zero complete games.

Now to close, here’s a look at some of the category leaders from the years during which I formed my attachment to the National pastime.

Primary Resources: Baseball-Reference.com; The Baseball Maniac’s Almanac, Edited by Bert Randolph Sugar, with Ken Samuelson (Skyhorse Publishing); Spartan Legend Robin Roberts Passes Away, May 6, 2010, MSUSpartans.com.


Baseball Roundtable … blogging baseball since 2012. 

100Baseball Roundtable is on the Feedspot list of the Top 100 Baseball Blogs.  To see the full list, click here.

I tweet (on X) baseball @DavidBaseballRT

Follow Baseball Roundtable’s Facebook Page here.  More baseball commentary; blog post notifications.

Member: Society for American Baseball Research (SABR); The Baseball Reliquary; The Negro Leagues Baseball Museum.

The Sandy Alcantara/Babe Ruth Connection

In 1920, Babe Ruth dominated the home run category when it came to MLB statistics. Ruth launched 54 home runs that season, nearly three times the next highest t0tal (19 for the Saint Louis Browns’ George Sisler) and more than all but one of the remaining MLB teams (the Phillies hit 64 home runs as a team).

Yesterday (September 18), Marlins’ right-hander Sandy Alcantara tossed his fifth complete game of the 2022 season – running his record to 13-8, 2.37 and his league-leading innings pitched to 212 2/3.

The Babe Ruth connection? Alcantara’s dominance of the statistical category.  (Keep in mind, Baseball Roundtable “connections” reflect how I look at baseball statistics and may be stretched at times.) Alcantara’s five complete games are more than any other MLB team (the Red Sox, Astros, Phillies and Cardinals have three each … and half of MLB’s 30 teams have yet to record a complete game this season).  The only pitchers with more than one complete game so far this season are Alcantara, the Astros’ Framber Valdez (3) and the  Phillies’ Aaron Nola (2).

A few observations:

  • In addition to his five 2022 complete games, Alcantara completed nine shutout innings in a Marlins’ 10-inning, 2-1 loss to the Nationals on June 8.
  • The last time we saw an MLB pitcher log as many as five complete games in a season was 2017 (Corey Kluber, Indians).
  • Alcantara’s 212 2/3 innings pitched lead MLB by a notable margin (The Cardinals’ Miles Mikolas is second at 187 1/3).
  • Alcantara has averaged 7+ inning in his 30 2022 starts.
  • Alcantara tied for the 2019 NL complete-game lead with two complete games.
  • Thus far in the 2022 season, only 0.6 percent of starts have resulted in a complete game (as opposed to 16.7 percent of Alcantara’s starts.

Here’s a historic perspective on complete games (I chose not to use the shortened 2020 season). Note: This chart, previously published in Baseball Roundtable has been updated to include Negro League records from 1920-48, which have been added to the MLB record book.,

As you might expect, the chart shows a steady decline in complete games.

Now, a few Baseball Roundtable musings on complete games.  (Note: This is not presented as criticism, just a look at how the game has changed.)

It wasn’t until 1955 that we saw an AL/NL leader in complete games with less than 20 finished starts (Whitey Ford, Yankees, 18 CGs).  And, 1980 was the first year that a league leader notched less than 14 complete games.  The last time we saw 20 complete games in a season?  Fernando Valenzuela in 1986.  James Shields, in 2011, became the first pitcher to reach double-digits (11) in complete games in a dozen years – and earned a reputation as an iron man.

Jack Taylor and Will White – Finishing What They Started.

Between 1901 and 1906 (Cubs and Cardinals),  Jack Taylor threw a record 187 consecutive complete games (with 15 relief appearances interspersed).  Then there’s Will White (Cincinnati), who, in 1879, completed a single-season record 75 complete games (in 75 starts).  White went 43-31 that year, with a 1.99 ERA and 680 innings pitched.  For his career, White completed 394 of 401 starts. 

How different is today’s game?  In 2021, the MLB co-leaders in complete games (Adam Wainwright, German Marquez, and Zach Wheeler) each threw three complete games.   In September of 1908, Walter Johnson threw three complete-game shutouts in four days – and might have done it in three days, except for baseball’s sabbath laws.

Cy Young – Library of Congress photo.

The record for career complete games belongs to Cy Young at 749.  Young completed 91.9 percent of his starts. The active leader in career games is Adam Wainwright, with 28 in 387 starts (7.2%) over 17 seasons.   Babe Ruth, by the way (to continue the Babe Ruth connection), tossed 107 complete games in 147 career starts. 

As complete games have dropped, the numbers of pitchers used in each game have risen.  In the 1950’s, when I started watching major-league baseball, you were likely to see four pitchers per game (the average in 1950 was 2.01 pitchers per team/per game).  In 2021, you were more likely to see between eight and nine players take the mound in a game (the average was 4.44 pitcher per team/per game). Through September 18 of this season, the average is 4.29 pitchers per team/per game.  Note: Starting pitchers are included in the count.

Jim Devlin, A Complete-Game Machine

In 1877, Jim Devlin of the National League’s Louisville Grays started and completed all 61 of the team’s games– the only pitcher ever to pitch all of a team’s innings in a season.  This, by the way, came one season after he started all but the final game of the Grays’ season (a record 68 consecutive games pitched in) and finished 66 of them.  Devin logged a total of 1,181 innings. Side Note: Sadly, Devlin’s career was cut short when he was banned after the 1877 season, as the result of a game-fixing scandal. 

—–Baseball Roundtable’s Take on the Decline in Complete Games—–

So, why the dramatic decline in complete games?

Five-man Rotations … and. more recently “openers” and “bullpen games.”

In baseball’s early days, teams got by with two or three primary starters. Even in the 1960’s a four-man rotation was pretty common. As we moved into the 1970s, teams started moving to five-man pitching rotations.  Fewer starts, fewer opportunities for wins, complete games, innings pitched.   (Notably, swifter travel  – trains not planes – contributed somewhat to this.  In the days of train travel, more travel time meant more days between series and fewer pitchers were needed. )

In 1968, when Bob Gibson went 22-9, 1.12 for the Cardinals, he tossed 28 complete games (13 shutouts) in 34 starts. 

 More recently, in a strategy first led by the Rays, teams are going to the use of relief pitchers as “openers,” sometimes followed by a primary pitcher and late-inning relievers – or even entire “bullpen” games, with a series of reliever each taking on one or two innings.

The “Quality” Start

In today’s game, six innings and three or fewer runs is a “Quality Start.”   Starting pitchers, as recently as the 1980’s, would have considered six innings pitched a day off.  The quality start has helped change the way fans (as well as managers and pitchers) look at starting pitchers’ performances. Pitchers simply are no longer  expected to finish what they start.  Consider this statistic. (Note: Negro League stats not yet incorporated.)

Average Innings Pitched Per Start

1920              7.4

1940             6.9

1960              6.4

1980              6.3

2000             5.9

2021              5.0

Through September 18 of this season, starters are averaging 5.2 innings pitched per start.

Brief Baseball Roundtable Rant

A quality start is defined as six innings pitched and three or fewer earned runs allowed. Through September 18, MLB’s average earned run average was 3.98. So, you can pitch below the league ERA average and earn a quality start.  

The Advent of the Save

Years ago, relief pitchers were mostly starters past their prime brought in to “mop up.”   In fact, the “save” was not even established as a statistic until 1969 (saves were awarded retroactively for seasons prior to 1969).  Today, relievers are more valued and respected then ever – which leads us to the next point – the rise of relief specialists.

The Rise of Relief Specialists

Today, not only does the manager look to the closer (primarily for the ninth inning), the bullpen also features key “set up” men, earmarked for the seventh or eighth innings.  And, not only do most teams have their seventh- and eighth-inning specialists, we also see “arms” in the bullpen ready for long- and middle-relief.  Recently, until the recent  change (requiring a pitcher to faced at least three batters or finish an inning), even one-batter (lefty or righty), specialists were stalwarts in MLB bullpens. No wonder managers are so quick with the hook.  They’ve got to keep that well-paid dollar bullpen happy.

The Dreaded Pitch Count

And, of course, there is the “pitch count,” considering the financial investment teams have in pitchers, the thinness of pitching staffs (we do, after all, now have thirty teams), pitchers are treated with great care, often held to pitch counts in the neighborhood of 100 – no matter how well they are throwing.  Pitchers simply are throwing less these days.

Phil Humber threw only one complete game in his eight-season MLB career – and it was a perfect game.  Why is it included in this pitch count section? He needed just 95 pitches to complete the outing. 

Strikeouts

The growing emphasis on strikeouts has also contributed to the decline in complete games (particularly when combined with pitch counts).  The fact is, it most often takes more pitches to rack up strikeouts than to pitch to weak contact.  (In most cases, it also requires an increased focus on velocity, also tougher on the arm.) Consider the record of Warren Spahn, who led the National League in complete games an MLB-record nine times, won 20 or more games in 13 seasons and led the league in strikeouts four times – yet averaged just 4.4 strikeouts per nine innings, never struck out 200 batters nor six batters per nine innings in a season.

Strikeouts Per Nine Innings

1900           2.4

1920            2.9

1940             3.7

1960             5.2

1980            4.8

2000             6.5

2021             8.9

Through September 18, the 2022 average is 8.5 whiffs per nine innings.

Sidebar – Innings Pitched Leaders

From 1950-59, Robin Roberts AVERAGED 301 innings pitched (and 23.7 complete games) per season.  And, if you pick any decade from 1900 through 1979, the average innings pitched for the league leaders was over or very near 300.  However, innings pitched have dropped significantly since Steve Carlton became the most recent pitcher to hurl 300 innings in (1980).  For the last decade, the average for league leaders has been shy of 250.  In 2021, Robbie Ray led the National League with 193.1 innings pitched.  

Here’s the chart of average innings pitched by league leaders (by decade) with major strike-shortened seasons deleted:

Decade                 Average Innings Pitched by League Leaders*

1909-09                                                350

1910-19                                                348

1920-29                                                318

1930-39                                                304

1940-49                                                305

1950-59                                                294

1960-69                                                303

1970-79                                                327

1980-89                                                279

1990-99                                                261

2000-09                                                244

2010-19                                                 231

*Negro Leagues with their short seasons not included.

______________________________

One final complete-game tidbit. Between My 14 and June 4, 1969, the Dodgers’ Don Drysdale pitched an MLB-record six consecutive complete-game shutouts,

________________________________

So, there are BBRT’s random musings about complete games.   I do kind of miss them, but that’s the way today’s game is played. Guess, I’ll have to take in a Sandy Alcantara start,

Primary Resources:  Baseball-Reference.com; MLB.com; Baseball-Almanac.com.

Baseball Roundtable … blogging baseball since 2012. 

100Baseball Roundtable is on the Feedspot list of the Top 100 Baseball Blogs.  To see the full list, click here.

I tweet (on X) baseball @DavidBaseballRT

Follow Baseball Roundtable’s Facebook Page here.  More baseball commentary; blog post notifications.

Member: Society for American Baseball Research (SABR); The Baseball Reliquary; The Negro Leagues Baseball Museum.


From Mackey to Mickey and Much More … A Look at MLB’s Switch-hitting Leaders

Who was the first switch-hitter not named Mickey Mantle to reach 40 home runs in a single MLB season?


On August 11, 1956, in the seventh inning of a Yankees’ 10-5 loss to the Orioles (in New York), Yankees’ CF Mickey Mantle took the Orioles’ Hal Brown deep to RF for a three-run home run – becoming the first MLB switch-hitter to reach 40 home runs in a season. Just over one month later (September 18, 1956), Mantle popped his fiftieth long ball of the campaign (off Billy Pierce in the eleventh inning of a 3-2 Yankees’ win in Chicago) – becoming the first switch- hitter to reach 50 home runs in a single season. (Mantle finished the year at .353-52-130; winning the Triple Crown.)

Mantle is still the only switch hitter to hit 50 home runs in a season. (He did it once again with 54 long balls in 1961). Mantle remained the only switch-hitter to reach 40 homers in a season for (appropriately) 40 years.  Since 1996, six switch-hitters have joined Mantle in the 40-home run club.

As noted above, the question leading into this post is “Who was the first switch-hitter not named Mickey Mantle to reach 40 home runs in a season?”

The answer is Mets’ catcher Todd Hundley, who hit his 40th round tripper of the 1996 season in the seventh inning of a Mets’ September 8 win over the Braves in Atlanta. (Side note: Another switch-hitter, the Braves’ Chipper Jones, in just his  second full MLB season, hit his 30th home run of the campaign in the same game. Jones, by the way, was at shortstop for that contest.)  It didn’t take long for a third switch-hitter to join the 40-homer club. Nineteen days after Hundley’s blast, the Padres’ switch-hitting 3B Ken Caminiti, hit his 40th long ball of the 1996 season.  Hundley finished the 1996 season at .259-41-112, achieving  would be his career high in home runs, RBI, runs scored (85), hits (149) and doubles (32).

Before we go on to look at some additional switch-hitting record holders, a little more about Todd Hundley. Hundley had some good baseball genes. He was the son of Randy Hundley, who played catcher  in 14 MLB seasons (1964-77) – and was a one-time All Star (1969 Cubs). The younger Hundley also played in 14 MLB seasons (1990-2003) and outdid his father with two All Star selections and a .234-202-599 stat line to his father’s .236-82-281.

Todd Hundley was a second-round draft pick (Mets) in 1987 (out of William Fremd High School). He made his major-league debut (as a 20-year-old) on May 18, 1990. Over his 14-season MLB career (1990-2003 … Mets, Dodgers, Cubs), he topped 20 home runs in four seasons and 100 RBI once. Hundley’s best MLB seasons were clearly 1996 and 1997. He followed his 1996 .259-41-112 stat line with .273-30-98 in 1997.

One – or 41 – for the Record Books

In 1996, when Todd Hundley hit 41 home runs, they were the most home runs in a season by a player in the catching position. Johnny Bench (who hit right-handed) had hit 45 in 1970, but six of those came when he was in the lineup as an outfielder and one as a first baseman.  Right-handed hitting Javy Lopez broke Hundley’s record in 2003 with 42 long balls as a catcher (43 overall), still the most home runs in a season while in the lineup as a catcher.  Right-handed hitting Salvador Perez hit 48 home runs in 2012 (the most for a player playing primarily as a catcher), but 15 of those came as a DH.

Now let’s get back to a look at switch-hitting leaders.

Note: Batting average leaders in 100+ game seasons: Tuck Turner, 1894 Philadelphia Phillies (National League), .418 (Turner played 82 of 132 games);  Tommy Tucker, 1889 Baltimore Orioles (American Association), .372; Roger Connor, 1885 New York Giants (National League), .371.  Mickey Mantle‘s .365 average for the 1957 Yankees is the highest average for a switch-hitter in a post-1900 season in which his team played 100 or more games.  

Biz Mackey – Career and Single-Season Batting Average

Photo: 1924_Negro_League_World_Series.jpg: J.E. Mille[r], K.C.derivative work: Delaywaves talk • contribs, Public domain, via Wikimedia Commons

Hall of Famer Biz Mackey was not only a great defensive catcher, but also a versatile fielder and  an offensive force. You’ll find his average at the top of the list for switch-hitters in both the single-season and career categories. Thank you, MLB for adding Negro League stats from 1920-1948 to the MLB  record books. Mackey played in 22 seasons (all in the Negro Leagues), suiting up at every defensive position (617 at C; 60 at 1B; 33 at 2B; 60 at 3B; 70 at SS; 145 in LF; 2 in CF; 22 in RF). He even took the mound seven times (three starts), albeit to a 7.52 ERA.  From 1920 through 1929, Mackey hit .348-45-454 in 582 games – never averaging below .312 in any season. He played in five East-West All Star Games and in 26 Negro Leagues post-season games (hitting .327).

Just Ask Another Hall of Fame Catcher How He Measured Up

“In my opinion, Biz Mackey was the mater of defense of all catchers,”

                         Hall of Famer Roy Campanella

                          (From Biz Mackey’s Baseball Hall of Fame Bio)

________________________________________

Mickey Mantle – Career and Single and Season Home Runs

Mickey Mantle is the power leader among MLB switch hitters. There have been just two seasons of 50 or more home runs by switch-hitters in MLB history and both belong to Mantle. There also have been just  11 seasons of 40 or more homers by switch-hitters in MLB history (including Mantle’s two 50-HR seasons) and Mantle has four of those.

He is, as expected, also at the top of the switch-knitting career home runs list.  Mantle played in 18 MLB seasons (1951-68), going .298-536-1,509. The Hall of Famer was an All Star in sixteen seasons, a three-time AL MVP and  a one-time Gold Glover. He led the league in home runs four times, runs scored five times, total bases three times; RBI once and batting average once. Over his career, Mantle hit 30 or more home runs in nine campaigns.

A Career Saved

When Mickey Mantle was 14-years-old, osteomyelitis (aggravated by a football injury) led doctors to recommend amputation of Mantle’s leg. His parents sought a second opinion and the condition was treated with heavy doses of penicillin – saving the leg and Mantle’s future in sports.

Mantle holds the World Series records for home runs (18), RBI (40); runs scored (42), total bases (123) and walks (43).

____________________________________

Mark Teixeira and Eddie Murray – Single-Season and Career RBI Leaders

Photo: Keith Allison, CC BY-SA 2.0 <https://creativecommons.org/licenses/by-sa/2.0>, via Wikimedia Commons

Mark Teixeira sent the mark for single-season RBI among switch hitters in 2005 – a season in which the Rangers’ first baseman played all 162 games and hit .301-43-144. Teixeira played in 14 MLB seasons (2003-2016 … Rangers, Braves, Angels, Yankees). He was a three-time All Star, hit 30+ home runs in nine season and drove in 100+ runs in eight. He finished with a.268-409-1,298 stat line. He also won five Gold Gloves.

Those Were the (College) Days My Friends

In three seasons at Georgia Tech (1999-2011), Mark Teixeira played in 140 games, hitting .409, with 36 home runs and 165 RBI. He was the fifth player chosen in the June 2001 MLB draft.

Teixeira and Nick Swisher share the record for the most times hitting a home run from both sides of the plate in a single game at 14.


Hall of Famer Eddie Murray tops all switch hitters in career RBI at 1,917 (in 21 MLB seasons – 1977-97 … Orioles, Dodgers, Mets, Indians, Angels). While he drove in 100 or more runs in six seasons, he only led the league in RBI once, with 78 in the strike-shortened 1981 season. The Hall of Famer and eight-time All Star is also one of just two switch-hitters to reach 500 career home runs. He hit 30 or more home runs in five seasons and 20 or more in another 11.  Murray was the 1977 AL Rookie of the Year, an All Star in eight seasons and a three-time Gold Glover at first base. Over his career, Murray hit 19 Grand Slam home runs, the most by any switch-hitter.

Eddie Murray holds the MLB career record for career sacrifice flies with 128.


Pete Rose and Willie Wilson – Single-Season and Career Base Hits

Pete Rose can be fond atop the switch-hitter leaderboard in single-season and career base hits. In fact, he leads all batters in MLB history in career safeties. Rose played 24 MLB seasons (1963-86 … Reds, Phillies). He is the MLB leader in games played (3,562); plate appearances (15,890); at bats (14,053); and hits (4,256).

Pete Rose was an All Star Game starter at five different positions: 1B, 2B, 3B, LF, RF.

Rose’s  final career line was .303-160-1,314, with 2,165 runs scored. He was a 17-time All Star and led the league in hits seven times (ten seasons of 200+ hits); runs four times; doubles five times; and batting average three times.

For the Love of the Game

“I’d walk through hell in a gasoline suit to play baseball.

                                                 Pete Rose

Tied with Rose atop the single-season leader in base hits in season (among switch-hitters) is Willie Wilson, who collected 230 safeties in 1980 (for the Royals), while putting up a .326-3-49 line with a league-topping 133 runs scored. Wilson played in 19 MLB seasons (1976-1994 … Royals, Cubs, A’s). The two-time All Star won one batting title, led the league in hits once, triples four times and stolen bases once. He retired with a .285-41-585 stat line, with 1,169 runs scored and 668 stolen bases. He stole 30 or more bases in 11 seasons (forty or more in seven of those seasons), with a high of 83 (in 95 attempts) in 1979.

A Surprise on the “Hit List”

Omar Vizquel recorded the fourth-most MLB base hits among switch hitters (44th All Time), with 2,807 safeties over 24 seasons (1989-2012 … Indians, Mariners, Giants, White Sox, Rangers, Blue Jays).  He hit .272 over 2,968 games – hitting .300 or better in just one season.

__________________________________________________

Other Switch-Hitter Leaders:

Runs Scored:  Season:  Max Carey, 1922 Pirates (140).    Career: Pete Rose (2,165)

Doubles: Season: Jose Ramirez, 2017 Indians (56). Career: Pete Rose (746)

Triples: Season: George Davis, 1893 Giants (27). Career: Roger Connor (293)

Total Bases: Jimmy Rollins, 2007 Phillies (380). Career: Pete Rose (5,752)

Primary Resources: Baseball-Reference.com; Baseball Almanac.com; The BaseballCube.com; Mickey Mantle SABR bio by James Lincoln Ray.


Baseball Roundtable – Blogging Baseball Since 2012. 

BASEBALL ROUNDTABLE ON THE TOP 100 BASEBALL BLOG LIST

100Baseball Roundtable is on the Feedspot list of the Top 100 Baseball Blogs.  To see the full list, click here.

I tweet (on X) baseball @DavidBaseballRT

Follow Baseball Roundtable’s Facebook Page here.  More baseball commentary; blog post notifications.

Member: Society for American Baseball Research (SABR); The Baseball Reliquary; The Negro Leagues Baseball Museum.

Mike Trout’s Seven Straight Games with a Long Ball – and Those Who Did Him One Better

The Thirteenth unlucky for Mike Trout … and Cleveland fans

Mike Trout .. . Hit long ball, round bases, high five repeat.
Photo by Keith Allison

Yesterday (September 13, 2022), Mike Trout went zero-for-three (one walk) as his Angels lost to the Guardians 3-1 in Cleveland. While I’m sure the Cleveland fans enjoyed the win, they did miss the chance to see a bit of MLB history. Trout’s zero-for-three ended a streak of seven straight games in which he had gone yard – leaving him one shy of the record consecutive games with a home  run. Surprisingly, during his hot streak, the Angels went 3-4 (outscoring their opponents just 33-28, with Trout driving home one-third of the Angels’ tallies).

Trout’s offensive outburst should not be too much of a surprise.  A first-round (25th overall) 2009 draft pick out of Millville (NJ) Senior High, Trout made his MLB debut July 8, 2011 (at the age of 19).  In three minor-league seasons, the teenager had risen from rookie ball to Double-A, hitting a combined .338, with 22 home runs and 102 stolen bases in 266 games.

As high school senior,  Mike Trout hit .531 (81 at bats), with 18 home runs and 21 steals.

While he hit just .220 in 40 2011 games for the Angels, Trout became a regular in the Angels’ outfield in 2012, hitting .326-30-83, leading the league in runs scored (129) and steals (49) – and winning Rookie of the Year honors. To date, he has been a 10-time All Star (missing just 2020) and three-time AL MVP.  He had topped hit 30 or more home runs in seven seasons (35 so far this year), driven in 100+ runs three times, scored 100+ runs in seven campaigns, hit over .300 in six seasons and stolen 30 ore more bases three times. Even without the eighth consecutive games with a home run, he is building quite a Hall of Fame Legacy.

With that on the books, let’s take a look at the players who are on the short list of those with homers in eight consecutive games.  Dale Long, Don Mattingly and Ken Griffey, Jr. (Side note:  All thee began their professional careers as teenagers. Not really that important, but the kind of coincidence The Roundtable notices.)

______________________________________________________

A brief interruption before we return to our regular programming.

Time here for a short rant about #HowTheGameHasChanged. Yesterday, I was at a Twins game and Twins’ rookie starter Joe Ryan coasted through the first seven innings with a no-hitter (versus the Royals). After seven frames, he had given up two walks, fanned nine, tossed 106 pitches and was enjoying a 6-0 lead.

My very clean scorecard during Kershaw’s outing and a very clean scoreboard during Ryan’s.

As the eighth opened, Twins’ Rocco Baldelli brought in rookie reliever Jovani Moran (to significant booing from the crowd). Now, I didn’t join in the chorus of displeasure, but (as a fan) I was not really happy with the decision. Still, we could at least hope for the Twins’ first-ever combined no-hitter (and by two rookies no less). Alas, it was not to be, as Moran lost the no-no with one out in the ninth – giving up two walks, followed by an RBI double to Bobby Witt, Jr. (Moran eventually gave up a another hit and a total of three runs in the inning.)

All of this took me back to a game I attended on April 13 – with the Twins facing the Dodgers at Target Field. Despite the fact that the Twins were down 3-0, there was plenty of drama on the field and plenty of excitement in the crowd – as many of us anticipated a chance to see Dodgers’ starter Clayton Kershaw try for MLB’s 24th-ever Perfect Game.  After seven innings (Does this timing sound familiar?), Kershaw had thrown just 80 pitches (53 strikes) and had fanned 13 batters – with only three balls had been hit out of the infield. He was cruising and it was a masterful performance to watch.

Like Ryan, Kershaw did not come out to pitch the eighth. Dodgers’ manager Dave Roberts instead put in Alex Vesia. The change was met with a chorus of boos, from Twins’ fans and a large contingent of Dodger Faithful seated behind the third base dugout.

Now, there’s never been a combined Perfect Game, so I had a bit of hope. One out and five pitches after Vesia took the mound, Twins’ catcher Gary Sanchez lined a single to right and the Perfect Game and even the no-hitter were gone. (The Twins, ultimately, lost 7-0 and Sanchez’ single was their only safety.)

Side note:  I later learned, via the Elias Sports Bureau, that only once before ( since 1900) has an MLB pitcher been pulled after the seventh inning with a Perfect Game intact.  Both times, Roberts was the manager.  (The first was on September 10, 2016, when he pulled Rich Hill – a reported finger issue –  after seven innings with Perfect Game intact against the Marlins (and the Dodgers up 5-0). Hill had thrown 89 pitches (62 strikes) and fanned nine. Hill was replaced by Joe Blanton and ten pitches and two outs later, Marlins’ LF Jeff Francoeur collected the first of two Miami hits in the game.

In both the Ryan and Kershaw  games, I found myself trying to imagine what would have happened in the same situation with the likes of  Jack Morris, Bob Gibson or Don Drysdale on the bump.  I understand managers looking ahead and trying to protect their pitchers, so I can’t be too critical.  But, as a fan, I can be disappointed when a pitcher is pulled with a late-inning no-hitter or perfect game intact.  I’ll resist starting the next sentence, “Back in the day ….”

_________________________________________________

Now, back to the three players who share the record for consecutive games with a home run at eight.

Dale Long … 1956 Pirates

Dale Long’s path to the big leagues was not an easy one. Signed, in 1944,  at age 18, after a stint in the Navy, Long  made his major-league debut on April 21, 1951 (after seven minor-league seasons … and 11 minor-league teams with four different franchises.). He was back in the minors by mid-season (after hitting .231-3-12 in 44 games for the Pirates and Browns).

He didn’t make its back to the MLB diamond until 1955, again with the Pirates. In his first season as a big-league regular, the lefty first basemen hit .291-16-79  and the led NL in triples with 13.

The following season – the year of his eight-game home run streak – Long made his only All Star team, hitting .263-27-91 in 148 games for Pittsburgh.  (The 27 long balls and 91 RBI would prove to be career highs.

Overall, long played ten MLB seasons (Pirates, Browns, Cubs, giants, Yankees, Senators,), hitting .267-132-467 in 1,013 games. He hit 20 or more homers in four season and .290 or better twice.

The Pirates went 7-1 during Long’s  home run streak, outscoring their opponents 44-22, with Long driving in 19 of the 44 runs.

______________________________________________

Don Mattingly, 1987 Yankees

Don Mattingly had his eight-game home run streak in 1987, in the midst of his fourth straight All Star campaign, third straight season of 30 or more home runs, fourth  straight season of 100+RBI and fourth straight season hitting .325+. He was, in fact, at the peak of his career. The previous three seasons, he had led the league in hits twice, doubles three times, RBI once, batting average once, total bases twice and slugging percentage once.

Mattingly was  19th round draft choice, out of Reitz Memorial High School. He had worked his way from Low-A to Triple-A over four seasons (1979-82), hitting .332 in 457 games. He had yet to develop his power stroke, however, with only 20 home runs on his resume.  He made his MLB debut, as a 21-year-old, for the Bronx Bombers on September 8, 1982 and earned a spot as a regular in the Yankee lineup by the following June. In 1984, his first full MLB season, the 23-year-old Mattingly was the AL batting champ – putting up a .343-23-110 line.  He went on to a 14-season MLB career (1982-95), all for the Yankees – hitting .307-222-1,099; was an All Star six straight seasons (1984-89); earned nine gold Gloves at first base; and was the 1985 AL MVP.

In 2020, Don Mattingly was the NL Manager of the Year – leading the Marlins to a 31-29 record – good for second place (NL East) in the COVID-shortened season.

Despite Mattingly’s eight-game output – 10 home runs and 21 RBI – the Yankees only went 5-3 in his streak. (They did outscore their opponents 55-36, but that included a 13-4 win over the Twins and a 12-3 victory over the Rangers.)


_____________________________________________

Ken Griffey, Jr., 1993 Mariners

Ken Griffey Jr. was signed, as a 17-year-old, in the first round (first overall) of the 1987 draft (Mariners).

Ken Griffey Jr. (Archbishop Moeller High School, Cincinnati) was the 1987 U.S. High School Baseball Player of the Year. 

As a 17-year-old, Griffey hit .313-14-40, with 13 steals at Low-A Bellingham (54 games). The following season, he hit .325-13-52, with 36 steals at A and Double-A (75 games.)

In 1989, at 19-years-old), Griffey was a regular in the Seattle outfield.  The rest is history.  He went on to a 22-season, Hall of Fame career – hitting .284-620-1,836, with 184 steals in 2,671 games. Griffey hit 40 or more home runs in seven seasons, with two seasons (1997-98) of 56 roundtrippers. He also collected 100 or more RBI eight times. He was a 13-time All Star, ten-time Gold Glover and the 1997 AL MVP (when he hit .304, and led the league with 56 home runs, 125 runs scored, 147 RBI and 398 total bases.

During Griffey’s 1993 home run streak, the Mariners won five of the eight games – outscoring their opponents by just four runs  52-48.


______________________________________________

Just a Little (Big, Really) Baseball Roundtable Long Ball Bonus

Most fans recognize 1968 as “The Year of the Pitcher.”  The overall MLB earned run average was 2.98; Bob Gibson put up a 1.12 ERA; Denny McLain won 31 games; only six qualifying MLB hitters hit .300 or better and Carl Yastrzemski won the AL batting title with a .301 average. Pitching was so dominant, MLB lowered the mound five inches for the 1969 season.

Yet, somehow – in the midst of all this pitching dominance – the Washington Senators’ big (6’8” – 260-lb.) OF/1B Frank Howard put together one of the most explosive offensive weeks in MLB history. From Sunday May 12 through Saturday May 18, in just 25 plate appearances (in six games), Howard banged out thirteen hits – including ten home runs and one double – and drew one walk (for a .542 average).  He also scored ten times and drove in 17 tallies. Side note: Surprisingly, the Senators went 3-3 over Howard’s streak.  Howard’s ten home runs remain MLB’s record for home runs in a week.  

Howard’s game lines during the streak looked like this:

  • May 12 … two-for-four, two runs scored, two RBI, two home runs.
  • May 14 … three-for-four, two runs scored, three RBI, two home runs.
  • May 15 … two-for-four, one run scored, two RBI, one double, one home run.
  • May 16 .… two-for-four, two runs scored, four RBI, two home runs.
  • May 17 … one-for-four, one run scored, two RBI, one home run.
  • May 18 … three-for-five, two runs scored, four RBI, two home runs.

Howard picked on some pretty good hurlers during his streak.  Three of the long balls came off the Tigers’ Mickey Lolich,  who went 17-9, 3.19 on the season and won three games in the 1968 World Series. Another pair of the record-setting round trippers came off “Sudden” Sam McDowell, who – while he only went 15-14 that season – put up a 1.81 earned run average and led the AL with 283 strikeouts.   Howard also showed he could “hit ‘em anywhere.” Only two of the ten long balls came at home – and his streak also included home runs in Boston, Cleveland and Detroit.

Howard came into the streak with a.300 average on the season (which he raised to .347 during the six games). Notably, he didn’t “come in hot,” he had  just three hits (.130 average) over his previous six games.

Primary Resources:  Baseball-Reference.com; MLB.com; Elias Sport Bureau.


Baseball Roundtable – Blogging Baseball Since 2012. 

BASEBALL ROUNDTABLE ON THE TOP 100 BASEBALL BLOG LIST

100Baseball Roundtable is on the Feedspot list of the Top 100 Baseball Blogs.  To see the full list, click here.

I tweet (on X) baseball @DavidBaseballRT

Follow Baseball Roundtable’s Facebook Page here.  More baseball commentary; blog post notifications.

Member: Society for American Baseball Research (SABR); The Baseball Reliquary; The Negro Leagues Baseball Museum.