Off-Season Musings … More Rarities and Oddities … 20-Loss Seasons

The Reverse Unicorn

Since 1980, only two pitchers have “achieved” twenty or more losses in a single season. In that same span, there have been 131 pitcher seasons of twenty or more wins.

Regular readers of Baseball Roundtable know how my mind tends to wander during the off-season – leading to the exploration of a wide range of baseball topics (particularly rarities and oddities). Admittedly as “One thing seems to lead to another,” these posts can at times seem like watching a series of unrelated slides (I hope most of you remember slides).  Each post, however, can be traced to an overarching theme. Most recently, there were posts on 20-game winners (click here for that one), 100-RBI seasons (click here) and zero-home run seasons (click here).

This foundation of this post will a what I consider a reverse unicorn, the increasingly rare pitcher-seasons of 20 or more losses.

How rare have 20-loss seasons become?  As noted earlier, they have been only two 20-loss seasons since 1980.  The last 20-loss campaign belongs to the Tigers’ Mike Maroth, who went 9-21, 5.73 in 2003. (More on that later). As the chart below shows 295 of the 499 20-loss seasons (59.1%) occurred before 1900 … and the appearance of these reverse unicorns” has dwindled steadily since.

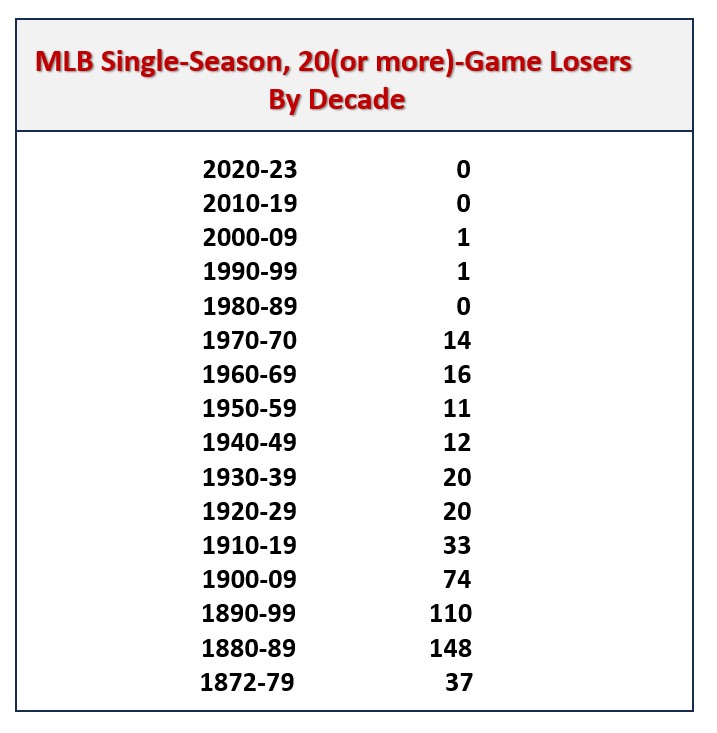
The 1884 season saw the most 20-loss campaigns, as 25 pitchers reached or exceeded twenty defeats. (The 1884 season featured 33 majo- league teams … National League, Union Association and American Association.) Notably, 12 of those pitchers also won 20 or more games and eight finished above .500.

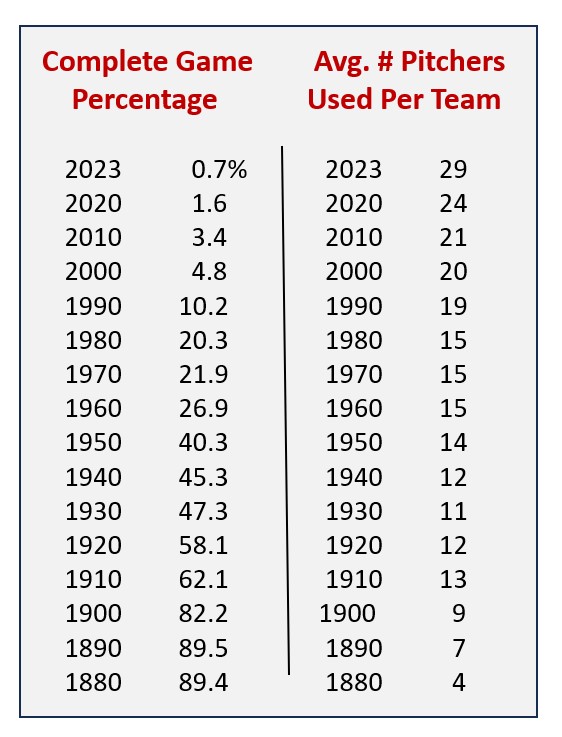
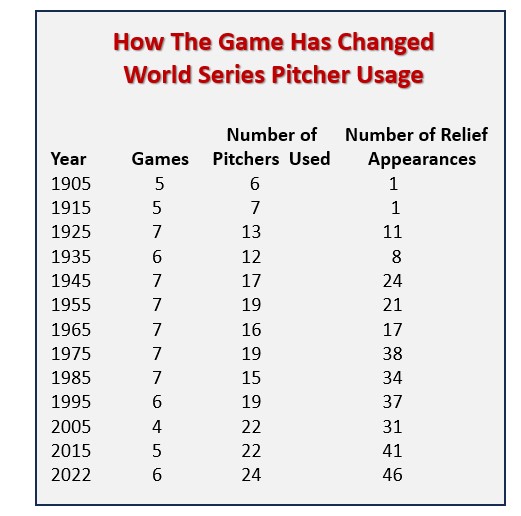
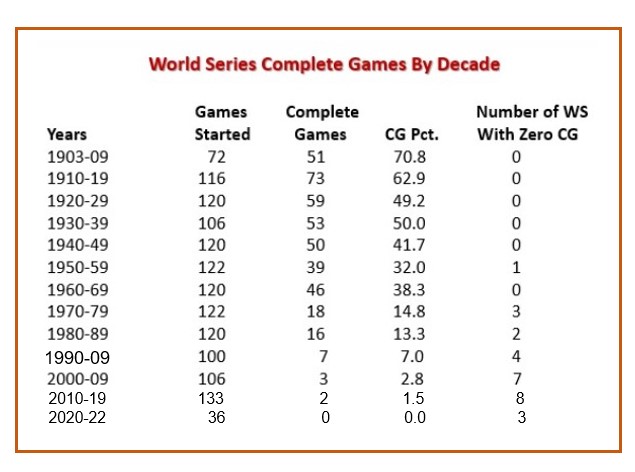
There are some pretty obvious reasons for this, centered around pitcher usage.  Over the years, such factors expanding rotations (from two-to-five or more pitcher rotations), larger pitching staffs and relief specialists (middle men, set-up men, closers), pitch counts (and fewer complete games) all have helped make it harder for a pitcher to reach 20 losses (or twenty wins, for that matter). Consider, in 1890, 37 pitchers started 35 or more games (eight of those had 50-plus starts). In 2023, only one pitcher – Mike Mikolas of the Cardinals – accrued 35 starts. We’ll get to why I picked 35 starts as a focus point in a bit.

That chart below illustrates some the change MLB has seen – as complete games have plummeted and the number of pitchers used by teams each season had risen. In sheer raw numbers, 2003 saw 35 complete games in 4,869 starts; 1960 saw 665 complete games in 2,472 starts; and 1890 saw 2,879 complete games in 3,218 starts.

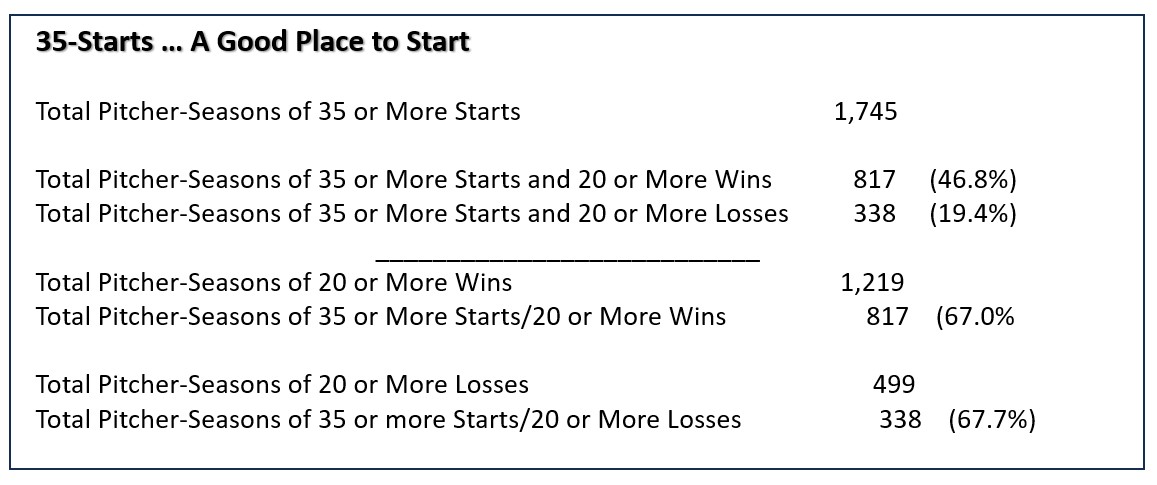
Now, as to my observation of the “sweet spot” for 20 losses (or twenty wins) – historically two of every three seasons of twenty or more losses (or twenty or more wins) belong to a pitcher with 35 or more starts.

Now, this post is about 20-game losers, so I thought I better start to steer this ship back in that direction. I went back to 1974, the last season MLB saw at least five 20-game losers: Steve Rogers (Expos, 15-22, 4.47), Bill Bonham (Cubs, 11-22, 3.86), Randy Jones (Padres, 8-22, 4.45), Mickey Lolich (Tigers, 16-21, 4.15) and Clyde Wright (Brewers, 9-20, 4.42).  A few comparisons:

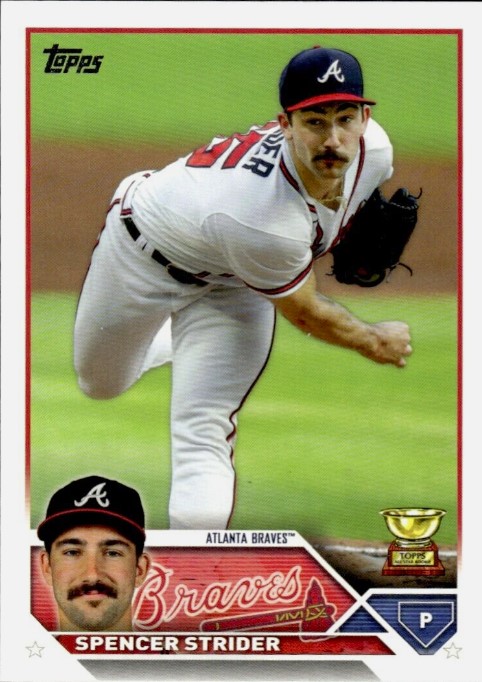
  • These five (the five losingest pitchers in MLB in 1974) had a cumulative 181 starts, with 67 complete games and 28 complete-game losses. MLB’s five winningest pitchers in 20023 (Spencer Strider, Zac Gallen, Chris Bassitt, Zach Elfin and Justin Steele) had 160 starts, two complete games and zero complete-game losses.
  • 1974’s five 20-game losers had 67 complete games and 28 complete-game losses, while all of MLB saw just 35 complete games and seven complete-game losses in 2023.

A Unicorn

The Kansas City Royals’ Jordan Lyles tied for the major-league lead in complete games in 2023 (with three).  All three of his complete games were losses – and I can find no other instance of the MLB leader in complete games recording not a single complete-game victory. Lyles’ final line on the season, 6-17, 6.28.

Now, let’s look at some rarities and oddities among 20-game losers.

Pud Galvin – King of the 20-Game Losers

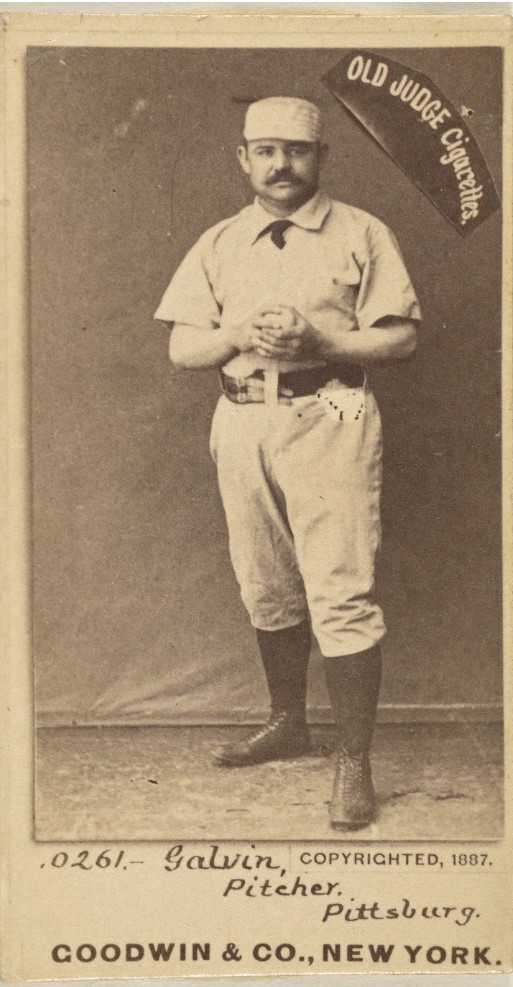
Photo: Goodwin & Company, CC0, via Wikimedia Commons

If the corps of 20-game loser had a king, his name would be James Francis “Pud” Galvin – who holds the MLB record for 20-loss seasons at ten, and who rang them up consecutively 1879-1888. Galvin, however, was clearly no loser – pitching his way into the Baseball Hall of Fame with a 365-310, 2.85 record over 15 MLB seasons (1875, 1879-1892 … St. Louis Brown Stockings, Buffalo Bisons, Allegheny City, Pittsburgh Burgers, St. Louis Browns.)

_______________________________

Pud Galvin recorded MLB seasons of twenty or more losses in the National League, American Association and Players League.

_______________________________

In his ten-year streak of season with 20 or more losses, Galvin seven times won more games than he lost. Galvin was known for pinpoint control of his fastball, fine fielding and an exceptional pickoff move that spurred many protests from opposing players, coaches and managers.

Galvin’s best seasons were 1883 and 1884, with the National League Buffalo Bisons.  In 1883, Galvin went 46-29, with a 2.72 earned run average and led the league in games (76), starts (75), complete games (72), shutouts (five) and innings pitched 656 1/3.  He followed that up with an 1884 campaign that again included 46 wins (22 losses), 71 complete games in 72 starts, 636 1/3 innings pitched and a league-leading 12 shutouts.  It truly was a different game back then. Consider Buffalo had a 116-92-5 record over those two seasons and Galvin started 148 (80%) and completed 147 of those 183 games.

Those Were The Days, My Friends

During his streak of ten consecutive 20+loss season, Galvin went 301-253, 2.71 and threw 535 complete games in 573 starts.

During his career, Galvin had ten seasons of 20 or more wins and ten seasons of 20 or more losses.  He reached both figures in nine seasons. Surprisingly, he never led his league in wins or losses.

__________________________

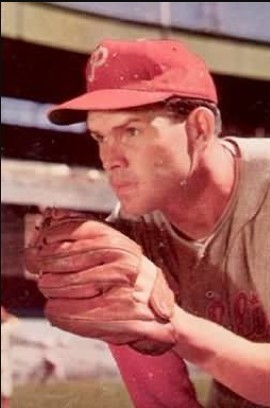
The Most Recent 20-Game Loser – Mike Maroth

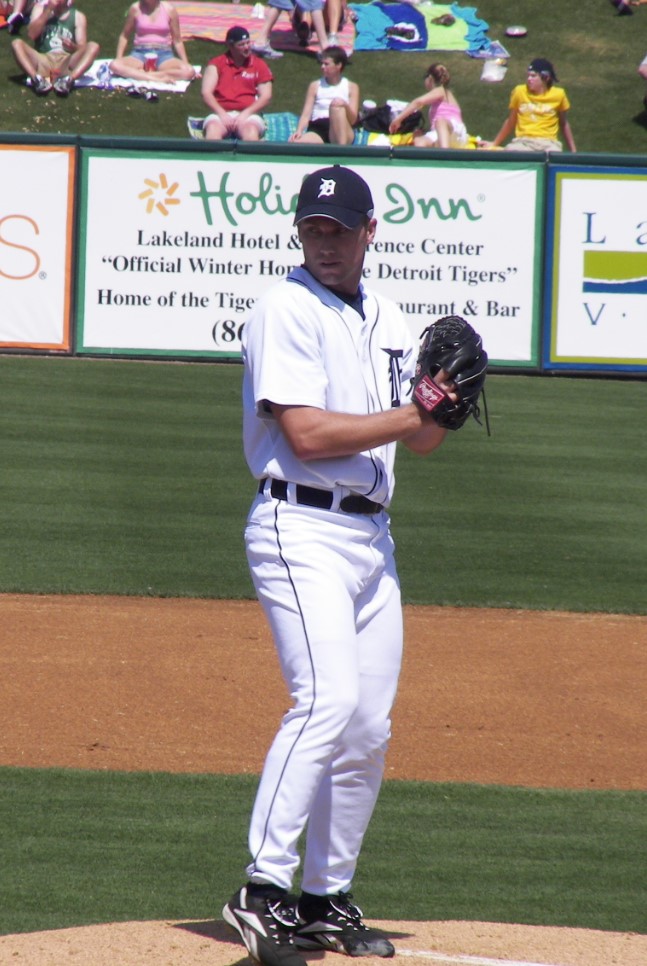
Photo: Wknight94, CC BY-SA 3.0 <http://creativecommons.org/licenses/by-sa/3.0/>, via Wikimedia Commons

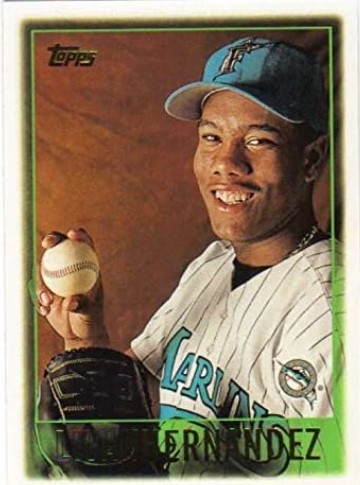
Southpaw Mike Maroth is the most recent 20-game loser.  Maroth went 9-21, 5.73 for the 2003 Tigers, a team that went 43-119 and finished in last place (47 games off the pace) in the AL Central Division. Maroth may have been the “ace” of the Tiger staff (he was the Opening Day starter). Maroth led the Tigers in wins, and starts – no other Tiger hurler won more than six games that season.

Consistency

After ten starts, Maroth was 0-9, 5.73 (right where his season-ending ERA stood).

Maroth had a six-season MLB career (2002-07 … Tigers, Cardinals), going 50-67, 5.05.

______________________________

Searching for a Won-Lost Rarity

Looking through records, I found that 126 of the 499 seasons (25.3%) of 20 or more losses saw the pitcher lead the league in losses. No rare air there.  Twenty of those 499 seasons (four percent) saw a pitcher with 20 or more losses lead the league in wins. Rarer, but hardly unicorn status.  Ah, but wait, how about 20-game losers who led their league in both wins and losses?  Bingo, just two!

Jim Whitney, 1881 Boston (National League)

Jim Whitney, as a hard-throwing 23-year-old rookie, went 31-33 for the 1881 Boston NL squad, leading the National League in both wins and losses. He put up a 2.48 earned run average (the league average was 3.13) and led the NL in games (66), starts (63) and complete games (57). Whitney went on to a 10-season MLB career (1881-1890 … Boston, Kansas City Cowboys, Washington Nationals, and Indianapolis Hoosiers and the American Association Philadelphia Athletics).  He had five seasons of 20 or more wins and seven seasons of 20+ losses – producing a career stat line of 191-204, 2.97.

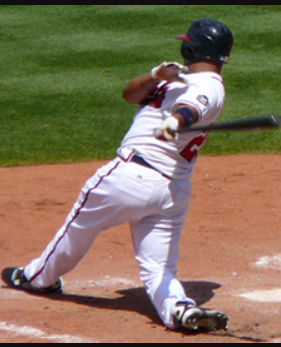
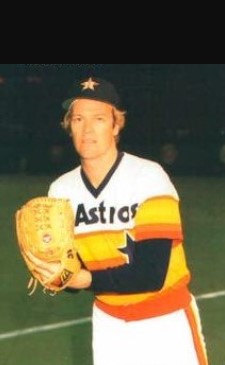
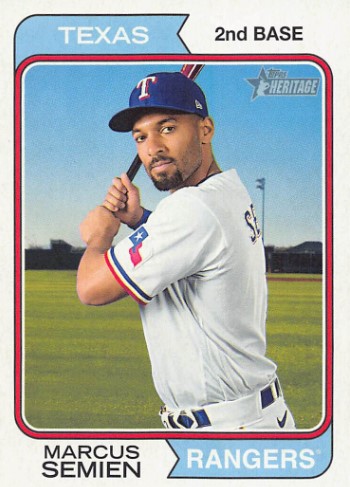
Phil Niekro, 1979 Atlanta Braves

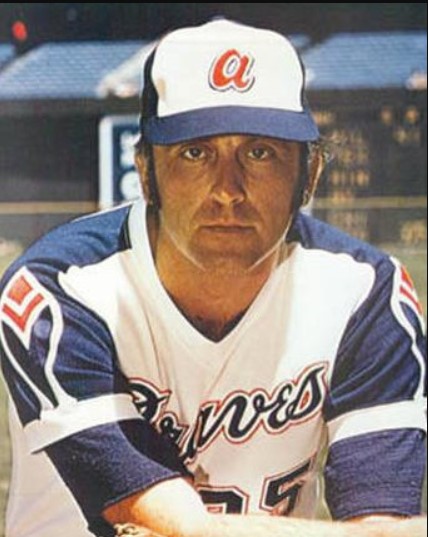
Photo: Texas Rangers via tradingcarddb.com, Public domain, via Wikimedia Commons

In 1979, knuckleballer – and future Hall of famer – Phil Niekro became just the second pitcher to lose 20 or more games and lead his league in wins and losses in the same season. Pitching for a Braves’ squad that went 66-94, Niekro went 21-20, 3.39, leading the NL in starts (44), complete games (23), innings pitched (342) – as well as in home runs allowed (41), walks (113) and hit batsmen (11).  Adding to the oddity, Niekro tied for the NL lead in wins … with his brother Joe, who went 21-11 for the Astros. Phil Niekro hovered around .500 all season He was 3-4 as of May 1; 5-8 as of June 1; 10-10 as of July 1; 14-13 on August 1. He went into the season’s final month at 17-17 and went 4-3, 2.65 in September to close out a 21-20.

A Recent Rarity

Phil Niekro is the last MLB pitcher to lose 20 games in a season and still have a .500+ winning percentage.  Before Niekro, that distinction belonged to Walter Johnson, who went 25-20 for the 1916 Washington Nationals.   

Niekro pitched in 24 MLB seasons (1964-87 … Braves, Yankees, Indians, Blue Jays).  He went 318-274, 3.35 and recorded 245 complete games in 716 starts. He was a five-time All Star and three-time 20-game winner (leading the NL in wins twice).  He also led the NL in winning percentage once, starts four times, complete games four times, innings pitched four times and strikeouts once. On the flip side, he led the league in losses four times (twice losing 20 games in a season), home runs allowed four times, walks three times, hit batsmen three times and wild pitches three times.

________________________________

Fewest Starts in a 20-loss Season …. 20 – Les German

In 1896, Les German split his season between the NL New York Giants and Washington Senators – going 2-20, 6.43.  He started 20 games and relieved in eight. German pitched six MLB seasons (1890, 1893-97), going 34-63, 5.45.

Fewest Wins in a 20-loss Season1 – John Cassidy & Jack Nabors

John Cassidy went 1-21. 3.03 in 1875, for the National Association Brooklyn Atlantics. It was the 20-year-old’s rookie season. He forged an 11-season MLB career (1875-1885 … Brooklyn Atlantics, New Haven Elm Citys, Hartford Dark Blues, Chicago White Stockings, Troy Trojans, Providence Grays, Brooklyn), but only pitched in two seasons 1875 and 1877 (two games). As an outfielder/first baseman, he hit .246-5-191 over his career.,

John Cassidy’s .045 winning percentage in 1875 is the lowest ever for a pitcher who lost 20 or more games in a season.

Jack Nabors went 1-20, 3.47 for the 1916 Philadelphia Athletics. It was the righthander’s only full MLB season, (He pitched in ten games for the Athletics as a 27-year-old rookie in 1915 and in two games in 1917.)  In that 1916 season, he pitched in 40 games (30 starts) and had 11 complete games.

A Good Start – The Finish, Not So Much

Jack Nabors’ only win in 1816 came in his first start of the season (April 22), when he beat the Red Sox 6-2.  He threw a nine-inning complete game: eight hits, two runs (unearned), two walks and four whiffs. Little did he know it would be the only “W” he would see by his name in his MLB career.  Nabors’ career record was 1-25, 3.87 (52 games, 37 starts, 13 complete games). 

_____________________________

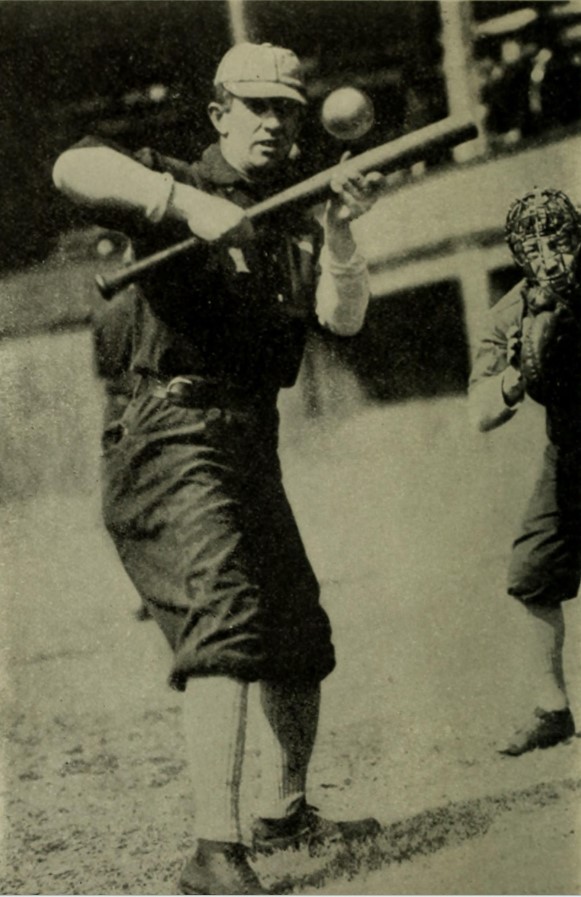
Most Wins By A Pitcher ins a Season of Twenty or More Losses – 52, Guy Hecker, 1885 Louisville Colonels, American Association

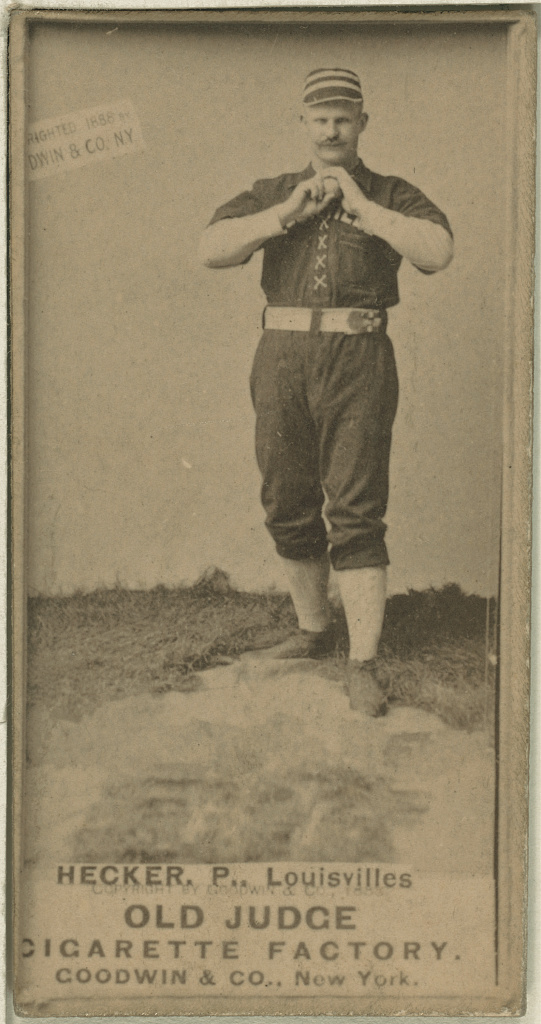
Photo: Goodwin & Co., sponsor, Public domain, via Wikimedia Commons

First, a look into the search for a rarity that led to this portion of the post. (This is also a “one thing leads to another” example of Baseball Roundtable and the statistical rabbit hole.)   As I scoured through stats, I saw that, in 107 (21.4%) of MLB’s 499 20-loss seasons, the pitcher put up a winning percentage of .500 or better. I also noted that the 1884 season saw the most 20-loss campaigns, as 25 pitchers reached or exceeded twenty defeats and that nine of those pitchers (36 %) finished at .500 or better.   (The 1884 season featured 33 major-league teams … National League, Union Association and American Association.) No rarities here.  But 1884, did turn up some 20-game loser rarities.

The most wins by a pitcher in a season with 20 or more losses is 52 by the 1884 Louisville Colonels’ (American Association) Guy Hecker (52-20, with a 1.80 earned run average).  That season, Hecker led the AA in wins, earned run average, games (75), starts (73), complete games (72), innings pitched (670 2/3), hits allowed (526) and strikeouts (385). As you would expect, his  .722 winning percentage is the best ever in a season of 20 or more losses.

Hecker finished his nine-season MLB career at 175-46, 2.93, with a .282 batting average (he pitched in 336 games, played first base in 322 and outfield in 75).

A Bit of an Oddity

Guy Hecker won the American Association ERA title in 1884 (1.80) and the league’s batting title in 1886 (.341).

The most wins in a 20-loss season since 1900 belong to Joe McGinnity, who went 31-20, 2.43 for the 1903 Giants. He led the league in wins games (55), starts (48), complete games (44) and innings pitched (434).  His .608 winning percentage is also the best in a 20 or more-loss season since 1900. In 19 MLB seasons (1899-1908 … Orioles, Superbas, Giants), McGinnity went 246-142, 2.66. He won 20 or more games in eight seasons (leading the league five times) and lost 20 or more in two seasons.

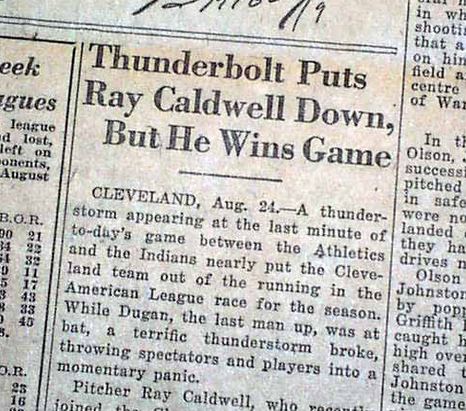
An Oddity of the One Thing Leads to Another Variety

This one is from one of Hall of Famer Iron Joe McGinnity’s 20-loss seasons. In August of 1903, the Giants’ McGinnity started both games of a doubleheader three times (August 1, 8 and 31) and won all six games. That same month, he pitched just one game on six occasions – and went 1-5. On the season, he went 31-20, 2.43.

 ____________________________________

Here’s the Ball, Go Get’ Em Rook

A total of 77 rookies have lost 20 or more games – 56 pre-1900, 21 since 1900 and just two since 1960.

The last rookie to rack up a 20-loss season was the Padres’ Clay Kirby – in 1969, when he went 7-20, 3.80.  He went on to an eight-season MLB career (1969-76 … Padres, Reds. Expos), going 75-104, 3.84.  His best season was 1971, when he went 15-13, 2.93, with 13 complete games in 36 starts for the Padres.

One and Out

Twenty-six pitchers have lost 20 or more games in their final MLB season. For ten of those players, it was their ONLY MLB season. Nine of those ten played before 1900.  The unicorn, in this case, was Henry Keupper, who went 8-20, 4.27 for the 1914 Federal League St. Louis TerriersThe most losses for any of these one season-and-out pitchers goes to George Cobb of the 1892 National League Baltimore Orioles, who went 10-37, 4.86 in his lone MLB season. 

________________________________________

The Win-Loss Yo-Yo

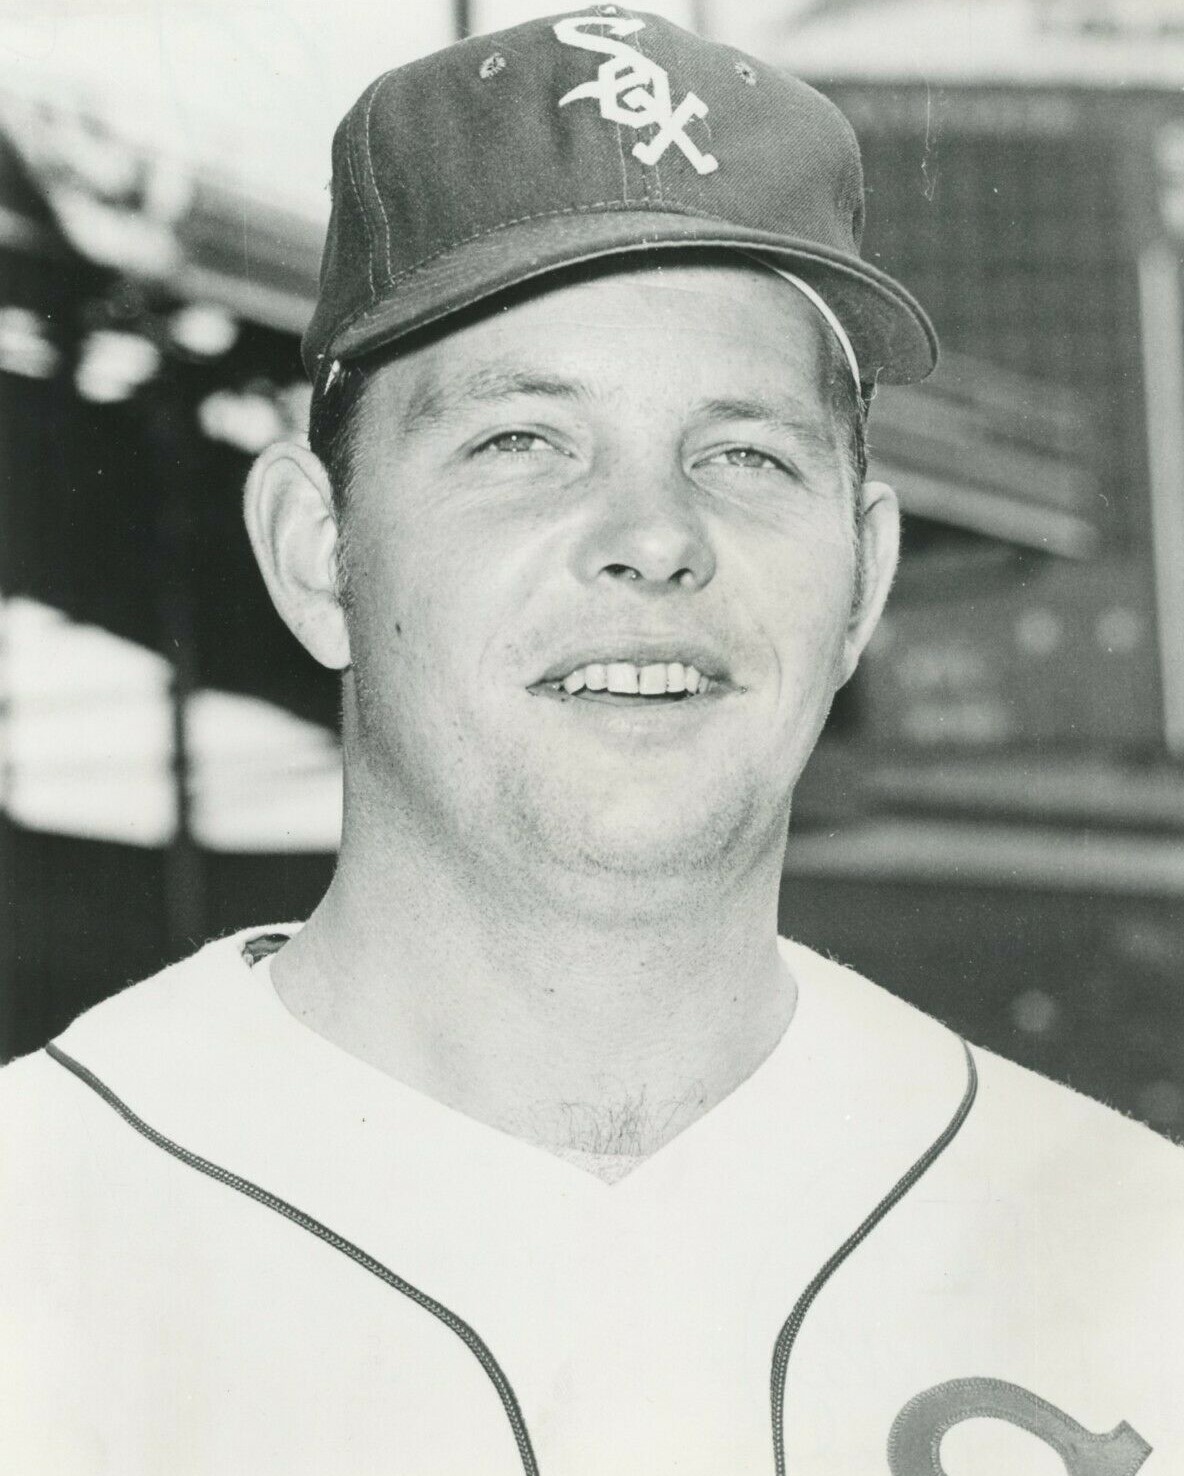
Photo: Chicago White Sox, Public domain, via Wikimedia Commons

Since 1900, only one pitcher has TWICE put up a season of twenty losses immediately after a season of twenty wins.  That unicorn would be the White Sox’ Wilbur Wood, who accomplished the feat between 1972 and 1975.

Wood was an All Star in 1972, going 24-17 for the White Sox (leading the league in wins). In 1973, he lost 20 games (but again led the AL with 24 wins). Then, in 1974, he went 20-198, 3.60, before losing 20 games (16 wins) in 1975.

Woos

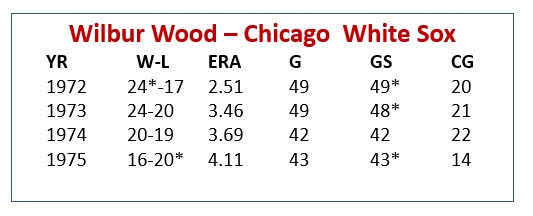
Wood – a southpaw knuckleball pitcher – started his MLB career primarily as a reliever, just 21 starts in 365 appearances between 1961 and 1970. He was converted to a starter by the White Sox in 1971 and won 20 or more games in each of the next four seasons.  He played in 17 MLB seasons, going 164-156, 3.13, with 57 saves. He made a total of 651 appearances (297 starts).  Wood was a three-time All Star and led his league in wins twice (losses once), games pitched three times, games started four times, and innings pitched twice.

____________________________________________

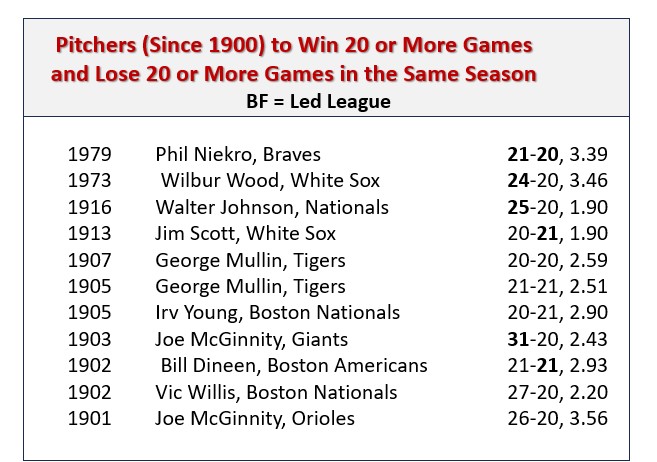
Here’s a look at pitchers, since 1900, who have either followed up a 20-win season with 20 losses in the next campaign, or followed a 20-loss season immediately with a 20-win season.

20 loss after 20 win

20-20

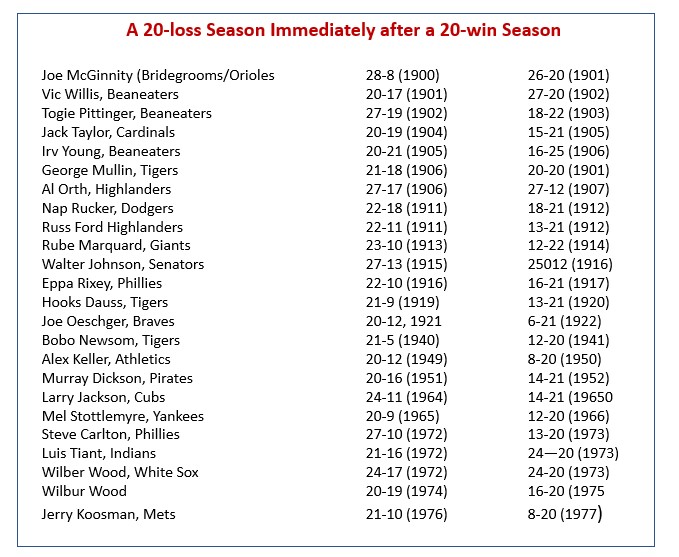
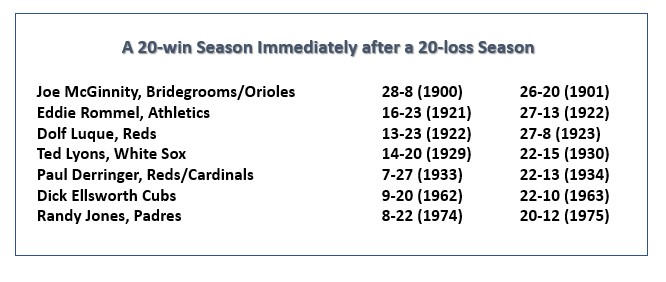
We’re closing in on the end. (Still with me?)

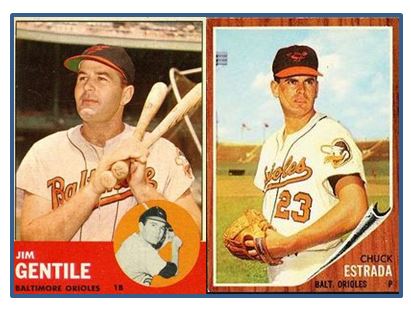
My Three favorite 20-game Losers — Two Youngs and a Larsen

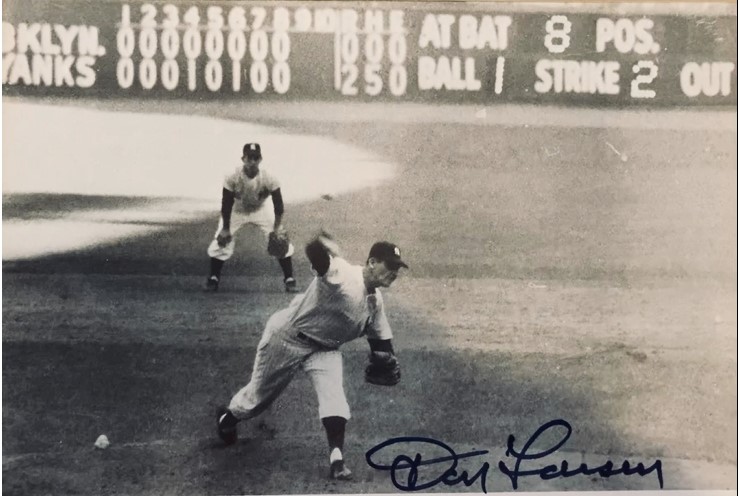
  1.  Don Larsen … In 1954, just two years before he would pitch a World Series Perfect Game for the Yankees, Larsen went 3021, 4.37 for the Orioles (The Orioles were 54-100 that season.) Larsen went 81-91, 3.78 in 14 MLB seasons.
  2. Cy Young …  MLB’s winningest pitcher (511 victories) also lost the most career games (315). His record included three seasons of 20 or more losses (in two of those he had more wins than losses). In 1909, his age-39 seasons, Young went 13-21, 3.19 for the Boston Americans of the  AL. In is 22-season  MLB career, 16 seasons of 20 or more wins (five of those of 30 or more).
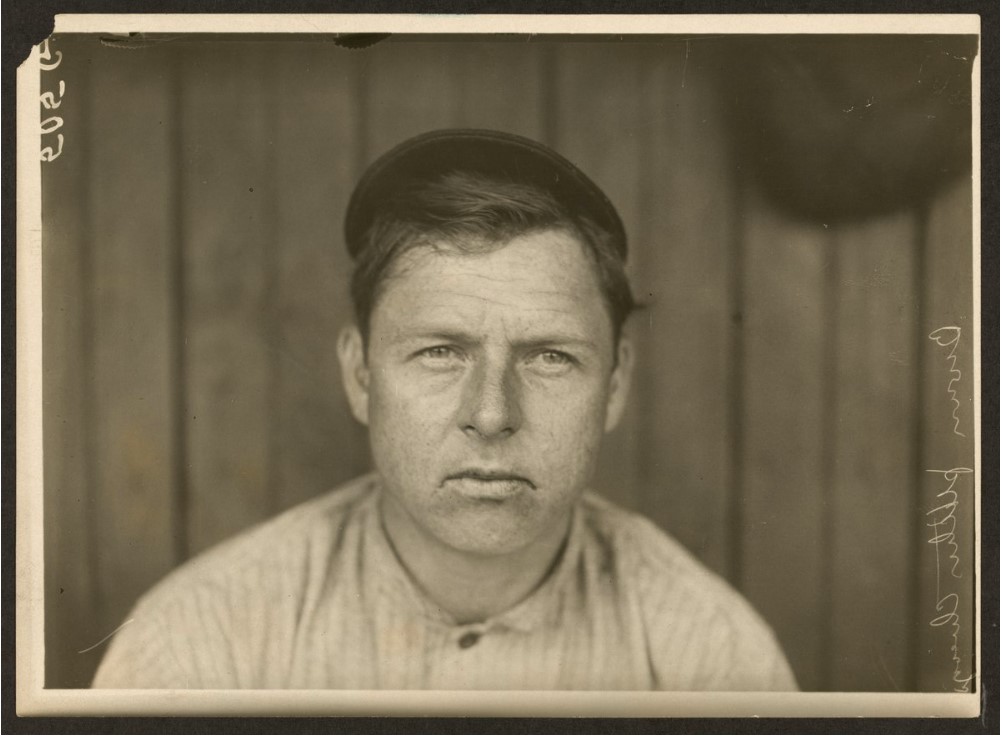
  3. Irv Young … There have been only two MLB teams to “boast” four twenty-game loser in the same season and Irv Young was one of the 20-game losers on both of them.  The 1905 Boston Beaneaters featured a rotation that included Vic Willis (12-29), Chick Fraser (14-21), Irvin Wilhelm (3-23) and the “ace” of the staff, Irv Young (20-21). Boston finished 51-103-2. The very next season, Boston Young again led the Boston staff with a 16-25 record, followed up by Vive Lindaman (12-23), Jeff Pfeffer (13-22) and Gus Dorner (8-25).  That season, Boston finished 49-102-1.

Special thanks to Bill Nowlin and Emmet R. Nowlin, editors of “20-Game Losers” (Society for American Baseball Research Inc., 2017) for including a chapter on “A Staff With Four Twenty Game Losers” in that publication.

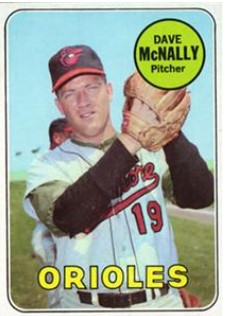
Baseball Balance: As noted above only two MLB teams have completed a season with four twenty-game losses.  On the other end of the scales, only two teams have finished a season with four twenty-game winners: the 1920 White sox, with Red Faber (23-13), Lefty Williams (22-14), Dickey Kerr (21-9) and Eddie Cicotte (21-10) & the 1971 Orioles, with Dave McNally (21-5), Pat Dobson (20-8), Jim Palmer (20-9) and Mike Cueller (20-9).

Deep breath, here’s the finish line.

The name game.  Some pitchers (whose names stuck out for me) with 20-loss seasons under their belts: Steve Carlton; Walter Johnson; Jerry Koosman; Mickey Lolich; Rube Marquard; Denny McLain; Old Hoss Radbourn; Eppa Rixey; Robin Roberts; Red Ruffing; Amos Rusie; Mel Stottlemyre; Luis Tiant.

Nicknames. Ah, those were the days.  Here are some 20-game losers with nicknames that grabbed me: Ice Box Chamberlain; Egyptian Healy; Phenomenal Smith; Tricky Nichols; The Only Nolan; Brickyard Kennedy; Bullet Joe Bush; Boom-Boom Beck; Pretzels Getzien; Cherokee Fisher; Pink Hawley; Sad Sam Jones; Bobo Newsom.

Primary Resource: Baseball Reference.com.

Baseball Roundtable – Blogging Baseball Since 2012.

100Baseball Roundtable is on the Feedspot list of the Top 100 Baseball Blogs.  To see the full list, click here.

Baseball Roundtable is also on the Anytime Baseball Supply Top 66 Baseball Sites list.  For the full list, click here

I tweet (on X) baseball @DavidBaseballRT

Follow Baseball Roundtable’s Facebook Page here

Member: Society for American Baseball Research (SABR); Negro Leagues Baseball Museum; The Baseball Reliquary.

P1019


“Who’s Your Daddy?” … Episode 19 … Tom Glavine

Welcome to the 19th post in the Baseball Roundtable’s “Who’s Your Daddy?” series, where we take a look at Roundtable-selected lineups that performed exceptionally well against some of MLB’s greatest pitchers.

As always, I would stress that the pitchers included in the Who’s Your Daddy? series are among the “best in the business.”  They are selected not because of the players who performed well against them, but rather because success among hitters when they were on the mound was the exception rather than the rule.  We’ve looked at pitchers from a wide range of eras – from Carl Hubbell to Bob Feller to Nolan Ryan to Justin Verlander. Note:  For those unfamiliar with the series, its origins are explained at the end of this post.

This chapter of Who’s You Daddy? Focuses on Tom Glavine – one of just six left-handed pitchers to attain 300 or more major-league victories. In case it should come up in a trivia quiz, here they are (in order of total wins): Warren Spahn (363): Steve Carlton (329); Eddie Plank (326); Tom Glavine (305); Randy Johnson (303); and  Lefty Grove (300).  

___________________________

Before we get started on this edition, here are links to the previous editions of this series.

Please note: For still active pitchers, the stats are as they stood on the date of the post.

  • Nolan Ryan, click here.
  • Sandy Koufax, click here.
  • Pedro Martinez, click here.
  • Bob Gibson, click here.
  • Randy Johnson, click here.
  • Greg Maddux, click here.
  • Justin Verlander, click here.
  • Bob Feller, click here.
  • Roger Clemens, click here.
  • Max Scherzer, click here.
  • Tom Seaver, click here.
  • Mariano Rivera, click here.
  • Warren Spahn, click here.
  • Lefty Grove, click here.
  • Steve Carlton, click here.
  • Robin Roberts, click here.
  • Carl Hubbell, click here. 
  • For Hoyt Wilhelm, click here.

If you go back through past editions of “Who’s Your Daddy?”, you may find a few surprises – like how Will Clark owned Nolan Ryan; Jerry Lynch‘s .714 average versus Sandy Koufax; pitcher Hal Jeffcoat’s .545 average versus Hoyt Wilhelm; the fact that Brian Harper faced Roger Clemens 23 times and never struck out; or how Ival Goodman (who averaged one home run each 47 at bats over his 10-season MLB career) poked six home runs in just 64 at bats against Carl Hubbell.

____________________________

Photo: jimmyack205, CC BY 2.0 <https://creativecommons.org/licenses/by/2.0>, via Wikimedia Commons

Before we get into the lineup of players who fared especially well against Tom Glavine, let’s take a look at the southpaw’s Hall of Fame career.  Glavine pitched in 22 MLB seasons (1987-2008, his age-21 through age-42 seasons). He spent 17 seasons with the Braves and five with the Mets.  Glavine’s 305 wins (versus 203 losses) are 21st all-time and fourth among lefthanders. His .600 wining percentage is 14th among the 24 MLB 300-game winners.

One-Two Punch … Left Jab-Right Hook

The leaders in pitching victories for the decade of the 1990s spent seven of the ten years of the decade together  in the Braves’ rotation. Righty Greg Maddux, whose decade saw him spend 1990-92 with the Cubs and 1993-99 with the Braves, led all MLB pitchers with 176 wins in the decade.  Southpaw Tom Glavine, who spend the entire decade with the Braves, was second with 164.  Maddux and Glavine both won 300+ games in their MLB careers and were both 2014 first-ballot electees to the Baseball Hall of Fame.

Glavine – a ten-time All Star and two-time Cy Young Award winner – was primarily a fastball-changeup pitcher for most of his career (although he could mix in an effective curve, slider and cutter). He was known for pinpoint control, avoiding the middle of the plate and expanding the strike zone, particularly low-and-away. He won 20 or more games in five seasons (four in the 1990s) – leading the NL in wins each time. He led the National League in starts six times, complete games once and shutouts once.  A workhorse, Glavine started 32 or more games in 17 seasons, including every season from 1996 through 2007.

Baseball Roundtable Likes a Good Coincidence

In his first MLB season (at age 21), Tom Glavine went 2-4, with a 5.54 earned run average for the Braves.  In his final MLB season (age 42), Glavine went 2-4, with a 5.54 earned run average for the Braves.  Maybe a good trivia question:  What 300-game winner went 2-4, 5.54 in both his first and last seasons in the major leagues?

In his prime 12-season stretch from 1991 through 2002, Glavine averaged 17 wins, eight losses, a 3.15 ERA, 225 innings pitched, 77 walks and 144 strikeouts per campaign.

A Brief Break From Our Regularly Scheduled Topic

Mike Glavine (Tom Glavine’s younger brother) had a brief MLB career:   six games (PH/1B), seven plate appearances with the Mets in September of 2003. So, why is he here?  Mike made his MLB debut on September 14, 2003 in a pinch-hitting role.  Who did he hit for?  His big brother Tom. (He grounded out second-to-first).  Another fact that caught my eye.  Mike got his only MLB hit in his final MLB plate appearances (September 28, 2003 versus the Marlin’ Braden Looper.) 


Now, let’s look at a lineup of players, who performed pretty well against Glavine.

Keep in mind, while these selections are statistically based, there is plenty of room for debate. (Isn’t that part of what is great about the national pastime?) For example, they are weighted in favor of larger sample sizes. I also considered whether the numbers were generated in Glavine’s prime years and balanced the stats against the player’s career statistics (for example, if I was looking at two players who each hit .305 versus Glavine, I would be more impressed by the player with a .266 overall career average than one with a .308 career average).   I’ll provide some examples of how these criteria were applied as you go through the lineup

Catcher – Mike Redmond … .438 average, unexpected power

Mike Redmond, a career .287 hitter over 13 seasons (1998-2010 … Marlins, Twins, Indians) hit Tom Glavine for a .438 average over 20  games. Glavine was also one of only two pitchers that Redmond (who hit a total of 13 career homers) reached for two career home runs.  As an unexpected side note: Redmond hit .500 (21-for-42 versus Glavine from 1998-2002), then went zero-for-nine in the final two seasons in which he faced him (2003-04).

In 1999, when Glavine went 14-8, 3.68, Redmond faced him seven times and collected five hits and a walk (.833 average).

A Nice Little Run

From July 12, 1998 through his second at bat against Glavine on July 6. 1999, Mike Redmond faced Glavine nine times and collected seven singles, one double and a walk. Over those two seasons, Glavine went 34-17, 3.30.

Honorable Mention at Catcher: I fully expected this spot to go to someone like Hall of Famer Mike Piazza, who went .343-6-13 in 27 games against Glavine. Piazza’s six home runs tie for the most against Glavine and his 13 RBI tie for fifth.  Piazza did have 84 plate appearances versus Glavine, compared to Redmond’s 51 – but I could not resist Redmond’s .400+ average. Either would be a fine choice at catcher in this lineup.

Worth the Wait

Mike Piazza, who played his way into the Baseball Hall of Fame (with a  career .308-427, 1,335 stat line and ten All Star selections) was the 1,390th pick in the 1988 MLB draft.   

____________________________________

First Base – Jeff Bagwell … .339, with three home runs

Photo: Michael Glasgow, CC BY 2.0 <https://creativecommons.org/licenses/by/2.0>, via Wikimedia Commons

Hall of Famer Jeff Bagwell hit .339, with three homers and ten RBI in 23 games against Glavine. His 21 career hits against the lefty tie for the 18th.  Bagwell also drew 18 walks versus Glavine (11 strikeouts) and put up a .488 on-base percentage. Those 18 walks were the most Glavine issued to any player. Four of those were intentional, tying for the most IBB Glavine issued to any player.  (Others to receive four career IBB from Glavine were Gary Sheffield and Barry Bonds.) Bagwell was a career .297 hitter over 15 seasons (1991-2005, all Astros). He was a four-time All Star, 1991 NL Rookie of the year and 1994 NL MVP (.368-39-116, with 104 runs scored and 15 steals. ).  His career stat line was .297-449-1,529, with 1.517 run scored and 202 stolen bases.

________________________________

An Even Dozen

In his first dozen games facing Tom Glavine, Jeff Bagwell got on base versus Glavine via hit or walk in all twelve, hitting safety in 11.

______________________________________

Deserves a Shoutout at 1B: First baseman Mo Vaughn doesn’t make this lineup due to a small sample size (just 10 at bats in four games versus Glavine), but he deserves a shoutout. In those three games, he delivered five hits (two doubles and three home runs) for a 1.600 slugging percentage.

Now, it’s always nice when selecting these lineups to come across a player you are not familiar with. Expos’  1B Fernando Seguignol faced Tom Glavine in five games (1999-2001) and went seven-for-fourteen (.500), with two doubles, two home runs and five RBI. It was Seguignol’s most at bats, most hits, most doubles (tie), most home runs and most RBI against any pitcher. In five MLB seasons (1998-2001, 2003 … Expos, Yankees), Seguignol hit .249-17-40 (178 games).

___________________________

Second Base – Tie:  Robby Thompson and Bill Doran

I could find good arguments for both Robby Thompson and Bill Doran in this spot.

If I had to pick one, I’d lean toward Thompson for his larger sample size.  However, since this is my post, I can declare a tie.

Robby Thompson – .393 and four long balls

Robby Thompson hit .393 (22-for-56) in 20 games against Tom Glavine. Perhaps as important is the fact that 13 of his 22 hits went for extra bases (eight doubles, one triple and four home runs). This gives him a .786 slugging percentage versus Glavine – second highest among players with at least 25 at bat versus Glavine. Thompson hit .500 or better versus Glavine in five of the nine seasons in which he faced him.

_______________

Catching Him in His Prime

In 1992 & 1993, when Tom Glavine went a combined 42-15 (and led the NL in wins both times), Robby Thompson 11-for-18 (.611) against him, with two homers and three RBI in six games.

______________

Thompson played 11 MLB seasons (1986-96), all for the Giants.  He was a two-time All Star and one-time Gold Glover, who put up a .257-119-458 stat line. His four home runs off Glavine` tied for the most he hit against any MLB pitcher (he also had four versus Jose Rijo) and his 22 hits versus Glavine were the second most he had against any MLB pitcher (he hit .424 with 23 hits versus Fernando Valenzuela).  By contrast, Thompson hit .118, with nine hits in 48 at bats versus Greg Maddux, with three walks and 15 whiffs.

Bill Doran – .480 average, .606 on-base percentage.

Photo: Indiana Blue Sox, Public domain, via Wikimedia Commons

Bill Doran was a .266 career MLB hitter (1982-93 … Astros, Reds, Brewers). He did, however, tag Tom Glavine for a .480 average (12-for-25) and drew eight walks versus Glavine, fanning just once (.606 on-base percentage – highest among batters with at least 25 at bats versus Glavine).  Side note: If you use 25 plate appearances instead of at bats, Doran’s OBP versus Glavine is second to Carlos Delgado’s  .640.

____________________________

Bookends

In his first seven career plate appearances versus Tom Glavine (August 17 & September 30, 1987), Bill Doran was on base six times (three singles and three walks). In his final eight plate appearance versus Glavine (October 2, 1991 and August 4 & September 9, 1992), Doran collected four walks and a pair of singles.

_________________________________  

Doran’s career stat line was .266-84-497, with 727 runs scored and 209 steals in 1,453 games. His best season was 1987, when he hit .283-16-79, with 82 runs scored and 31 steals for the Astros (and played in all 162 games).

Possible Trivia Question: Which member of the Astros’ Hall of Fame matriculated in Oxford? (No, not that Oxford.)  Bill Doran studied and played base ball for Miami University in Oxford, Ohio – where he hit .407-4-27 (45 games) in his final college season (1979). He was selected in sixth round of the 1979 MLB Draft.

Honorable Mention: Luis Castillo hit .382-2-5 in 24 games versus Glavine (1996, 1999-2005, 2008). His 29 hits tied for the most career safeties against Glavine and he recorded them in the fewest at bats among the five players with 29 hits against Glavine. There was just a lot of competition at second base – and a three-way tie was too much to ask.

__________________________________

_________________________________

Third Base: Tim Wallach … .367, five homers, 12 RBI

Tim Wallach hit .367, with five home runs and 12 RBI against Glavine – and he gets extra credit because those numbers came between 1988-94 and included three of the five seasons in which Glavine led the league in wins. (1991-93). Over those three seasons, Wallach went 12-for-29 (.414) against Glavine, with three doubles, a triple, one home run and five RBI.

Going Deep Can Be Habit-Forming

Between May 30, 1990 and June 9, 1991, Tim Wallach faced Tom Glavine in four games and homered in each of them:

May 30, 1990 … one-for-two, solo homer;

June 29, 1990 … one-for-three, solo home run, walk;

July 12, 1990 … one-for-three, three-run homer;

June 9, 1991 … two-for-two, single, three-run homer, single, walk.

As an aside, those three 1990 homers were the only hits Wallach had in 11 at bats versus Glavine that season.

Wallach played in 17 MLB seasons (1980-96 … Expos, Dodgers, Angels), going .257-260-1,125, with 908 runs scored. He was a five-time All Star and three-time Gold Glover. His best season was 1987, when he hit .298-26-123 – reaching career highs in all three categories, as well as in doubles (a league-leading 42), runs scored (89), stolen bases (9) and total bases (305).


Honorable Mentions. Aramis Ramirez.  It’s hard to limit Ramirez to an honorable mention here.  After all, he hit .500 (13-for-26), with four home runs and ten RBI in just 12 games versus Glavine.  However, five of his hits, two of his homers and eight of his RBI came in Glavine’s final three (age 40-42) seasons. Digging deeper, Ramirez had a .421 on-base percentage versus Glavine from 2001-2005 and a .721 OBP in 2006-08. Still, there are some nice numbers here.  Ramirez drew eight walks and fanned just once (in 35 plate appearances) versus Glavine (six of the walks in those final three seasons). He also hit .400 or better in six of the seven seasons he faced Glavine.  Ramirez played 18 MLB seasons (1998-2015 … Pirates, Cubs, Brewers), going .283-386-1,417, with 1,098 runs scored.  He was a three-time All Star, hit 25 or more home runs in ten seasons, drove in 100+ runs in seven and hit .300 or better in seven.

During his 16-season MLB career, Todd Zeile started more than 100 games each at 3B (1,468), 1B (417) and catcher (121).  As a hitter, over 2,158 games, he went .265-253-1,110.  Zeile faced Glavine in 34 games and collected 29 hits (.326 average), with four  home runs, 12 RBI (13 walks  and 13 strikeouts). Competition was tough at the hot corner.

__________________________________

Shortstop:  Tie- Jimmy Rollins & Barry Larkin

I know, another cop out (tie), but Barry Larkin and Jimmy Rollins each offer a notable body of work against Glavine – and were both were among the players tied for the most hits against Glavine at 29. Rollins showed a bit more power, Larkin a bit more patience.  And, more of Larkin’s numbers were delivered when Glavine was in his prime.

Jimmy Rollins – .372 average, 29 hits, ten doubles, 14 RBI.

Photo: Keith Allison from Hanover, MD, USA, CC BY-SA 2.0 <https://creativecommons.org/licenses/by-sa/2.0>, via Wikimedia Commons

Jimmy Rollins holds or is tied for the career lead in hits (29), home runs (6), doubles (10) and RBI (14) against Glavine. Overall, 17 of Rollins 29 hits went for extra bases.  Admittedly, a significant portion this damage was done toward the end of Glavine’s career, but those leadership positions are impossible to ignore.  (As a bit of explanation, eight of Rollins’ hits, two of his homers and three of his RBI against Glavine came in 2007 (Glavine’s age-41 season).

Rollins was a three-time All Star, four-time Gold Glover and the 2007 NL Most Valuable player. He played 17 seasons (2000-2016 … Phillies. Dodgers White Sox) and hit .264-231-936, with 1,421 runs scored and 470 stolen bases. He led the NL in triples four times, runs scored once  (topping 100 runs scored in six seasons) and stolen bases once (topping 40 steals in four seasons).

Barry Larkin … .309, 29 hits, three homers, 12 RBI, 14 walks

Photo: Rdikeman at the English Wikipedia, CC BY-SA 3.0 <http://creativecommons.org/licenses/by-sa/3.0/>, via Wikimedia Commons

Hall of famer Barry Larkin faced Glavine in 34 games (1987-96, 1998-99, 2002,2004). He hit .309 (29 hits), with eight doubles, one triple, three homers and 12 RBI. He also walked 14 times versus Glavine versus just three whiffs.

Larkin’s numbers against Glavine were closer to his career norm than Rollins’ were to his. Larkin played 19 MLB seasons (1986-2004), all for the Reds.  He hit .295-198-960, with 1,329 runs scored and 379 steals. He was a 12-time All-Star, three-time Gold Glover and the 1995 NL Most Valuable Player. Larkin hit over .350 against Glavine in seven of the 14 seasons in which he faced the southpaw Hall of Famer.


Small Sample Shoutout at Short:  Luis Rivera faced Tom Glavine in just three games (1988 & 1994) and went six-for-eight, with a double, two home runs and four RBI.

__________________________________

Left Field – Kevin Mitchell … .356, with five home runs and 12 RBI

Kevin Mitchell faced Glavine in 16 games (1987-91, 1993-94, 1996), putting up a .356-5-12 line.  Half of Mitchell’s hits against Glavine went for extra bases (three doubles and five home runs) – giving him a .756 career slugging percentage the lefty.

Closing Strong

In his first three games against Glavine, Mitchel went two-for-seven (.286), with zero extra-base hits, just one walk and four strikeouts.  Over his final 13 games against Glavine, he went 14-for-68 (.368), with eight extra-base hits, nine walks and three strikeouts.

In the same vein, in his first career plate appearance against Glavine (September 25. 1987), Mitchell struck out.  In his last plate appearance against Glavine September 4, 1996, he homered.


Kevin Mitchell played in 13 MLB seasons (1984, 1986-94, 1996-98 … Mets, Padres, Giants, Reds, Red Sox, Indians, Athletics), going .284-234-760 in 1,223 games. He was a two-time All Star and the NL MVP in 1989, when he hit .291-47-125 for the Giants – leading the league in HRs, RBI, slugging percentage and total bases.

__________________________________________

Center Field – Andruw Jones … .372 average, four home runs

Photo: User Chrisjnelson on en.wikipedia, Public domain, via Wikimedia Commons

Needed a leather and lumber guy in CF and Andruw Jones fit the bill.  In 18 games versus Glavine (2003-07), Jones hit .372, with four home runs and 11 RBI, Eight of his 16 hits versus Glavine went for extra bases (four doubles, four home runs) and he drew 11 walks to just four strikeouts, putting up a nice even .500 on-base percentage.

First Time’s the Charm

Andruw Jones homered on the second pitch he ever saw from Tom Glavine (May 24, 2003). The Braves defeated Glavine’s Mets 10-3 in that game.

Andruw Jones played in 17 MLB seasons (1996-2012 … Braves, Dodgers, Rangers, White Sox, Yankees), going .254-434-1,289, with 1,204 runs scored and 152 stolen bases.  He hit 30 or more home runs in seven seasons (a league-leading and career-high 51 in 2005). He was a five time All Star and ten-time Gold Glover in center field.

Andruw Jones and Tom Glavine were teammates on the Braves from 1996 through 2002.

_________________________________

Right Field, Gary Sheffield – .293, five home runs, 13 RBI, 17 walks versus three whiffs, .461 OBP

Oh, I’d like to have seen those Gary Sheffield versus Tom Glavine at bats. Glavine working to expand the strike zone, Sheffield refusing to bite on the low-and -away pitch (17 walks versus three whiffs). Sheffield faced Glavine in 1992, 1994-2001, 2003, 2005 & 2007). He tied for the most career home runs off Glavine with six and had the fifth most RBI (13 – one off the lead). But what really put him in the LF spot (against some tough competition), was those 17 walks versus only three strikeouts.

In 1996, Gary Sheffield faced Tom Glavine 12 times in four games and got on base nine – seven walks and two home runs.  He did not strikeout against Glavine that season. Over his career, Sheffield never fanned more than once versus Glavine in any season and had just three whiffs in 76 plate appearances.

Some Bookends

On April 18, 1996, the Marlins’ Gary Sheffield rapped a home run off Tom Glavine in the first inning of a 5-3 Florida win over Atlanta. In his next seven plate appearances versus Glavine, Sheffield walked seven times (three intentional). He ended the streak of walks with another home run off Glavine on July 12 of that season.

Outfield Honorable Mentions: Barry Bonds went .329-4-14 in 33 games versus Glavine. Moises Alou also did well against Glavine at .351-3-14 in 25 games.

Apologies

Tony Gwynn tied for the most career hits versus Glavine, but did not make this lineup. One main reason, his .312 average versus Glavine was 26 points below his career average.

______________________________________

Pitcher – Livan Hernandez … .412 average

Livan Hernandez faced Tom Glavine 20 times in eight games (1999, 2002-06) and delivered seven hits in 17 at bats (.412 average). Those hits included two triples (tied for the most against Glavine by any batter), one home run and three RBI.

On The Money

 In his very first game against Glavine (April 23, 1999), the Marlin’s Livan Hernandez got his money’s worth on the mound and at the plate. On the mound, he got the win (over the Braves) with a nine-hit, one-run, two-walk, nine-strikeout complete game.  At the plate, he flied out to deep right on the first pitch he saw from Tom Glavine (second inning); had an RBI sacrifice fly on an 0-2 pitch from Glavine in the fourth; hit a two-run homer on the first pitch he saw from Glavine in the sixth; and had an RBI single off reliever John Hudek in the seventh.

In their eight head-to-head pitching matchups, Glavine went 5-3, 2.56, while Hernandez went 3-5, 2.88. Hernandez was a solid hitter as a pitcher – .221-10-85 over 973 at bats over 17 seasons.

Honorable Mention: Gil Heredia faced Tom Glavine just three times (1994-95), but he delivered three hits. (all singles).  Heredia, by the way, was a good hitting pitcher. Over 10 MLB seasons, he put up a .213 average (19-0for-104), struck out just 11 times in 131 plate appearances.  The right hander went 57-51, 4.46 on the mound (1991-96, 1998-2001 … Athletics, Expos, Giants, Rangers.)


______________________________________

Who’s Your Daddy?  The Inspiration.

On September 24, 2004, in the middle of a tight pennant race, the Yankees handed future Hall of Famer Pedro Martinez and the Boston Red Sox a tough 6-4 loss.  Martinez went 7 1/3 innings giving up nine hits and five earned runs.  The game came just five days after (in his previous start) Martinez had lasted just five frames against the Bronx Bombers (eight hits, eight earned runs) in a 16-7 loss.

After that second loss, Martinez candidly commented, “What can I say? I just tip my hat and call the Yankees my daddy.”  Little did he know that his comment – and a Yankee fans’ chant of “Who’s your daddy?” would follow him into future starts in New York (all the way to his final MLB start – against the Yankees for the Phillies – in Game Six of the 2009 World Series).

The concept of “Who’s your daddy?” became the inspiration for Baseball Roundtable to take a look at the players who “had the number” of some of MLB’s premier pitchers.  Again, you can find links to the previous “editions” of “Who’s Your Daddy?” near the top of this post. 

______________________________________

Primary Resource: Baseball-References.com.


Baseball Roundtable – Blogging Baseball Since 2012.

100Baseball Roundtable is on the Feedspot list of the Top 100 Baseball Blogs.  To see the full list, click here.

Baseball Roundtable is also on the Anytime Baseball Supply Top 66 Baseball Sites list.  For the full list, click here

I tweet baseball @DavidBaseballRT

Follow/Like Baseball Roundtable’s Facebook Page here.  Find More baseball commentary; blog post notifications; PRIZES.

Member: Society for American Baseball Research (SABR); Negro Leagues Baseball Museum; The Baseball Reliquary.

P1018


Feeling Powerless? Rarities and Oddities about Zero-home Run Seasons.

Readers of Baseball Roundtable are aware of how I am drawn to baseball rarities in the off-season.  In this post, we’ll look at some of the unique statistics surrounding zero-home run seasons. If you enjoy this you may want to check out my posts on 20-game winners (click here) and 100-RBI seasons (click here).

Rarities and Oddities – MLB Batting Champions with Zero Home Runs

There have been only two MLB batting champions to log zero home runs in a season in which they won the crown … and they came 75 years apart. 

Wee Willie Keeler, 1897 Orioles

Photo: Internet Archive Book Images, No restrictions, via Wikimedia Commons

In 1897, 5’-4”/140-pound Baltimore Orioles’ outfielder Willie Keeler won the NL batting title with a .424 average, stroking out a league-leading 239 hits. In the process, he set a still unmatched record for base hits in a season in which the player hit zero home runs.  Of those 239 hits, 193 (81 percent) were singles. Keeler opened the 1897 season with a 44-game hitting streak (still MLB’s longest streak from Opening Day).  Keeler was an accomplished bunter and a renowned contact/slap hitter. Over his career, Keeler struck out just 136 times in 9,619 plate appearances.

_____________________________________

“I keep my eyes clear and I hit ‘em where they ain’t.”

                   Willie Keeler (Baseball’s Greatest Quotations, Paul Dickson, 1991)

_________________________________________

Hall of Famer Keeler played 19 MLB seasons (1892-1910 … in the NL, the Giants, Brooklyn Statistics, Orioles, Brooklyn Superbas and, in the AL, New York Highlanders).   He was a two-time batting champion and collected 200 or more hits in eight seasons.  Of his 2,932 hits, 86 percent were singles. Keeler finished with a .341-33-810 career stat line, with 1,719 runs scored and 495 steals.

Willie Keeler had 33 career home runs – of which only two cleared the fences.  Of the others, thirty were inside-the-park and one left the field on the bounce (it was a different time).

_________________

Rod Carew, 1972 Twins

Photo: Hostess via tradingcarddb.com, public domain, via Wikimedia Commons

In 1972, Hall of Famer Rod Carew won his second (of seven) AL batting titles.  He hit .318-0-51, with 51 RBI and 61 runs scored in 142 games – 143 of his 170 hits (84 percent) were singles. 1972 was his only season without a home run.

Carew, like Keeler, was an accomplished bunter (in 1974, he had 29 bunt singles) and contact hitter. Carew played 19 MLB seasons (1967-85 … Twins, Angels). The 18-time All Star won seven batting titles, the 1967 AL Rookie of the Year Award and the 1977 AL MVP Award.  He hit over .300 in 15 of his 19 seasons and finished with .328-92-1,015 stat line, with 1,424 runs scored and 353 steals.

_________________________________

“He (Rod Carew) has an uncanny ability to move the ball around as if the bat were some kind of magic wand.”

                                                              Pitcher Ken Holtzman

____________________________________

Most Hits in a Zero-Home Run Season

As usual, one thing led to another and I began digging a little deeper into the rarity of zero-homer seasons. As you might expect, they have become rarer over time.  Starting with a base of players with seasons of at least 100 hits and zero home runs, there were 873 such seasons in MLB history. Not rare at all, although about two-of-every three (593 or 67.9 percent) occurred before 1930.

So, I looked for something a little rarer and ramped up to 150 hits and no home runs.  Now. we were down to 177 such campaigns – still not rare air.  But, using 200 or more hits turned the trick.  There have been only seven seasons of 200 or more hits and zero home runs. Let’s take a look at them – and the players were delivered them.

Willie Keeler, 1897 Orioles (NL) – 239 hits

Willie Keeler has the most hits in a zero-homer season at 239. You’ve already read about him in the opening of this post, so we can move on to number-two.

________________

Napoleon Lajoie, 1906 Cleveland Naps – 214 hits

In 1906, second baseman Nap Lajoie hit .355 for Cleveland, with a league-leading 214 hits and a league-topping 48 doubles, but zero home runs.  He drove in 91 runs and scored 88 in 152 games.

In a 21-season MLB career (1896-1916 … Phillies, Athletics, Naps), he hit .338-82-1,599, with 1,504 runs scored and 380 steals. Looking for a trivia question? Lajoie is the only player with a 200-hit, zero-home run MLB season, with more career RBI than runs scored.

The Hall of Famer led the league in batting average five times, hits four times (topping 200 hit each time), doubles five times (a high of 51 in 1910), home runs once, total bases four times, RBI three times and runs once. He hit over .300 in 17 seasons, but reached double-digits in home runs just once.

The Triple Crown … and Then Some

In 1901, while with the Philadelphia Athletics, Nap Lajoie, won the Triple Crown with a .426 average, 14 home runs and 125 RBI.  He also led the AL in runs scored (145), hits (232), doubles (48) and total bases (350).

_________________

Jesse Burkett, 1898 Cleveland Spiders, (NL) – 213 hits

In 1898, Cleveland LF Jesse Burkett hit .341 for the Spiders, with 213 hits, 114 runs scored, 42 RBI, 19 steals and zero home runs.  In fact, that season just 27 of Burkett’s hits (12.7 percent) went for extra bases.

Hall of Famer Burkett played 16 MLB seasons (1890-1905 … Giants, Spiders, Cardinals, Browns). He won three batting titles (twice hitting over .400), led the league in hits three times (topping 200 hits in six seasons) and twice led the league in runs scored (topping 100 in nine seasons).

1898 was the only full season in which Burkett failed to hit at least two home runs, Over his career, Burkett hit .338, with 75 home runs, 952 RBI, 1,720 runs scored and 389 steals.

________________

Hughie Jennings, 1896 Orioles NL – 209 hits

In 1896, Hughie Jennings banged out 209 hits (.401 average) and drove in 121 runs, despite not going yard a single time (87 percent of his hits were singles).

Jennings played 18 MLB seasons (1891-1903, 1907, 1909-10, 1912, 1918 … Louisville Colonels of the American Association and NL Orioles, Brooklyn Superbas and Phillies, and AL Tigers).  Over 1,284 games, he hit .312-18-840, with 992 runs scored and 359 steals. Jennings scored 100 or more runs in five seasons, had two seasons of 200+ hits and stole 50+ bases three times.

Hughie Jennings recorded 121 RBI in 1896, the MLB record for a zero-home run season.

Jennings holds the MLB record for career “hit by pitch” at 287 and the MLB single-season record at 51 (1896 Orioles). He led the NL in HBP six consecutive seasons (1894-1898.) Once again, for Baseball Roundtable,  one thing led to another – and to this chart.

________________

Johnny Pesky, 1947 Red Sox – 207 hits

In 1947, Red Sox’ 23-year-old rookie SS Johnny Pesky hit .324-0-39, with 106 runs scored and 12 stolen bases (83 percent of his 207 hits were singles).

Pesky played in ten MLB seasons (1942, 1946-54 … Red Sox, Tigers, Nationals). He hit .307-17-404, with 867 runs scored and 53 steals.  Over his career, he topped 100 runs scored in six seasons, exceeded 200 hits three times and hit .300+ six times.

What Might Those Numbers Have Been?

As a 23-year-old rookie in 1942, Johnny Pesky hit .331-2-51, with 105 runs scored and a league-topping 205 hits.  Pesky then missed three years of baseball action due to military service. He returned to the Red Sox as a 27-year-old and picked up right where he left off,  again leading the AL in base hits with 208 – going .335-2-55, with 115 runs scored in 153 games. In 1947, his third MLB season, he led the AL in hits for a third time (207), going .324-0-39, with 106 runs scored.  What might his career numbers have been if he had not missed those three prime years wile in the Navy?

________________________________________

Milt Stock, 1920 Cardinals – 204 hits

Cardinals’ third baseman Milt Stock went .319-0-76, with 85 runs scored in 1920 (83 percent to his hits were singles). Stock played 14 MLB seasons (1913-26 … Giants, Phillies, Cardinals, Robins). He went .289-22-696, with 839 runs scored and 155 steals.  Stock hit .300+ in five seasons (a high of .328 in 1925) and twice recorded 200+ hits in a season. From 1919 through 1922, he hit over .300 in four consecutive seasons.

Another One Thing Leads to Another 

From his fourth plate appearance on June 21, 1918 until his fifth plate appearance on August 22, 1921, Milt Stock went 1,690 plate appearances without a home run, Stock falls far short of the MLB record, held by Thomas Thevenow, who hit his second career regular-season MLB home run (both were inside-the-parkers) in his final at bat of a game played on  on September 22, 1926 and then played 12 more major-league seasons – going another 1,003 games and 3,607 consecutive plate appearances without a four-bagger. In a 15-season MLB career Thevenow (primarily a SS) hit .247 (1,030 its in 1,229 games). Notably, Thevenow hit a third MLB home run in 1926.  This one was also an inside-the-parker and came in Game Two of the Cardinals-Yankees World Series. St. Louis won the Series four games-to-three and Thevenow hit .417 (10-for-24), with five runs scored, one double, one homer and four RBI.

________________

One Final Chart:

Doc Cramer, at the top of this list, played 20 MLB seasons (1929-48 … Athletics, Red Sox, Nationals Tigers). He hit .296-37-842, with 1,357 runs scored. He was a five-time All Star, had 200 or more hits in three seasons, 100+ runs in three seasons, and hit .300 or better in seven seasons. He had 2,705 career hits (80 percent of them singles).

Okay, maybe one more chart:


Most Seasons with Zero Home Runs and 500 or More Plate Appearances – Seven

Donie  Bush had zero home runs and 500 or more plate appearances for he Tigers in 1909,  1914, 1916-19,  and for the Tigers and Nationals in 1921. He played 16 MLB seasons (1908-23 … Tigers, Nationals) and went .250-9-445, with 1,281 runs scored.

Jim Slagle … Slagle put up seasons of 500 or more plate appearances and zero home runs for the Cubs in 1900,  1902-03 and 1905-07. In a ten-season MLB career (Senators, Phillies, Boston Nationals, Cubs), he hit .268-2-344, with 781 runs scored and 274 steals in 1,300 games.

Primary Resource:  Baseball-Reference.com.

A REMINDER … .

There is still time to cast your vote(s) in the Baseball Roundtable (unofficial) 2024 Baseball Hall of Fame Fan Balloting (and qualify for the prize drawing).  Click here to go directly to the ballot.  Click here for a post taking a look at the careers of the players on the ballot.


Baseball Roundtable – Blogging Baseball Since 2012.

100Baseball Roundtable is on the Feedspot list of the Top 100 Baseball Blogs.  To see the full list, click here.

Baseball Roundtable is also on the Anytime Baseball Supply Top 66 Baseball Sites list.  For the full list, click here

I tweet (on X) baseball @DavidBaseballRT

Follow/Like Baseball Roundtable’s Facebook Page here.  Find More baseball commentary; blog post notifications; PRIZES.

Member: Society for American Baseball Research (SABR); Negro Leagues Baseball Museum; The Baseball Reliquary.

P1017


Baseball Roundtable Musings on 20-Win Seasons … Stats and Stories

Baseball Roundtable was recently reflecting on that fact that the Braves’ righty Spencer Strider was MLB’s only 2023 20-game winner, which led me to the fact that MLB has had just one twenty-game winner in each of the past three seasons. In the vein of  “In Baseball Roundtable one thing always seem to lead to another,” this led me to the fact that only five pitchers (one of them being Strider) have recorded 20 or more wins in a season in which they pitched fewer than 190 innings:

  • 2022 – Kyle Wright, Braves (21-5, 3.19 in 180 1/3 innings);
  • 2018 – Blake Snell, Rays (21-5, 1.89 in 180 2/3 innings);
  • 2021 – Julio Urias, Dodgers (20-3, 2.96 in 185 2/3 innings);
  • 2023 – Spencer Strider, Braves (20-5, 3.86 in 186 2/3 innings;
  • 2012 – Jered Weaver, Angels (20-5, 2.81 in 188 2/3 innings).

Anyway, that sent me down a research rabbit hole, searching out stats related to 20+ win seasons that interested me (and I hope some of them interest you, as fans and readers).

Of course, one thing led to another and those low inning totals led me to look at complete-game totals.  As the chart below snows. Strider joined a (rather impressive) recent and growing list of pitchers to record twenty wins in a season without throwing a single complete game.

_____________________________________

BEFORE WE RETURN TO OUR REGULAR PRORAMMING/POSTING …

There is still time to cast your vote(s) in the Baseball Roundtable (unofficial) 2024 Baseball Hall of Fame Fan Balloting (and qualify for the prize drawing).  Click here to go directly to the ballot.  Click here for a post taking a look at the careers of the players on the ballot.

_________________________________________________


Before, getting into single-seasons and records, here a few numbers to show how the times have changed.  Baseball-Reference.com shows 1,219 seasons of 20 or more wins since 1871. Within that statistic:

  • MLB averaged 13.5 20+ game winners per season before 1900 and 9.8 since 1900.
  • Since 2010, the average number of pitchers winning 20 or more games per season is down to 1.9

Side note:  Those numbers provide even more contrast when you consider the increase in the number of teams and games played per season.

  • There has been just one 60-win season (Old Hoss Radbourn … 60-12, 1.38 for the 1884 Providence Grays.) Note: Some sources credit Radbourn with 59 wins, but the Elias Sports Bureau and Baseball-Reference.com list 60, and that’s good enough for me.
  • There were four seasons of between 50-59 wins – the most recent in 1885 (John Clarkson. Chicago White Stockings, NL, 53-16, 1.85).
  • There were 37 seasons of 40-49 wins – the most recent in 1908 (Ed Walsh, White Sox … 40-15, 1.42).
  • There were 117 seasons of 30-39 wins, the most recent in 1968 (Denny McLain, Tigers … 31-6, 1.96) and just 19 since 1900.

The above bullet points explain why, in some cases, I have broken out findings by pre-1900 and 1900 and beyond. So, let’s get on with it.

Highest Earn Run Average for a Pitcher Winning 20 or More Games in a Season – 5.08

I started with a look for “rarities” among 20-game winners – and I quickly found one. In MLB history, only two pitchers have had an earned run average of 5.00 or higher in a twenty-win season:

  • Bobo Newsom, 1938 Browns, 5.08;
  • Ray Kremer, 1930 Pittsburgh Pirates, 5.02.

Louis “Bobo” Newsom – In 1938, righty Newsom went 20-16, with a 5.08 ERA, for the St. Louis Browns. (The league ERA was 4.79.) Newsom had an up-and-down campaign. In his 20 wins, he put up a 3.13 ERA; in his 16 losses, his ERA was 8.11; and in his seven no-decisions, it was 5.65. His career somewhat mirrored that season.  Newsom won 20 or more games in three seasons (consecutively,  1938-40) and also lost 20 games in three seasons (1934-35 and 1941). He pitched in 20 MLB seasons (1929-30, 1932, 1934-48, 1952-53 … Robins/Dodgers, Cubs, Browns, Nationals, Red Sox, Tigers, Athletics, Yankees, Giants).  His final stat line was 211-222, 3.98.

Ray Kremer – In 1930, righthander Ray Kremer went 20-12, 5.02 for the Pirates. It was Kremer’s second 20-win season.  In 1926, he had gone 20-6, 2.61 for the Pirates – leading the NL in wins, winning percentage and ERA (2.47). Kremer had a solid 10-year MLB career (1924-33), all with the Pirates. He had only one sub-.500 season and won 15 or more games in seven of his ten MLB campaigns.  Kremer’s final line was 143-85, 3.76.

_______________________

This look at the highest earned run average among 20-game winners, led me (as one would expect) to search out the lowest ERA among 20-game winners.

Lowest Earned Run Average in a Season of 20 or More Wins – 1.04

Mordecai “Three Finger” Brown, 1906 Cubs

Photo: Paul Thompson, Public domain, via Wikimedia Commons

In 1906, righthander Mordecai Brown went 26-6 for the Cubs – and put up the lowest ERA ever in a season of 20 or more wins (1.04).  He made 36 appearances, completed 27 of 32 starts and led the NL in shutouts with nine.  Over the course of the season, Brown gave up more than two runs in just four games. From July 28 through September 13, he appeared in 14 games (11 starts) and went 11-0 with three saves (awarded retroactively). Over that span, He completed ten of his 11 starts and the eight runs he surrendered were all unearned.

The Hall of Famer went 239-130, 2.06 in 14 MLB seasons (1903-1916 … Cardinals, Cubs, Reds, and the Federal League St. Louis Terriers & Brooklyn Tip Tops).  He won 20 or more games in six seasons (consecutively from 1906 through 1911).


Honorable Mention … Bob Gibson, 1908 Cardinals

Bob Gibson came the closest to Mordecai Brown (above) among 20+ game winners, posting a 1.12 earned run average, while going 22-9 for the 1968 Cardinals. Gibson led MLB that season in ERA, as well as in shutouts (13).  He completed 28 of 34 starts. From June 6 through July 30 of that season, Gibson started, completed and won 11 games, throwing eight shutouts and giving up just one run in each of three other starts. 

The Hall of Famer pitched in 17 MLB seasons (1959-75), all for the Cardinals. He was an All Star in eight seasons, won 20 or more games in five and was a two-time Cy Young Award winner. He finished at 251-174, 2.91.  


Fewest Games Pitched in a Season of 20 or More Wins – 26

Fred Goldsmith & Jesse Tannehill

Fred Goldsmith, 1880, Cubs

In 1880, 24-year-old righty Fred Goldsmith – one of professional baseball’s earliest curveball specialists – went 21-3, 1.75 for the National League Champion Cubs (67-17-2). He pitched in just 26 games (24 starts) and put up a 1.75 Earned Run Average over 210 1/3 innings. (The National League ERA was 2.37 that season.) Goldsmith won 20 or more games four times in a six-season MLB career (112-68, 2.73 from 1879 through 1884).  A sign of the times: He threw 174 complete games in 185 starts.

Jesse Tannehill, 1902, Pirates

Southpaw Jesse Tannehill went 20-6 for the 1902 Pirates, pitching in 26 games (starting 24) and completing 23. He put up a 1.95 ERA in 231 innings pitched. (The 1992 NL average ERA was 2.78.) The Pirates went 103-36-3, finishing first in the National League. Tannehill pitched in 15 MLB seasons (1894, 1897-1909, 1911 … Reds, Pirates, the AL Boston Americans, Nationals). He won 20 or more games in six seasons – a high of 25 (13 losses) for the 1898 Pirates.

Pretty Darn Close

In 2014, Dodger lefty Clayton Kershaw came close to this record, going 21-3, 1.77 in 27 games (all starts). He led the NL in wins, winning percentage (.875), ERA and complete games. During the season, Clayton threw five complete games and pitched seven or more innings in 22 of his 27 starts and only gave up more than three runs once. Thus far, in his 16-season MLB career, Kershaw has won 20 or more games in two seasons, won three Cy Young Awards and been al All Star ten times.

______________________________

Fewest Starts in a Season of 20 or More Wins – 20

Bob Grim, 1954 Yankees

Photo: Jay Publishing via tradingcarddb.com, public domain, via Wikimedia Commons

In 1951, As a 21-Year-old in the Yankee farm System, righthander Bob Grim went 16-5, 2.58 at A and Double-A.  After this breakout year, his professional career was interrupted by military service. Although, as a Marine, he did pitch in 1952 and 1953 for the Camp Lejeune baseball team.

Grim’s service experience apparently served him well. In 1954, Grim made the Yankee squad out of Spring Training. He went on to a 20-6, 3.26 record and the 1954 AL Rookie of the Year Award. In the process, he compiled the fewest starts ever for an MLB 20-game winner (20 starts out of 37 appearances). That season, he went 12-6, 3.50 (with eight complete games) as a starter and 8-0, 2.70 in 17 games in relief.

Grim enjoyed an eight-season MLB career (1954-60, 1962 … Yankees, Athletics, Indians, Reds, Cardinals), going 61-41, 3.61 in 268 appearances (60 starts). That rookie season was his only 20-win campaign (his next high was 12 wins in 1957) and also marked his single-season highs in starts (20), complete games (8), innings pitched (199), and strikeouts 108).

_____________________________________


How About Those Rookies?  And a Rarity.

The fact that Bob Grim won 20 games in his rookie season led me to examine other rookie twenty-game winners.  On this one, I just took a look at rookie 20-game winners since 1900. (From 1872 through 1899 – 28 seasons – 48 rookies won 20 or more games in a season.  Since 1900, just 32 rookies have achieved that feat.)

I found another rarity – in the major-league career of Henry Schmidt.  Schmidt not only was a 20-game winner (22-13, 3.83) as a 30-year-old rookie for the 1903 Brooklyn Superbas, he is the only pitcher to win 20 or more games in his only MLB season.

Schmidt had been a star in the minor- and independent-leagues before he signed with the Superbas for the 1903 season. In 1902, he had gone 35-20 for the California League Oakland Clamdiggers. A gutsy performer (perhaps effectively wild), known for his ability to get into and out of trouble, Schmidt was the ace of the Brooklyn staff, despite having the highest ERA among the main pitchers in the rotation. After the season, Brooklyn offered Schmidt a healthy raise for 1904, but he returned the contracts unsigned, telling the team Eastern living was not for him. He instead signed with the Oakland Oaks of the Pacific Coast League. He never returned to the major leagues.

Schmidt is included in the chart below, which lists all rookies (since 1900) to win twenty or more games in a season – and notes which ones accomplished the feat in their debut seasons (rookie status can carry over if a pitcher logs less than 50 innings), as well las which rookies recorded just the one campaign of 20 or more wins.

______________________________________________


Special Mention – Something Old/Something New – Something Worth the Wait 

Photo by Keith Allison

In 2008, the Yankees’ Mike Mussina – at 39 years of age and in his 18th major-league season – tried something new.  The Hall of Famer won 20 games in a season for the first time in his career.  In the process he became the oldest MLB player to win 20 games for the first time, as well as setting the mark for the most seasons in the major leagues before recording a first 20-win campaign.  But wait, the story gets better. Mussina picked up that 20th win with a six -inning scoreless stint on September 28, as New York topped the Red Sox 6-2. It came in his 537th and last-ever MLB mound appearance. (Mussina retired after the season.) He finished the season at 20-9, 3.37 – and ended his MLB career with as 270-153, 3.68 record. 

_________________________________________________


How About a Look at Some Striking Statistics?

Most Strikeouts in a season of 20 or more wins – 513

Matt Kilroy, 1886 Baltimore Orioles, American Association

Matt Kilroy went 29-34, 3.37 as a 20-year-old rookie for the 1886 Baltimore Orioles. In the process, he started 68 games, completed 66 and fanned 513 batters in 583 innings.

Matt Kilroy’s 513 strikeouts in 1886 are the most ever in an MLB season.

Kilroy provides a prime example of the impact of overwork on pitchers’ arms in the early days of baseball.  In his first four seasons, he averaged 30 wins, 25 losses, 494 innings pitched, a 3.26 ERA and 270 strikeouts per campaign. In his final six seasons, he averaged just three wins (six losses), 77 innings pitched, a 4.37 ERA and 15 strikeouts.

 Since 1900 – Nolan Ryan, 1973 Angels, 383

Hall of Famer Nolan Ryan went 21-16 for the 1973 Angels and fanned 383 batters in 332 2/3 innings. – tossing 26 complete games in 39 starts. Ryan pitched in 27 MLB seasons, going 324-292, 3.19. He fanned a record 5,714 batters in 5,386 innings and topped 300 whiffs in six seasons.

 Fewest Strikeouts in a Season of 20 or More Wins – 18

William Cherokee Fisher, 1875 Philadelphia Whites

In 1875, Cherokee Fisher went 22-9. 1.99 for the National Association’s Philadelphia Whites. He fanned just 18 batters in 358 innings. Note:  In 1875, the NA’s overall ERA was 2.23 and pitchers averaged just one whiff per nine innings. (If he had fanned batters at the league-average rate, Fisher would have recorded 40 strikeouts.) Fisher pitched in seven MLB seasons (1871-76, 1887) in the National Association and National League – going 56-84, 2.61. 1875 was his only 20-win season.

 Since 1900 – 24 – Harry “Slim” Sallee, 1919 Reds

At 6’3” and 180-pounds, Slim Sallee earned his nickname. In 1919, in his 12th MLB season, at the age of 34, he had his only 20-win season (21-7, 2.60 for the Reds). He fanned just 24 batters in 227 2/3 innings. That season, NL pitchers averaged 2.9 whiffs per nine innings – which means had he fanned batters at the league-average pace, Sallee would have whiffed 73 batters. Sallee pitched in 14 MLB seasons (1908-1921 … Cardinals, Giants, Reds), going 174-143, 2.56.

In his lone 20-win campaign, Slim Sallee fanned just 0.9 batters per nine innings, the lowest figure of his MLB career (he averaged 2.7 whiffs per nine over his 14 MLB seasons).


Winning Percentage. It was the Best of Times – It was the Worst of Times.

The best and worst winning percentages among pitchers wining 20 or more games in a season both occurred before 1900.

Photo: Boston Red Stockings, Public domain, via Wikimedia Commons

Best – .915 – Al Spalding, 1875, Red Stockings. In 1875, Al Spalding of the National Association Boston Red Stockings went 54-5. 1.59 for a .915 winning percentage (the best ever among pitchers winning 20 or more games in a season.) Spalding pitched in 72 of the Red Stockings’ 79 games, starting 62 of them (52 complete games). Hall of Famer Spalding pitched in seven MLB seasons (1871-77).  He finished 251-65, 2.13 – with five seasons of 38 or more wins.

Worst – .333 – Jim McCormick, 1879 Cleveland Blues. Jim McCormick went 20-40 for the 1879 Cleveland Blues (NL) for a .333 winning percentage – the worst ever for a pitcher winning 20 or more games in a season. McCormick pitched in ten MLB seasons (1878-87, going 265-214, 2.43). He nearly reversed his W-L record in 1880, going 45-28, 1.85 for the Blues. Overall, he won 20 or more games in ten seasons (40 or more twice).

  • Best Since 1900 – .893  – Ron Guidry, 1978 Yankees. Now, if you want to look at the high and lows since 1900, the best winning percentage among 20-game winners belongs to the Yankees’ Ron Guidry, who went 25-3 (an .893 percentage), 1.74 in 1978. Guidry went 170-91, 3.29 over 14 seasons (1975-88), all with the Yankees. He won 20 or more games in three campaigns.

Worst Since 1900 – .488 – Irv Young, 1905 Boston NationalsJim Scott, 1913 White Sox. Young and Scott put up 20-21 records in those seasons. Young’s came in his rookie year (and was his only season with 20 or more wins). He pitched in six MLB seasons (1905-08, 1910-11 … Boston Nationals, Pirates, White Sox) and went 63-95, 3.11. Scott pitched in nine MLB seasons (1909-1917), all with the White Sox He went 104-114, 2.30 and twice won 20 or more games in a season. His career stat line was 107-214, 2.30.

 20-20 Vision – An Eyeful of Wins & Losses

Photo: Texas Rangers via tradingcarddb.com, public domain, via Wikimedia Commons

Looking at those 20-21 seasons (Irv Young & Jim Scott, above) got me to thinking about players who won and lost twenty or more games in the same season. Not a rarity early on. It happened 141 times before 1900.  Rare since 1900 though – only 11 such seasons. As the chart below shows, the most recent such instance is credited to the Braves’ Phil Niekro, who went 21-20, 3.39 in 1979, leading the NL in wins and losses in the same season. Notably, Phil’s brother Joe tied Phil for the NL lead in wins, with 21 (11 losses) for the Houston Astros. A Hall of Famer, knuckleballer Phil pitched in 24 MLB seasons (1964-87 … Braves, Yankees, Indians, Blue Jays), going 318-274, 3.35. He won 20 or more games twice and lost 20 or more twice.  From 1977 through 1980, he led the NL in losses four consecutive season.  In each of those seasons, the Braves finished last.


More one thing leads to another: Phil Niekro’s season of winning and losing at least 20 games and doing it for a last-place squad led me down another rabbit hole: Pitchers with at least 20 wins for a last-place team. It’s happened a lucky 13 times.  Here’s the list.


How About 40-40 Vision? Quite a Turnabout.

Only three pitchers recorded (separate) seasons of 40 wins and 40 losses during their MLB careers.

Will White won 43 games for the 1879 Reds (43-31, 1.99) and the very next season lost 42 games for the Reds (18-42, 2.14).  White pitched in 10 MLB seasons (1877-1886 … NL Boston, Reds and Wolverines and the American Association Cincinnati franchise). He won 229 and lost 166, with a 2.28 ERA. He won 20 or more games five times, including three seasons of 40 or more wins. He led the American Association with 40 wins in 1882 and 43 in 1883.

Jim McCormick lost 40 games (20 wins) for the 1879 Cleveland Blues and turned around to win 45 games (28 losses) for the Blues the following season. McCormick pitched in ten MLB seasons (1878-87 … NL Indianapolis Blues, NL Cleveland Blues, Union Association Cincinnati Outlaw Reds, NL Providence Grays, NL Cubs, NL Allegheny City). He won 20 or more games in eight of those seasons and lost 20 or more in six.

George Bradley, won 45 games (19 losses) for the 1876 St. Louis Brown Stockings (NL) and lost 40 (13 wins) for the 1879 Troy Trojans (NL). Bradley pitched in nine MLB seasons (1875-77, 1879-1884 …  the NL St. Louis Brown Stockings, Troy Trojans, Providence Grays, Detroit Wolverines and Cleveland Blues; the American Association Philadelphia Athletics; the Union Association Cincinnati Outlaws). He went 172-151, 2.43, with three seasons of 20 or more wins and three seasons of 20 or more loses.

A few Other 20-win factoids:

  • As you might guess, Cy Young holds the record for the most twenty-win seasons in a career (16) and the most consecutive seasons of 2o or more wins (14). Young pitched in 22 MLB seasons and went 511-315, 2.63.
  • Al Atkinson is the only MLB pitcher to have a season of 20 or more wins while pitching for three different teams. In his 1884 rookie season, he went 20-26, 3. 36 for the Union Association Baltimore Monumentals (3-5); Chicago/Pittsburgh of the Union Association (6-10); and Philadelphia Athletics of the American association (11-11).
  • Grover Alexander (1916 Phillies) and George Bradley (1876 St. Lous Brown Stockings) share the record for the most shutouts thrown in a season of 20 or more wins (16). Alexander went 33-12, 1.55 and Bradley went 45-19, 1.23) in their record-setting seasons.
  • Denny McLain (1966 Tigers) gave up the most home runs in a season of 20 or more wins (42). He went 20-14, 3.92 that season.
  • The fewest hits allowed per nine innings in a season of 20 or more wins is 5.3 – Luis Tiant, 1968 Indians, in a 21-9, 1.60 season.
  • The youngest-ever 20-game winner was 17-year-old Willie McGill, who went 20-14 for the American Association Cincinnati Kelly’s Killers and St. Louis Browns in 1891. McGill went 2-5 for Cincinnatti and 18-9 for St. Louis.
  • The oldest pitcher to log a season of 20 or more wins was the Braves’ Warren Spahn, who went 23-7, 2.60 – as  a 42-year-old – in 1963.  Spahn tossed 22 complete games in 33 starts that season.

Primary Resources:  Baseball-Reference.com; Elias Sports Bureau; Baseball Maniac’s Almanac Sixth Edition, Bert Randolph Sugar, Sports Publishing, 2023.

Remember, There is still time to vote in The Baseball Roundtable Fans’ Hall of Fame Balloting (and qualify for the prize drawing). Click here to go directly to the ballot.  Click here for a post taking a look at the career of the player on the ballot.


Baseball Roundtable – Blogging Baseball Since 2012.

100Baseball Roundtable is on the Feedspot list of the Top 100 Baseball Blogs.  To see the full list, click here.

Baseball Roundtable is also on the Anytime Baseball Supply Top 66 Baseball Sites list.  For the full list, click here

I tweet (on X) baseball @DavidBaseballRT

Follow/Like Baseball Roundtable’s Facebook Page here.  Find More baseball commentary; blog post notifications; PRIZES.

Member: Society for American Baseball Research (SABR); Negro Leagues Baseball Museum; The Baseball Reliquary.

P1013

Baseball Roundtable 2024 (unofficial ) Baseball Hall of Fame Fan Ballot

The 2024 Baseball Writers Association of America (BBWAA) Baseball Hall of Fame ballots are out – and that means the 2024 Hall of Fame Debate Season is officially underway!  Eligible BBWAA members have until December 31 to cast their ballots (they can vote for up to ten candidates), with results announced January 23, 2024 and the 2024 Induction Ceremony slated for July 21.  This year’s traditional ballot includes 14 holdovers from last year, along with 12 newcomers.  This also means the Baseball Roundtable (unofficial) Baseball Hall of Fame Fan Ballot is once again open for voting. This unofficial balloting will officially close at midnight January 2. 

In this post, BBRT will share:

  • The Roundtable’s predictions for the official BBWAA balloting; BBRT’s ballot (if I had one);
  • A deep look at all the candidates on the ballot; and
  • A link to BBRT’s unofficial fan ballot – please take a few minutes to follow the link and cast your votes – you could become eligible for a baseball card and bobblehead surprise package.

—PARTICIPATE IN BASEBALL ROUNDTABLE’S  2023 FANS’ HALL OF FAME BALLOT—


Baseball Roundtable is once again conducting an unofficial fan ballot – to cast your vote(s), click here.   Remember, you can vote for up to ten of the nominees for 2024 induction.  If you want to read through the nominees’ bios first, there is another link to the BBRT Fan Ballot following the bios (near the end of this post).  BBRT will be providing updates on the fan balloting, as well as a post-election comparison of fan votes as compared to the final BBWAA results.

Also, if you leave your email address in the Contact Info section at the end of the ballot, you will be entered in a bobblehead and baseball card “surprise-prize” drawing.  You will find a link to the ballot after the biographies.

To skip the post and go directly to the fan ballot, click here.

As you consider this year’s slate of candidates, BBRT would stress that all the players on the ballot – even those who remain for only one voting cycle – deserve recognition. To rise to the major leagues, last ten years and make it past the Hall of Fame Screening Committee is a significant accomplishment in itself.  In fact, the annual ballot release is a highlight for Baseball Roundtable, as it provides a chance to acknowledge the accomplishments of all the candidates – not just the favorites for election.  For example, a review of this year’s ballot gives us the opportunity to honor Mark Buehrle’s perfect game; the 30-30 seasons of Brandon Phillips and David Wright; Bobby Abreu’s 30-40 season; Jose Bautista’s nickname and 54-homer season; Jose Reyes’ batting title; Matt Holliday’s season-opening 45-game streak of reaching base safely; and more.

Now on to the official 2023 Baseball Hall of Fame election process itself – and, then, a look at the players on the ballot for 2023.

BASEBALL HALL OF FAME ELIGIBILITY/CRITERIA FOR ELECTION

The basic rules for eligibility are that a player must have played at least ten seasons and be retired for at least five years. In addition, the player must be approved for the ballot by the Hall of Fame Screening Committee.

A player can remain on the ballot for up to ten years, but must receive at least five percent of the vote in the preceding year’s ballot to remain on the ballot.  Each voter can vote for up to ten candidates.  Election requires that a player be named on at least 75 percent of the ballots cast.

The criteria for election: “Voting shall be based upon the player’s record, playing ability, integrity, sportsmanship, character, and contributions to the team(s) on which the player played.”

A few preliminary comments form Baseball Roundtable.

This year’s ballot has a strong cadre (12) of first-time candidates, led by Adrian Beltre, Joe Mauer and Chase Utley. I expect at least one of those (perhaps two) to be elected and about half of the twelve first-timers to garner enough support to remain on the ballot.  In contrast, in 2023, when there were 14 first-timers on the ballot, none were elected and 12 dropped off the ballot.

Voters have shown a willingness to vote in first timers.  In the last ten elections 14 first-timers have been granted a ticket into the Hall: 2022 – David Ortiz; 2020 – Derek Jeter; 2019 – Mariano Rivera & Roy Halladay; 2018 – Chipper Jones & Jim Thome; 2017 – Ivan Rodriguez; 2016 – Ken Griffey, Jr.; 2015 – Randy Johnson, Pedro Martinez & John Smoltz; 2014 – Greg Maddux, Tom Glavine,&  Frank Thomas.

The 2023 ballot also includes just one player in his final year of eligibility – Gary Sheffield. In the past three elections, Sheffield has moved from 40.6% to 55.0%.  Twenty points seems an unlikely jump.

The holdovers with the most support year ago are  Todd Helton (72.2%), Billy Wagner (68.1%) and Andruw Jones (58.1%). The Hall seems withing striking distance for Helton and Wagner and I expect them to make the trip.

Baseball Roundtable Predictions for the BBWAA Balloting: This year I expect Todd Helton and Billy Wagner to get the call, along with first-time nominee Adrian Beltre. I also have a good feeling about Joe Mauer’s chances to join Beltre as a first-time electee.  (More thoughts on individual candidates in the bios.)

Again, to jump directly to the ballot itself, click here.

— PLAYERS WHO WOULD GET BBRT’S VOTE –

Adrian Beltre – 3B, 1998-2018 (Dodgers, Mariners, Red Sox, Rangers) … First Year on the Ballot

Photo: Cacophony, CC BY-SA 3.0 <http://creativecommons.org/licenses/by-sa/3.0/>, via Wikimedia Commons

Adrian Beltre offers a combination that always impresses The Roundtable – lumber and leather.  He not only swatted 477 home runs over his career, but also earned five Gold Gloves and four Silver Slugger Awards (precious metal in The Roundtable’s view).

Beltre, signed by the Dodgers (out of the Dominican Republic) as a 15-year-old in 1994 (the Dodgers were punished by MLB for signing Beltre before his 16th birthday), was in the majors by the age of 19 – and he was still an active major-leaguer (119 games) in 2018 (his age-39 season).

Beltre was a three-time All Star. He led his league in home runs once (with 48 for the Dodgers in 2004) – and had nine seasons of 25 or more homers, as well as five seasons of 100+ RBI and seven seasons with an average of .300 or better. He also led the league in hits and doubles once each.

Cycling’s Yellow Hersey.

Adrian Beltre is one of just six players to hit for the cycle (single, double, triple, home run in one game) three times in his career.  He accomplished the feat with the Mariners in 2008 and the Rangers in 2012 and 2015. Others on this short list include: John Reilly, Bob Meusel, Babe Herman, Christian Yelich and Trea Turner.

Beltre is among MLB’s top-50 all time in: base hits (3,166 – 18th); doubles (636 – 11th); home runs (477 – 31st); extra-base hits (1,151 – 15th); total bases (5,309 – 15th); and RBI (1,707 – 25th).  In the field, Beltran is second all-time in putouts at third base (2,194 and five seasons leading the league); third in assists at third base (5,182, once leading the league); and second in double plays at third base (523, once leading the league).

Adrian Beltre’s Best Season: In 2004, Beltre went .334-48-121 for the Dodgers – leading the league in home runs. That season he also collected a career-high 200 hits, scored a career-high 104 runs; and delivered a career-best 376 total bases.

_______________________________________

Todd Helton – First Base, 1997-2013 (Rockies) … Sixth year on the ballot, 72.2 percent last year.

Todd Helton moved from 16.5% of the vote to 72.2% percent between his first and fifth years on the ballot. It looks like this should be the year for Helton. Helton was hampered a bit in hie early years on the ballot by the fact that he spent his entire 17-year career with the Rockies (playing half his games in hitter-friendly Coors field).  Helton, who put up a .316 career average, hit .345 at home and .287 on the road. Despite that split, Helton’s body of work clearly deserves Hall of Fame consideration.

Helton was a five-time All Star, three-time Gold Glover and four-time Silver Slugger. He hit over .300 in 12 seasons – and won the NL batting crown in 2000 with a .372 average. His 59 doubles that season are tied for the seventh-most all-time. Helton drove in 100 or more runs in five seasons and scored in triple figures six times. His 1,335 walks (38th all-time) indicate the respect he earned at the plate.  Helton also ranks fifth in games played at first base, third in career assists at the position, 13th in putouts and third in double plays.


400 Rocks

Todd Helton is one of only 18 players to reach 400 or more total bases in a season – and one of only seven players to have multiple 400+ total base campaigns. He is also one of only 12 players with 100 or more extra-base hits in a season; one of only three with multiple seasons with at least 100 extra-base hits and the only player with consecutive seasons of 100 or more extra-base hits (2000-2001).

Todd Helton’s Best Season: In 2000, Helton won the NL batting crown with a .372 average – and also led the league in base hits (216), doubles (59), RBI (147), on-base percentage (.463), slugging percentage (.698) and total bases (405).  He also scored 138 runs and hit 42 home runs.

He gets BBRT’s vote (as he has in the past). I expect this is his year to pass 75 percent.

__________________________________

Billy Wagner – LHP, 1995-2010 (Astros, Phillies, Mets, Red Sox, Braves) … Ninth year on the ballot, 68.1 percent last year.

Billy Wagner was a seven-time All Star, who amassed 422 saves (sixth all-time) in a 16-season MLB career.  He had nine seasons of 30 or more saves; a career ERA of 2.31; 1,196 career strikeouts in 903 innings; and 47-40 won-lost record.

_____

Whiff-and-Poof

In 1992, playing for Ferrum College, Billy Wagner set an NCAA record for strikeouts per nine innings in a season at 19.3.

_____

Billy Wagner’s Best Season: In 2003, Wagner went 1-4, 1.78 for the Astros, saving 44 games and fanning 105 batters (and walking just 23) in 86 innings.

BBRT thinks Wagner belongs in the Hall (based on his 400+ saves) – and hopes that momentum continues to build.  Wagner has been gaining more support lately – in the last five ballots his percentages have gone 16.7, 31.7, 46.4 and 51.0, 68.1.  He should gain more ground in this year’s ballot, and has a good chance to make the 75 percent mark.  He gets my vote.

________________________________

Joe Mauer – C/1B, 2004-2016 (Twins) … First Year on the Ballot.

Photo: Keith Allison from Hanover, MD, USA, CC BY-SA 2.0 <https://creativecommons.org/licenses/by-sa/2.0>, via Wikimedia Commons

Maybe I’m being a homer (living in the Twin Cities), but I believe Mauer has earned a first-ballot selection. Consider that among players playing primarily catcher, Maurer is:

  • The first and still only AL catcher to win a batting title;
  • One of just seven major-league catchers to win a batting title (Negro Leagues records form 1920-48 are now considered major league);
  • One of just two catchers to win three batting titles (the other is Josh Gibson, who won three Negro National League II batting titles).

Mauer was a six-time All star and the 2009 American league MVP – and has three Gold Gloves and five Sliver Slugger Awards on his Hall of Fame resume

Mauer was primarily a catcher from 2004 until 2013, when a  concussion led to a move to first base. During those ten seasons behind the plate, he hit .323-105-634. Mauer’s final MLB stat line was .306-143-932, with 1,018 runs scored and 2,123 hits.

For The Roundtable, those ten pre-concussion seasons – with three batting titles, an MVP Award, six All Star selections, five Silver Sluggers and three Gold Gloves is enough to put Mauer in the Hall.  He gets my vote.

Joe Mauer’s Best Season:  In 2009, Joe Mauer hit .365, with 28 home runs, 96 RBI and 94 runs scored. He led MLB in average and on-base percentage (.444) and led the AL in Slugging percentage.  He was the AL MVP, getting 27 of 28 first place votes.

-________________________________________

Carlos Beltran – Outfield, 1998-2017 (Royals, Astros, Mets, Giants, Cardinals, Yankees, Rangers) … Second year on the ballot, 46.5 percent last year.

Photo: djprybyl on Flickr (Original Versions) UCinternational (Crop), CC by 2.0 <https://creativecommons.org/licenses/by/2.0>, via WikimediaCommons

Carlos Beltran played in 20 MLB seasons He had his best years with the Mets, making the All-Star team in five of seven seasons. (Beltran was a nine-time All Star.)

____________________

Let’s Get This Party Started

Beltran was the American League Rookie of the Year in 1999, when he hit .293-22-108 for the Royals, with 27 steals and 112 runs scored.

___________________

In his 20 MLB campaigns, Beltran hit .279-435-1,587, with 312 stolen bases and 1,582 runs scored. He ranks in MLB’s top 50 in home runs (47th), RBI (41st) and total bases (34th). His 2,725 hits are 62nd all-time and his 1,582 runs scored 53rd.

Not Exactly Playing It Safe, But It Works

Among players with at least 200 stolen base attempts, Carlos Beltran’s 86.4 percent success rate is fourth all-time.

Beltran drove in 100 or more runs in eight seasons, scored 100 or more runs in seven seasons, hit 30+ home runs in four campaigns (a high of 41 in 2006), stole 25 or more bases five times (a high of 42 in 2004). He was also a three-time Gold Glover.  Beltran was also a solid post-season performer, hitting .307-16-42 in 65 post-season games. In 2004, with the Astros, he hit .435, with 20 hits, eight home runs, 14 RBI, 21 runs scored and six steals in 12 post-season games (NL Division Series & NL Championship Series).  You read that right, 21 runs scored in 12 games.

Carlos Beltran’s Best Season: In 2006, Beltran hit .275, with 41 home runs, 116 RBI, 127 runs scored and 18 stolen bases and also won a Gold Glove. He finished fourth in the NL MVP voting.

Beltran would get Baseball Roundtable’s vote and I expect him to finish in the neighborhood of 57-60 percent in this year voting. His .279 career average and the fact that he never led the league in any of the major offensive categories may cost him a few votes. Longer-term, I’d say h Hl is in nis future. Right now, he gets my vote.

_______________________________

Andruw Jones – CF, 1996-2012 (Braves, Dodgers, Rangers, White Sox, Yankees) … Seventh Year on the Ballot, 58.1 percent last year.

Carl Fredrickson (Digi360) from Roswell, GA, USA, CC BY 2.0 <https://creativecommons.org/licenses/by/2.0>, via Wikimedia Commons

In a 17-season career – primarily patrolling centerfield – Jones won ten Gold Gloves (consecutively, 1998-2007). He was a defensive icon in the garden. At the plate, he hit .254, with 434 home runs (48th all-time), 1,289 RBI and 1,204 runs scored. He topped 25 home runs in ten seasons (six over thirty and a league-leading and career-high 51 in 2005). He scored 100 or more runs four times, drove in 100+ five times and stole twenty or more bases in a season four times.  Jones appeared in 76 post-season games, hitting .273, with ten home runs and 34 RBI.

On the Big Stage

In the 1996 World Series, Andruw Jones – just 19-years-old – hit .400 (8-for-20) with two home runs and six RBI, becoming the youngest player to go yard in the Fall Classic.

Andrew Jones’ Best Season: In 2005, Jones hit only .263, but led the NL in home runs (51) and RBI (128) and won a Gold Glove for his play in CF.  He finished second in the MVP voting to Albert Pujols (.330-41-117).

Jones’ ten Gold Gloves work in his favor, but – over the long haul – that .254 average (he only hit .300 or better once and over .270 only four times) dampen his HOF chances. Still that power and his defense get him Baseball Roundtable’s vote. And, he is showing momentum. His vote total in recent balloting:  2020 – 19.4%; 2021 – 33.9%;2022 – 41.4%; 2023 – 58.1%. This may not be his year, but he still has time. I expect him to move up a few percentage points in this year’s balloting.

_________________________________

Francisco Rodriguez – RHP, 2002-17 (Angels, Mets, Brewers, Orioles, Tigers) – Second year on the Ballot., 10.8 percent last year.

Photo: Toasterb at the English language Wikipedia project, CC BY-SA 3.0 <http://creativecommons.org/licenses/by-sa/3.0/>, via Wikimedia Commons

Francisco Rodriguez played in 16 MLB seasons, going 52-53, 2.86 with 437 saves (fourth all-time) in 948 mound appearances (21st all-time).

Rodriguez was a six-time All Star. He led the AL in saves three times and saved 40 or more games in six seasons and 20 or more in 11. In the five seasons from 2005 through 2009, he averaged 46 saves per season.

Rodriguez had an earned run average under 2.00 in two seasons and under 2.50 in seven campaigns. A true closer, Rodriguez pitched 976 innings in his 948 appearances, fanning 1,142 batters (10.5 per nine innings).

One of A Kind

Francisco Rodriguez, who saved 62 games for the 2008 Angels, is the only pitcher in MLB history with 60 or more saves in a season.

In his 2002 debut MLB season, the 20-year-old Rodriguez pitched in 11 post-season games for the Angels – recording five wins (one loss) – giving up four earned runs in 18 2/3 innings, while fanning 28. What makes this especially noteworthy is that Rodriguez made his MLB debut on September 18 of that season and went 0-0, with no saves in five games (5 2/3 innings). So, he had five post-season victories before he recorded his first regular-season decision of any kind.

Francisco Rodriguez’ Best Season: In 2008 (Angels), Rodriguez saved an all-time record 62 games – in 69 opportunities.  He put up two wins (three losses) and a 2.24 ERA in 76 appearances – and fanned 77 batters in 68 1/3 innings.

BBWAA voters have traditionally been very demanding of relievers (although the recent inductions of Mariano Rivera and Trevor Hoffman are a good sign – but they, of course, both had 600+ saves). It also helps that Lee Smith (478 saves) was elected by the Today’s Game Committee in 2019. Still given how long it’s taken Billy Wagner to move past the 65 percent mark, I don’t expect Rodriguez to make it this year.  I would expect him to move closer to the 20-25 percent4 line. He would get my vote.

_______________

Torii Hunter -(OF, 1997-2015 (Twins, Angels, Tigers) … Fourth Year on the Ballot, 6.9 percent last year.

Photo: Keith Allison, CC BY-SA 2.0 <htt[ps://creativecommons.org/licenses/by-sa/2.0>. via Wikimedia Commons

Okay, this may be a bit another “homer” vote, since Torii Hunter was a star with my home team Twins – but it also reflects my special admiration for “leather and lumber” guys. Torii Hunter played 19 MLB seasons and was a five-time All Star, nine-time Gold Glover and two-time Silver Slugger.

For his career, Hunter hit .277 (2,452 hits), with 353 home runs, 1,391 RBI, 1,296 runs scored and 195 stolen bases. He hit 20+ home runs in 11 seasons, drove in 100+ runs twice and stole 20+ bases in three campaigns. Hunter hit .274-4-20 in 48 post-season games.

Hunter led his league in CF assists three times, CF putouts once and double plays turned out of CF four times. He also led his league’s right fielders in putouts, assists and double plays once each.

Spider-Man

Torii Hunter earned the nicknamed spiderman for his outstanding outfield play.

Torii Hunter’s Best Season:  In 2007 (Twins), Hunter hit .287, with 28 home runs, 107 RBI, 94 runs scored and 18 steals – although he can look back on at least four seasons with very similar numbers.

Nine Gold Gloves, five All Star selections and 353 home runs represent some pretty good credentials.   Hunter’s chances to make the Hall would have been better with a couple of standout/spectacular/memorable seasons mixed in with all those consistently very, very good campaigns that fans came to expect.  He also earns extra credit for leadership and character, as he was known as a leader in the club house and an asset in the community. He may slip off the ballot this year, but he gets my vote.

___________________________________________

Photo: Keith Allison on Flickr. Cropped by User: Staxringold., CC BY-SA 2.0 <https://creativecommons.org/licenses/by-sa/2.0>, via Wikimedia Commons

Andy Pettitte – LHP, 1995-2010, 2012-13 (Yankees, Astros) … Sixth year on the ballot, 17.0 percent last year.

As I’ve noted in past years, I had to think for a while on this one (and will probably get some push back from readers), largely because a major part of Andy Pettitte’s HOF resume was achieved in the post-season and there was some PED-controversy surrounding Pettitte.  (Note: Pettitte admitted to using HGH while recovering from elbow surgery – a couple of years before the substance was banned.  He took responsibility and apologized.)

Pettitte holds the MLB post-season marks for most wins (19 … versus 11 losses), innings pitched (276 2/3), games started (44) and is fourth in strikeouts (183). His post-season accomplishments include a 3.81 career ERA and the 2001 American League Championship Series MVP Award.

Pettitte also was no slouch in the regular season. He finished with 256 wins (153 losses) and a 3.85 ERA. His 256 wins currently rank 43rd all-time and his 521 starts 41st.  Pettitte won 20 games in two seasons and 14 or more games 12 times – leading the AL with 21 wins in 1996. The three-time All Star struck out 2,448 batters (46th all-time) in 2,316 innings.

Ready, Willing and Able …

Andy Pettitte started 30 or more games in a season 12 times, leading his league three times (1997, 2006, 2007).

Andy Pettitte’s Best Season: In 1997, following a 21-8 campaign in 1996, Pettitte went 18-7, with a 2.88 ERA (fourth-best in the AL), leading the league in starts with 35, finishing third in innings pitched (240 1/3) and eighth in strikeouts (166).

Pettitte’s post-season numbers, plus 256 regular-season victories and the fact that he had 100+ more career wins than losses secure BBRT’s vote. He has a long way to go with the BBWAA voters. The Roundtable thinks he deserves better and see Pettitte as significantly  underrated by BBWAA voters.

_________________

Bartolo Colon – RHP 1997-2009, 2011-2018) … Indians, Expos, White Sox, Angels, Red Sox, Yankees, A’s, Mets, Braves, Twins, Rangers.

Photo: Jeffrey Hayes, CC BY 2.0 <https://creativecommons.org/licenses/by/2.0>, via Wikimedia Commons

Okay, Bartolo Colon was not originally on my “vote for” list, but looking a little deeper, I changed my mind.  How can you not like a guy, who pitches until he’s 45-yers-old, is listed in baseball-refence.com as 5’11’ and 285 pounds, takes the mound for eleven different MLB teams, practically explodes with his love for the game, wins 247 games and carried the nickname “Big Sexy.”

Bartolo Colon pitched in 21 MLB seasons, going 247-188, 4.12 in 565 appearances, (552 starts). He was a three-time All Star, won the 2005 AL Cy Young Award, won 15 or more games in eight seasons, fanned 2,535 batters in 4.461 2/3 innings.  He ranks 51st all-time in wins, 36th in strikeouts,

Ten-Four, Good Buddy

In 2002, Bartolo Colon started the season with the Indians and ran up a 10-4, 2.55 record before being traded to the Expos on June 27 – where he ran up a 10-4, 3.31 – giving him an evenly split 20-8 campaign.

Bartolo Colon’s Best Season.  In 2005, with the Angels, Colon was the AL Cy Young Award winner with a 21-8, 3.48 campaign

Just Put Up A Target, I’ll Do The Rest

On April 18, 2012, Bartolo Colon threw 38 consecutive strikes (pitching for the A’s against the Angels).  The streak lasted from the second pitch of the fifth inning to the seventh pitch of the eighth inning. A few stats: 35 of the pitches were fastballs; there was only one swing and miss; there were 17 called strikes; there were ten foul balls; ten balls were put in play. For the game, Colon went eight scoreless innings (four hits, no walks, five whiffs) in a 6-0 win.  He threw 108 pitches, 82 strikes.

Colon clearly had an exciting career, and 247 wins cannot be ignored. Ultimately, his 4.12 ERA may dampen HOF changes. This vote came from the heart.  It will be fund to see him on the ballot again in the coming year., although not as much fun as seeing him pitch.

Tired of reading? To cast your vote, click here. 

THE REST OF THE SLATE 

So, with BBRT’s unofficial ballot covered, let’s look at the remainder of candidates – in alphabetical order.  Note: Here you will find a host of players with solid (but perhaps not HOF-level) career numbers and accomplishments – as well as a few that remain on the sidelines for other reasons.

Bobby Abreu – OF, 1996-2012, 2014 (Astros, Phillies, Yankees, Angels, Dodgers, Meets) … Fifth Year on the Ballot, 15.4 percent one year ago.

A solid .291 career hitter (2,470 base hits), Abreu hit .300 or better in six seasons. He hit 20 or more round trippers in 10 campaigns, stole 20 or more bases 12 times (a high of 40 in 2004), drove in 100 or more runs eight times and scored at least 100 runs eight times.   Abreu also walked 1,476 times – including 100 or more free passes in eight straight seasons (1999-2006).

In the Top 50 … 

Bobby Abreu’s 1,476 walks are 20th all-time; his 574 doubles are 25th; his 3,733 putouts as a RF are 12th; and his 130 assists as a RF 28th. 

In 20 post-season games, Abreu went 19-for-67 (.284), with one home run and nine RBI.

Bobby Abreu’s Best Season: In 2004, as a Phillie, Abreu hit .301, with 30 home runs and 40 steals. An All Star that season, he also drove in 105 runs and scored 118.

Abreu’s 400 steals are an HOF plus, as are his 30-40 season in 2004 and his eight campaigns with 100 or more RBI.  Had he reached 300 home runs; it would have really boosted his status with the writers.  He’s also hurt by the fact that he only made two All Star teams in his 18 seasons.

_____________

Jose Bautista – OF/3B, 2004-2018 (Orioles, Rays, Pirates, Blue Jays, Braves, Mets, Phillies) … First Year on the Ballot.

In his 15 MLB seasons, Bautista was an All Star six times (consecutively 2010-15). Overall, he hit .247, with 344 home runs, 975 RBI and 1,022 runs scored in 1,798 games. He earned the nickname Joey Bats in Toronto, where he had his best seasons. From 2008 through 2017 (with the Blue Jays), he hit .253-288-766 and twice lead the AL in home runs (54 in 2010 and 43 in 2011).

Jose Bautista’s Best Season: In 2011, Bautista hit .302-43-103 – also scoring 105 runs and leading the MLB with 132 walks. (This, by the way, followed up a .260-54-124 season in 2010.)

A solid career, should be good enough to keep him on the ballot for 2025, but short of Hall of Fame expectations.

_______________________________________

Mark Buehrle – LHP, 2000-15 (White Sox, Marlins, Blue Jays … Fourth year on the ballot, 10.8 percent one year ago.

Mark Buehrle pitched in 15 MLB campaigns and threw 200 or more innings in all but his rookie and final seasons. Buehrle was a five-time All Star and put up a 214-160, 3.81 record, with 1,870 strikeouts in 3,283 1/3 innings. He twice led his league in starts and twice topped his league in innings pitched. He won ten or more games in 15 consecutive seasons and six times won 15 or more.  Buehrle also earned four Gold Glove Awards.

Near-Perfect and Perfect

Mark Buehrle’s HOF resume is bolstered by a no-hitter tossed on April 18, 2007 – when his White Sox topped the Rangers 7-0 and Buehrle faced the minimum 27 batters.  The only Texas’ base runner came on a fifth inning, one-out walk to Sammy Sosa, whom Buehrle then picked off first base.  Buehrle notched eight strikeouts in the game, which was so-o-o very close to a “perfecto.”

Buehrle got his perfect game two years later (July 23, m 2009), when he recorded a clean slate in a 5-0 ChiSox win over the Rays.  He fanned six in that one.

Mark Buehrle’s Best Season:  In 2005, Buehrle went 16-8, 3.12 for the White Sox.

If he had 250 wins to go with the no-hitter, perfect game and four Gold Gloves, Buehrle would have had my vote.  With 214 wins, no Cy Young Award and no 20-win season, Buehrle appears short of what voters are looking for.

____________________________

Adrian Gonzalez – First Base, 2004-18 (Rangers, Padres, Red Sox, Dodgers, Mets … First Year on the Ballot.

Adrian Gonzalez had a solid 15-season MLB career – hitting .287-317-1,202, with 2,050 hits and 997 runs scored.  He was a five time All-Star (2008-11) and picked up three Gold Gloves and a pair of Silver Slugger Awards. He led the league in hits once, RBI one and walks once.

Gonzalez hit 27 or more home runs in seven seasons (a high of 40 in 2009); drove in 100 or more runs in seven seasons; and scored 100+ runs in three campaigns.

Adrian Gonzalez’ Best Season: In 2011, Gonzalez hint .338-27-117, with a league-leading 213 hits and 108 runs scored for the Red Sox.

Gonzalez had some strong numbers, but the competition at first base if fierce. Still, there is plenty there to keep him on the ballot for next year.

______________________________________________

Matt Holliday – OF, 2007-18 (Rockies, Cardinals, A’s, Yankees,) … First year on the Ballot.

Matt Holliday fashioned a very good fifteen-season MLB career – hitting .299, with 316 home runs, 1,220 RBI and 1,157 runs scored over 1,903 games. He was a seven-time All Star and scored 100+ runs in four seasons, drove in 100+ in five seasons and hit 25 or more home runs five times (a high of 36 in 2007).

Matt Holliday’s Best Season: In 2007, Holliday (with the Rockies) led the NL in average (.340); hits (216); doubles (50); RBI (137) and total bases (386). That season he also hit a career-high 36 home runs.

Home Cookin’

Over his career, Holliday played 20.5 percent of his games at Coors field, where he hit .360. Away from Coors, he hit .283. In his highlight year, (2007), he hit .376-25-82 in 82 games at Coors and .301-11-55 in 76 games on the road.

___________________________

Let’s Get This Party Started

From Opening Day (April 5) through June 2, 2015, Matt Holliday (Cardinals) reached based safety in 45 consecutive games. During the streak, he hit .319 (50-for-157), with 30 walks, four HBP, three homers, 24 RBI and 18 runs scored.

__________________________

Holliday’s seven All Star selections, four Silver Slugger Awards, 2,000+ hits and 300+ homeruns should be more than enough should be enough to keep him on the ballot going forward.

____________________________________

Victor Martinez – C/1B/DH, 2002-11, 2013-18 (Indians, Tigers, Red Sox) … First Year on the Ballot

Victor Martinez – a switch-hitting catcher – was a five-time All Star, who hit .295-246-1,178 (with 914 runs scored) over 16 MLB seasons (1,973 games). He hit .300+ in nine seasons – and .330 or better in three of those.

Getting on with Getting ON

In 2014 Victor Martinez led the American League with a .409 on-base-percentage and a .974 OPS. It earned him a lot of respect, He also led MLB with 28 intentional walls.

Martinez hit 20 or more home runs in seven seasons, tallied 100+ RBI in five

Victor Martinez’ Best Season: In 2014, Martinez hit .335-32-103 for the Tigers. He collected 188 hits and scored 87 runs.  That season he finished second in the AL MP voting to the Angels’ Mike Trout (.287-36-111, with 115 runs scored).

The fact that Martinez spent about half his career as a DH may cost him some votes.

__________________________________________

Brandon Phillips – 2B, 2002-18 (Indians, Reds, Braves, Angels, Red Sox) … First Year on the Ballot.

Brandon Phillips hit .257-211-951, with 1,005 runs scored and 209 stolen bases over 17 MLB seasons. He was a three-time All Star and a four-time Gold Glover. Phillips twice scored 100 or more runs in a season and once drove in 100+. He stole 20 or more bases in five campaigns and hit 20 or more home runs in three seasons. In the field, he twice led NL second basemen in putouts, three times led in assists and three times posted the league’s best fielding percentage among keystone sackers.

Brandon Phillips’ Best Season:  In 2007 (Res), Brandon Phillips posted a 30-30 campaign. He hit .288, with 30 home runs, 32 steals, 944 RBI and 107 runs scored.

_____________________________________

Manny Ramirez – (Outfield, 1993-2011) – Eighth year on the Ballot, 33.2 percent last year.

Manny Ramirez played 19 MLB seasons, collecting 2,574 hits, a .312 batting average, 555 home runs (15th all-time) and 1,831 RBI (20th all-time). Ramirez was a 12-time All Star and led the AL in average (2002), home runs (2004) and RBI (1999) once each.  Ramirez won nine Silver Slugger Awards, including eight consecutive (1999-2006), hit .285 with 29 home runs in 111 post-season games and was the 2004 World Series MVP.  He hit 30 or more home runs in twelve seasons (five of 40+), scored 100 or more runs six times, hit .300 or better in 11 seasons and topped 100 RBI 12 times.

It’s Post Time …

Manny Ramirez’ 29 post-season home runs are first all-time, while his 78 post-season RBI rank second. In addition, he is the all-time post-season leader in walks (72, tied with Chipper Jones) and ranks third in post-season hits (117, tied with Jose Altuve) and fourth runs scored (67).

Manny Ramirez’ Best Season: In 1999, with Cleveland, Ramirez hit .333, with 44 home runs and 165 RBI (14th-most in a season all-time) in 140 games.

Ramirez clearly put-up HOF-caliber numbers, but two PED-related suspensions continue to hurt his chances.  Ramirez does not seem to be gaining much tractions.  In his first year on the ballot, he picked up 23.8 percent of the vote – and after seven years he is only at 33.2 percent.

_______________________________________

Jose Reyes, SS (2003-18 (Mets, Marlins, Blue Jays, Rockies) … First Year on the Ballot.

Jose Reyes was a solid contact hitter (.283 career average, with 2,138 hits in 1,877 games over 16 MLB seasons) with speed (four times leading the league in triples, three times in stolen bases.). The four-time All Star also led the league in hits once (with 204 in for the Mets in 2008) and won the 2011 batting title (Mets) with a .337 average. Reyes finished with 517 steals – 33rd all time.

From 2005 through 2008 (his age-22 through age-25 seasons), Jose Reyes’ averaged 158 games played, a .287 average, 195 hits, 32 doubles, 16 triples, 14 home runs, 66 RBI, 113 runs scored and 64 steals.

#InBaseballWeCount Everything

Jose Reyes is one of just eight major leaguers with 2,000 hits, 300 doubles, 100 triples, 100 home runs and 500 steals.

Reyes turned out to be a stronger candidate than The Roundtable expected. He should be back for another run at the Hall in 2025.

________________________________

Alex Rodriguez – SS/3B, 1994-2013, 2015-16 (Mariners, Rangers, Yankees … Third year   on the ballot, 35.7 percent last year.

Alex Rodriguez played 2,784 games over 22 MLB seasons.  He hit .295, with 3,115 hits (23rd all-time); 2,021 runs scored (eighth); 696 home runs (fifth) and 2,086 RBI (fourth).  He is also among MLB’s top 50 in total bases (seventh); doubles (33rd); walks (37th); and extra-base hits (seventh).

Rodriguez was a three-time league MVP, 14-time All Star and two-time Gold Glover.  He led his league in home runs five times and hit 30 or more long balls 14 times (with a high of 57 in 2002). He led his league in runs scored five times (with 100 or more in 13 seasons); led the league in RBI twice, (with 100 or more in 14 seasons and a high of 156 in 2007).  He also led the league in hits once; doubles once; average once (.358 in 1996); and total bases four times.

Alex Rodriguez’ Best Season:  So many to choose from here. Let’s go with his 2007 MVP season (Yankees), when he hit .314; led MLB in runs scored (143), home runs (54) and RBI (156); and led the AL in slugging percentage (.645) and total bases (376).

A-Rod’s numbers belong in the Hall, but I think his 2014 full-year PED-related suspension will keep him on the outside looking in for now.  To this point Rodriguez does not seem to be gaining much ground.  Last season his vote total only moved from 34.3% to 35.7%, which indicates the voters are still not very forgiving.   When (or if) the PED dam finally cracks (most likely first through Era Committee voting), Rodriguez should find his way into the Hall.  Right now, he has seven years for the voters to change their minds.

____________________________________

Jimmy Rollins – SS, 2000-2016 (Phillies, Dodgers, White Sox) … Third Year on the Ballot, 12.9 percent one year ago.

Jimmy Rollins was a three-time All Star, four-time Gold Glover and the 2007 NL MVP.  Over a 17-season MLB career, he hit .264-231-936, with 2,455 hits, 470 steals (46th all-time) and 1,421 runs scored (88th). He led the league in triples four times (topping double-digits in five seasons) and stolen bases once (reaching 30 or more in ten seasons). He also led the NL in runs scored once, and scored 100 or more runs in six campaigns. He ranks 46th all-time in putouts at shortstop, 20th in assists and 12th in double plays. He was truly an “everyday” player, appearing in 150 or more games in ten seasons.

20-20-20-20 Vision

Jimmy Rollins is one of just four MLB players with a 20-20-20-20 season (at least 20 doubles, 20 triples, 20 home runs and 20 steals). See his 2007 “best season” below for details. The others are Curtis Granderson (2007), Willie Mays (1957) and Frank Schulte (1911). 

Jimmy Rollins’ Best Season:  In his 2007 MVP season, he hit .296 – with 212 hits, 38 doubles, a league-leading 20 triples, 30 home runs, 94 RBI, a league-leading 139 runs scored and 41 steals.

Rollins’ .264 average and the fact that he made only three All Star squads are negatives for the long haul in balloting.  That 20-20-20-20 season, his four Gold Gloves, 470 steals and 1,400+ runs scored should be enough to keep him on the ballot for some time going forward.

____________________________________

Gary Sheffield … OF/DH/3B/SS, 1988-2009 (Brewers, Padres, Marlins, Dodgers, Braves, Yankees, Tigers, Mets) … Tenth (and final) year on the Ballot, 55.0 percent last year.

Sheffield was a nine-time All Star (in 22 MLB seasons). He launched 509 career home runs (27th all-time) and topped 30 home runs in a season eight times (a high of 43 in 2000). He also maintained a .292 career average (hit .300+ in eight seasons), collected 1,676 RBI (30th all-time) and scored 1,636 runs (39th).  Sheffield won the 1992 NL batting title (.330); topped 100 RBI eight times; and scored 100 or more runs in a season seven times.

Something Old – Something New

Gary Sheffield is one of only four players to hit MLB home runs as teenagers and in their 40’s. The others are Ty Cobb, Rusty Staub and Alex Rodriguez.

Gary Sheffield’s Best Season: In 1996 (Marlins), Sheffield hit .314, with 42 home runs, 120 RBI, 188 runs scored and 16 steals.

Sheffield has the offensive numbers, but defensive questions and the shadow of PEDs are likely to keep him on the outside looking in for now.  He did jump from 40.6 percent of two years ago to 55.0 percent last year – but it would take an even greater increase this time around. Baseball Roundtable expects he will have to wait for the ERA Committees.

__________________________________

James Shields, RHP, 2006-2018 (Rays, Royals, Padres, White Sox) … First Year on the Ballot.

James Shields went 145-139, 4.01 over 13 MLB seasons. He was a one-time All Star and led is league in starts three times, complete games once, shutouts twice, innings pitched once, Shields had nine seasons of ten or more wins (a high of 16 in 2011 for the Rays). He also had three seasons of 200+ strikeouts.

James Shields’ Best Season:  In 2011, Shields went 16-12., 2.82 for the Rays, with an MLB-leading 11 complete games (33 starts) and an AL-topping four shutouts.  That season, he set his career bests in wins, ERA, complete games, shutouts, and strikeouts (225 in 249 1/3 innings).

145 wins (and 139 losses), with career ERA of 4.01 is not going to get you into the Hall, but nine straight season s in the major leagues with at least 11 wins is a solid career to look back on.

_______________________________

Chase Utley, 2B, 2003-18 (Phillies, Dodgers) … First Year on the Ballot.

Chase Utley went .275-259-1,025, with 1,103 runs scored over 16 MLB seasons (1,937 games). He collected 1,885 hits and stole 154 bases.

A Four-midable Middle Infielder

From 2006-2009, Chase Utley won the Silver Slugger Award as the NL’s best-hitting second basemen every year. Over that four-season span, he hits .303 and averaged 162 games, 30 homers, 115 runs scored and `100 RBI per season.

Utley was a six-time All Star and lead the NL in runs once and hit by pitch three times. He scored 100+ runs in four seasons, hit 30+ home runs in here, drove in 100+ runs four times and stole 15 or more bases in three times.

King of the World

Chase Utley shares the single World Series home run record with five (in the 2009 World Series).  Others holding a share of the record are Reggie Jackson (1977) and George Springer (2017). 

Utley started out on a Hall of Fame pace, with a .293 average, 177 home runs and 650 RBI over hit first eight MLB seasons.  Over his final eight seasons those numbers read .253-83-375. Hard to read where the voters will stand on this one.

________________________________

Omar Vizquel – (Shortstop/Third Base, 1989-2012 (Mariners, Indians, Giants, Rangers, White Sox, Blue Jays … Seventh year on the Ballot, 19.5 percent last year.

Omar Vizquel got off to a good start toward a HOF plaque, grabbing 37 percent support on his first-ballot year, moving up to 42.8 percent in his second year and 52.6 in his third shot.  However, the three most recent ballots have dampened his outlook (he received just 19.5 percent in last year’s voting), perhaps related to off-field concerns.  Vizquel who won 11 Gold Gloves, also finished his 24-season MLB career just 123 hits short of that milestone 3,000 safeties.

Vizquel was a three-time All Star – and put together a string of nine straight Gold Gloves at shortstop (1993-2001).

Sacrificing for the Team

Omar Vizquel led his league in sacrifice bunts four times.

In the field, Vizquel has the highest career fielding percentage (.9847) among shortstops with at least 500 games at the position.  Vizquel is also the all-time leader among shortstops in double plays (1,734), ranks third at the position for career assists and 11th in putouts. He shares the record (with Cal Ripken, Jr.) for the fewest errors by a shortstop in a season of at least 150 games played (three).

On offense, Vizquel put up a serviceable .272 career average, with 80 home runs, 951 RBI and 1,445 runs scored. He also swiped 404 bases – topping twenty steals eight times (a high of 42 in 1999).

Omar Vizquel’s Best Season: In 1999, with the Indians, Vizquel hit a surprising .333, with five home runs, 66 RBI, 112 runs scored and 42 stolen bases – and, of course, won a Gold Glove at shortstop.

As noted, Vizquel’s chances for the Hall have been dampened by off-field issues.  (I’ll let readers look those up.)

________________

David Wright – 3B, 2004-16, 2018 (Mets) … First Year on the Ballot.

In 14 MLB seasons, David Wright hit a heathy .296, with 242 home runs, 970 RBI and 949 runs scored. He was a seven-time All Star and two-time Gold Glover. A fixture for the Mets, Wright hit 25+ home runs in five seasons (a high of 33 in 2008) and drove in 100+ runs in five campaigns. He combined speed with that power, stealing a total of 196 bases and swiping  20 or more bags in three seasons (a high of 34 in 2007.

30-30

 In 2007, David Wright hit .325, with 30 home runs and 34 steals.

In the field, Wright led NL third baseman in putouts three times, assists three times and double plays once.

Those seven All Star Selections will earn Wright some votes, but I think voters will expect more power from an HOF third baseman and the fact that he never led his league in any of the main offensive categories will impact voters. Notably, Wright’s number would likely have been even stronger if he had not had to deal with Spinal Stenosis during his career. I do think he’ll be on the 2025 ballot.

______________________________

Here’s another link to the 2024 Baseball Roundtable Fan Ballot ballot. To cast your vote, click here. 

Primary Resources: National Baseball Hall of Fame; Baseball-Reference.com; Baseball-Almanac.com; MLB.com.


Baseball Roundtable – Blogging Baseball Since 2012.

100Baseball Roundtable is on the Feedspot list of the Top 100 Baseball Blogs.  To see the full list, click here.

Baseball Roundtable is also on the Anytime Baseball Supply Top 66 Baseball Sites list.  For the full list, click here

I tweet (on X) baseball @DavidBaseballRT

Follow/Like Baseball Roundtable’s Facebook Page here.  Find More baseball commentary; blog post notifications; PRIZES.

Member: Society for American Baseball Research (SABR); Negro Leagues Baseball Museum; The Baseball Reliquary.

P1012


Baseball Roundtable Ranks The Top Post-Season Pitching Performances

As I take in the  2023 MLB post-season – live at an energized Target Field (kind of sad that’s over) and on TV in my man cave – I  have found time to reflect on some past post-season pitching performances (especially since there are no games for a couple of days).

I was transported back to three World Series I was privileged to attend (at least one game);

  • 1957 – I was ten-years-old and my home town Milwaukee Braves beat the Yankees four games-to-three behind the right arm of  Lew Burdette, who earned three complete-game victories against the vaunted Yankees. His performance included two shutouts and, at one point, he threw 24 straight scoreless inning against a highly favored New York squad.
  • 1965 – My then (and still) hometown Twins lost to the Dodgers four games-to-three, with Sandy Koufax pitching a complete-game,  three-hit shutout in Game Seven (on just two day rest). In that one, the winning pitcher in each game went the distance.
  • 1991  – When I was lucky enough to be in the ballpark to witness Jack Morris‘ ten-inning shutout in the winner-take-all Game Seven.

Anyway, those thoughts led me to embark on a post ranking the top single-game, post-season pitching performances.  My old-school bias is probably reflected by the fact that I chose to rank the top five for the World Series, top four for the League Championship Series, top three for the Division Series and top two for the Wild Card Game/Series. I looked at such factors as how dominant the performance was and the strength of the opposition – also giving weight to the final score (a 1-0 win getting the edge over, say, a 6-0 win) and the impact on the series (a winner-take-all final game earning extra credit). I also, admittedly, leaned toward complete-game victories.

As I’ve noted before, when I start research “one thing always seems to lead to another.”  This time, I noticed most (not all) of the truly heroic pitching performances seem to have happened at least a couple of decades ago.  This distracted me briefly into a look at post-season (specifically World Series) pitcher usage.  I saw that:

  • In the 1905 World Series, just six pitchers were used and there was only one relief appearance.
  • In 1957 (that first World Series I attended), 17 pitchers were used and there were 21 relief appearances.
  • In the most recent World Series (2022), 24 pitchers were used and there were 46 relief appearances.

Clearly, the chance for a truly remarkable single-game, post-season pitching performance has waned as pitching changes have risen.

The ratings are coming right up, but to honor my distractions, I’ll present a couple of charts on World Series pitcher usage.

Now on to the ratings.

Baseball Roundtable Top Five World Series Pitching Performances

A “PERFECT” CHOICE FOR NUMBER ONE

Larsen


ONE – WITH A BULLET – Don Larsen, Yankees, Game 5, 1956 World Series … October 8, 1956

A no-brainer here.  How could you not put the only World Series perfect game at the top of this list?

When Don Larsen took the mound to start Game Five of the 1956 World Series for the Yankees (against the rival Brooklyn Dodgers at Yankee stadium) expectations may not have been very high.  Larsen (11-5, 3.26 on the season) was coming off a Game Two start (in Brooklyn, three days earlier) when he lasted just 1 2/3 innings and gave up four runs (none earned) on one hit and four walks.

Larsen, however, was in complete control in Game Five – fanning seven in a 97-pitch, perfect game – a 2-0 Yankee win. In the game, Larsen went to a three-ball count on only one batter, started 14 hitters off 0-1 and – if you count the four batters who hit the first pitch for an out –  threw a first-pitch strike to 18 of 27 hitters.  The lineup Larsen held hitless, by the way, included five  Hall of Famers: SS Pee Wee Reese; CF Duke Snider; 2B Jackie Robinson; 1B Gil Hodges; and C Roy Campanella.

Bookends

Don Larsen opened his World Series Perfect Game with a five-pitch strikeout (looking) of Dodgers’ 2B Jim Gilliam and closed it out with a five-pitch strike out (looking) of pinch-hitter Dale Mitchell.

Larsen seems an unlikely hurler to head this list. His career record (1953-65, 1967 … Browns, Orioles, Yankees, Athletics, Giants, Astros, Cubs) was 81-91, 3.78. He had just six MLB seasons – out of 14 – in which he won more games than he lost.  Four of those came during his five seasons as a Yankee, when he went 45-24, 3.50.  Larsen was 4-2, 2.75 in ten World Series appearances.

Don Larsen was a good-hitting pitcher. In 596 career regular-season at bats, he hit .242-15-72.  

FewestHitsWS

___________________________________________________

TWO – Bob Gibson, Cardinals … Game One, 1968 World Series … October 2, 1961

Gibson1968 was the Year of the Pitcher and, in the National League, Bob Gibson was the Pitcher of the Year.  Gibson went 22-9 that season, with a microscopic, MLB-best 1.12 earned run average. In addition, 13 of his wins were complete-game shutouts (another 1968 MLB-best).  He also led the NL in strikeouts with 268 in 304 2/3 innings pitched.  Gibson’s 1968 earned run average of 1.12 was the third-lowest, post-1900, qualifying MLB ERA – and his 13 complete-game shutouts are the second-most in a single season since 1900.

It’s no surprise that the Redbirds selected Gibson to start Game One (against the Tigers’ 31-game winner Denny McLain) – and Gibson did not disappoint. He threw a five-hit shutout, walking just one and fanning a World Series-record 17 batters. Gibson fanned everyone in the Tigers’ starting lineup at least once, struck out at least one batter in every inning and fanned three batters in two frames. Only two runners got past first base over the nine frames. Gibson finished  the game with a flourish, fanning the Tigers’ 3-4-5 hitters (Al Kaline, Norm Cash and Willie Horton) in order in the ninth inning. Despite Gibson’s heroics, the Cardinals lost the Series four games-to-three behind three complete-game wins from Mickey Lolich. Gibson also started and completed three games, going 2-1, 1.67. He took the loss in Game Seven giving up four runs on eight hits and one walk, while Lolich gave up just one tally on five hits and three walks.

They Call Him the Streak

Over June, July and August of 1968, Bob Gibson started 18 games, completed 17, won 16 (one loss/one no-decision), threw 11 shutouts, and put up a 0.77 ERA.

Hall of Famer Gibson pitched in 17 MLB seasons (all for the Cardinals). He won two Cy Young awards and, in 1968, won both the NL Cy Young and MVP Awards. Gibson was a five-time 20-game winner, leading the NL in wins once, ERA once, complete games once, strikeouts once and shutouts four times. His career mound record was 251-174, 2.91, with 3,117 strikeouts in 3,884 1/3 innings. He also won nine Gold Gloves and hit .206 with 24 career homers.  In nine World Series starts, Gibson won seven and lost two, pitching eight complete games, posting a 1.89 earned run average and fanning 92 batters in 81 innings.

Ks InSeriesGame

THREE – Christy Mathewson, Giants … Game 5, 1905 World Series … October 14, 1905

Photo by trialsanderrors

Photo by trialsanderrors

Christy Mathewson threw a nifty six-hit shutout (no walks, four strikeouts) in beating the Philadelphia Athletics 2-0 in Game Five of the 1905 World Series – giving the Giants the Series four games-to-one.  It was not just future Hall of Famer Mathewson’s excellence in this game that earned him spot number-two on this ranking  or even the fact that it was the clinching game (although that did factor in to my selection). It’s that this was Mathewson’s’ third-consecutive, complete-game shutout in the 1905 series – and he threw those three whitewashings over a period of just six days.  On October 9, Mathewson shutout the Athletics 3-0, giving up just four hits.  Then, on October 12, he threw another four-hitter, this time shutting down the Athletics 9-0. Then in Game Seven, it was the five-hit. 2-0 win.  For the Series, Mathewson gave up just 13 hits (and, of course no runs) and one walk in 27 innings, fanning 18.

Trivia Tidbits from the 1905 World Series

  • The Giants’ four wins all came via the shutout – three by Christy Mathewson and one by Joe McGinnity.
  • The Athletics’ only win also came via the shutout – a four-hitter tossed by Chief Bender in a 3-0, Game Two victory. 
  • The Giants gave up just three runs in the Series – all unearned, giving them an unbeatable single-World Series’ record 0.00 earned run average.
  • The Giants used only three pitchers in the entire series – Christy Mathewson (27 innings pitched); Joe McGinnity (17 innings pitched); and Red Ames one inning pitched. Yep, and entire World Series and only one “call to the pen.”

Mathewson was coming off a 31-9, 1.28 1905 season in which he led MLB in wins, ERA and shutouts (tied with eight), and led the NL in strikeouts (206). In his career, he led his league in ERA five times, strikeouts five times, wins four times and shutouts four times. He finished with a 373-188, 2.13 record.

mi;ti[l;eShutots_____________________________________________________________

FOUR – Jack Morris, Game Seven, 1991 World Series … October 27, 1991

MorrisThere have only been three extra-inning World Series complete-game shutouts, ten Game Seven complete-game shutouts and 18 World Series complete-game wins ending in a 1-0 score.  And, there has been only one game that met all three criteriaJack Morris’ performance in the finale of the 1991 World Series – a ten-inning, seven-hit, two-walk, eight-whiff gem that gave the Twins a 1-0 Game Seven win over the Atlanta Braves.

In the game, Morris reached ball three on only six of the 38 batters he faced.  This performance earned extra credit for Morris, since it came at a time when complete games were at a premium.  As was widely reported, Twins’ Manager Tom Kelly was ready to pull Morris after nine innings and 118 pitches – but Morris was having none of it (and voiced his objection in no uncertain terms).   And, the rest, as they say, is history.

Hall of Farmer Morris pitched in 18 MLB seasons, going 254-186, 3.90. He was a five-time All Star and led his league in wins twice (winning twenty or more games in three seasons) and in complete games, shutouts and strikeouts once each. (He also led the league in wild pitches six times.) Morris was 4-2, 2.96 in seven World Series starts and was MVP of the 1991 World Series.

10nningWS

_____________________________________________

FIVE – Babe Ruth, Red Sox … Game 2 …. October 9, 1916

Photo: Frances P. Burke, Public domain, via Wikimedia Commons

Hard to pass on a chance to include Babe Ruth.  On October 9, 1916, as his Red Sox faced the Brooklyn Robins (Dodgers), Ruth twirled a gem – notching the longest outing in a World Series game.

Ruth pitched  a 14-inning, complete-game, six-hitter as the Red Sox prevailed 2-1. The only run off Ruth came  in the first inning (an inside-the-park home run by Robins’ CF and number-three hitter Hi Myers). Ruth tossed 145 pitches that day, 91 for strikes.  From the ninth through the 14th innings, Ruth allowed only two base runners (no hits, one  walk, one safe on an error.)  During the 1916 season, Ruth had gone 23-12, leading the Al with a 1.75 earned run average and nine shutouts.  His final career pitching line was 94-46, 2.28.  From 1916 through 1918 (Red Sox), Ruth was 60-32, 1.95 on the mound, with 76 complete games (97 starts) and 16 shutouts. In World Series play, he was 3-0, 0.87 in three starts – giving up just two runs in 31 innings.

_____________________________________

H0norble Mentions:

Moe Drabowsky, Orioles, 1966 … In 1966, Moe Drabowsky was a key member of the Orioles’ bullpen. He appeared in 45 games (just one start)  and went 6-0, 2.81, with six saves.  In his relief appearances, he never went more than 4 2/3 innings and averaged two innings per outing. In Game One of the 1966 World Series (October 5 – Orioles versus Dodgers), Drabowsky was called on to relieve starter Dave McNally with one out and the bases l0aded in the bottom of the third. (The Orioles were up 4-1 at the time.) Drabowsky got out of the jam allowing just one run and then went on to finish the game – going  6 2/3 innings, giving up just one hit and two walks and fanning 11.  In the process, he set the World Series’ single-game record for strikeouts by a relief pitcher.   (The Orioles, by the way, went on to sweep the Series four games-to-zero.)

Ed Walsh, White Sox, 1906 … Lots of reason to like this one; particularly (for The Roundtable) the fact that it was part of the White Sox/Cubs crosstown rivalry. In Game Three of the 1906 World Series, Ed Walsh started for the visiting White Sox. He tossed a nifty two-hit shutout, walking one and fanning 12, as the White Sox prevailed 3-0.   Baseball Roundtable sees a reason for extra credit, since since Walsh notched those 12 whiffs and fanned at least one batter in every inning at a time when the MLB regular-season average for strikeouts per nine inning was just 3.8.  Only two Cubs got past first base in the game, Walsh did not give up a hit after the first inning and, at one point, he retired 13 straight Cubs. It was very tough to keep this one out of the top five.

_____________________________________________

Baseball Roundtable’s Top Four League Championship Series Pitching Performances

ONE – Dave McNally, Orioles …. ALCS, October 5, 1969

Dave McNally started for the Orioles (versus the Twins) in Game Two of the 1969 AL Championship Series. He was masterful – and he had to be. McNally was facing a tough Twins  lineup that featured future Hall of Famers Rod Carew (2B), Tony Oliva (RF) and Harmon Killebrew (3B). McNally was up to the task, tossing an 11-inning, complete-game, three-hit, shutout (five walks and 11 strikeouts) to  earn a tight 1-0 win.

McNally allowed only two runners to get beyond first base during the game. His mound opponent, Dave Boswell took a seven-hit shutout into the bottom of the eleventh  frame. In that final inning, he gave up a walk to 1B Boog Powell, who was sacrificed to second by 3B Brooks Robinson. Then, 2B Davey Johnson was intentionally walked, putting runners on first and second with one out. Boswell got SS Mark Belanger on a foul pop up and then was lifted – with the Twins bringing in closer Ron Perranoski to face pinch hitter Curt Motton.  Motton singled home Powell to end one of the League Championship Series’ tightest-ever pitching duels.

Dave McNally’s 11-inning shutout in Game Two of the 1969 ALCS is MLB’s longest post-season, complete-game shutout.

McNally pitched in 14 MLB seasons (1962-75 … all but his final season for the Orioles). He went 184-119, 3.24, was a four-time All Star and three-time 20-game winner (a career-high and league-leading 24 wins in 1970). In 14 post-season appearances (12 starts), he was 7-4, 2.49 with six complete games.

__________________

TWO … Roger Clemens, Yankees … ALCS , October 14, 2000

Photo: Keith Allison on Flickr, CC BY-SA 2.0 <https://creativecommons.org/licenses/by-sa/2.0>, via Wikimedia Commons

Roger Clemens took the mound against the Mariners (In Seattle)  in Game Four of the 2000 ALCS and went right to work – striking out the first two batters he faced (RF Stan Javier and LF Al Martin). It set the tone for the day, as Clemens went the distance in a 5-0 win, giving up just one hit (a seventh inning double to Martin) and two walks, while fanning 15 batters (11 swinging/four looking).  Clemens, who fanned at least one hitter every inning, seemed to get stronger as the game went on – fanning nine over the final four innings. Overall, he threw 138 pitches, 87 strikes. Clemens retired the Mariners in order in seven of the nine innings and, at one point, retired 16 straight.

Roger Clemens’ October 14, 2000 ALCS shutout was his only complete game in 34 post-season starts.

Clemens pitched 24 MLB seasons (1984-2007 … Red Sox, Blue Jays, Yankees, Astros).  He went 354-184, 3.12, with 4,672 strikeouts in 4,196 2/3 innings. He was a 11-time All Star, seven-time Cy Young Award winner and led his league in wins four times; ERA seven times; CG three times; IP twice; and strikeouts five times. He was 12-8, 3.75 in 35 post season appearances (34 starts).

____________________________

THREE – Livan Hernandez, Marlins … NLCS, October 12, 1997

In Game Five of the 1997 NLCS,  with the series tied two-games apiece, Marlins’ 22-year-old rookie righty Livan Hernandez (who had gone 9-3, 3.18 in seven starts during the season) was matched up against future Hall of Famer Greg Maddux.  Hernandez came away with a sparkling  2-1 win in front of the home crowd. Hernandez pitched a complete game three-hitter, walking two and fanning 15 ( tied for third-highest total ever in a post-season game and tied for  the highest in a League Championship Series contest). The only run off Hernandez came on a second inning homer by Braves’ RF Michael Tucker.

It didn’t start well for Hernandez. Braves’ CF Kenny Lofton hit his second pitch of the game for a triple to lead off the top of the first and Hernandez then walked 2B Keith Lockhart on five pitches. Sixteen pitches later, he had fanned Braves 3-4-5 hitters  – 3B Chipper Jones, 1B Fred McGriff, LF Ryan Klesko – and escaped unscathed.  Over the course of the game, Hernandez fanned at least one batter every inning and two batters in the sixth, seventh, eighth and ninth. Overall, he threw 148 pitches (88 strikes).  After the second inning, no Brave reached second base and Hernandez retired 21 of 23 batters,  (The Marlins, by the  way, went on to win the NLCS four games-to-two.)

Hernandez played in 17 MLB seasons (1998-2012 … Marlins, Giants, Expos, Nationals, Diamondbacks, Twins, Rockies, Mets, Braves, Brewers). He went 178-177, 4.44 in 519 games (474 starts). He was a two-time All Star. He was 7-3, 3.97 in 12 post-season appearances (10 starts).

MVP! MVP!

In 1997, Livan Hernandez – who finished second in the NL Rookie of the Year balloting – was the MVP of the National League Championship Series and MVP of the World Series. His World Series MVP selection has  produced some debate (debate is such a great part of baseball). Hernandez was 2-0 in the Series, but had a 5.27 earned run average and walked ten batters in 13 2/3 innings.  (Side note:  There were 81 runs scored in the seven games).   Some argued the Marlins’ Moises Alou should have been MVP after hitting .321, with three homers, nine RBI and six runs scored in the high-scoring Series.

__________________

FOUR –  Mike Scott, Astros … October 8, 1986

Photo: Mother’s Cookies, Public domain, via Wikimedia Commons

Game One of the 1986 NLCS featured  Dwight Gooden of the Mets (17-6, 2.84 in the regular season) versus the Astros’ Mike Scott (18-10, 2.22) in a matchup of aces. The game lived up to its billing, as Scott and the Astros prevailed 1-0.  Scott pitched a gem, giving up five hits, walking just one and fanning 14 in his nine-inning shutout. He fanned the Mets 3-4-5 hitters (1B Keith Hernandez, C Gary Carter and RF Darryl Strawberry) eight times in 12 plate appearances.  Overall, Scott threw 125 itches (88 strikes). Gooden also pitched well.  The only run he allowed was on a home run by Astros’ 1B Glenn Davis leading off the second inning. Scott went to a three-ball count on only three batters and allowed just three runners to reach second base.

Scott was the MVP in the 1986 NLCS.  He went 2-0, 0.50 in two starts, pitching two complete games and giving up just one run on eight hits in 18 innings. In those 18 frames, he walked just one and fanned 19.

In 1986, Mike Scott led the NL in strikeouts with 306 (in 275 1/3 innings).

Mike Scott pitched in 13 MLB seasons (1979-91 … Mets, Astros), going 124-108, 3.54. He was a three-time All-Star and led the NL in wins with 20 (10 losses) in 1989.

_____________

Honorable Mentions:

  • Josh Beckett, Marlins, 2003 Game 5 … Two-hit shutout, with no walks and 11 whiffs as  Beckett’s Marlins topped the Cub 4-0.
  • Randy Johnson, Diamondbacks, 2001, Game 1 … Three-hit shutout with no walks and 11 whiffs as Arizona topped Atlanta 2-1
  • Mike Boddicker, Orioles, 1983, Game 2 … fFve hit, three-walk, 14-strikeout game in a 4-0 win over the White Sox .

_________________________________________

Baseball Roundtable’s Top  Three Division Series Pitching Performances

ONE –  Roy Halladay, Phillies … NLDS, October 6, 2010

Photo: SD Dirk on Flickr, CC BY 2.0 <https://creativecommons.org/licenses/by/2.0>, via Wikimedia Commons

In Game One of the 2010 NL Division Series (Reds at Phillies), Philadelphia’s Roy Halladay missed a  perfect game by one pitch – a seventh inning walk (on a 3-2 pitch) to Reds’ RF Jay Bruce.  Halladay fanned eight and only four balls were hit out of the infield.  In the 4-0, Phillies’ win, Halladay also had an RBI single (and later came around to score) in the bottom of the second.  It was more offense than he would need in the 4-0 win.

Let’s Get This Party Started

Roy Halladay’s no-hitter came in his first-ever post-season appearance.

In his no-hitter, Halladay threw 104 pitches (79 strikes) and went to a three-ball count on only three batters.

Hall of Famer Halladay pitched in 16 MLB seasons (1998-13 … Blue Jays, Phillies), going 203-105, 3.38. He was an eight-time All Star a two-time Cy Young Award winner and led his league in wins twice, complete games seven times and innings pitched four times.

__________________________

TWO … Kevin Brown, Padres … September 29, 1998

In Game One of the 1998 NL Division Series, Padres’ righty Kevin Brown set the tone for a series in which Padres’ pitchers would give up only eight runs in four games (five of those in Game Two). Playing in Houston, Brown threw eight scoreless frames against the Astros – giving up just two hits and two walks, while fanning 16 batters.

Number Two Ain’t Bad

Kevin Brown’s 16 strikeouts in Game One of the 1998 NLDS is the second-highest total ever in an MLB post-season contest.  He fanned at least one batter in each of his eight innings, two batters in four and three batters in two.

Brown’s stuff that day was not only unhittable, it was (apparently) at times uncatchable. In the third inning, he opened by fanning SS Ricky Gutierrez on a 3-2 pitch, before giving up an infield single to C Brad Ausmus. Next up was opposing hurler Randy Johnson.  Johnson’s at bat included not only a strikeout (looking on a 2-2 pitch), but a pair of passed balls that sent Ausmus to third. Brown topped off the inning, stranding Ausmus at third, by fanning 2B Craig Biggio on three pitches.

With the Padres up 2-0 in the top of the ninth, Brown was lifted for pinch hitter John Vander Wal (who struck out looking). Trevor Hoffman came in for the ninth inning save and gave up one run on two hits. In his outing, Brown threw 119 pitches (77 strikes).

Brown pitched in 19 MLB seasons (1986, 1988-2005 … Rangers, Orioles, Marlins, Padres, Dodgers). He was an All Star in six seasons and for four different teams (Rangers, Marlins, Padres, Dodgers). He led the AL with 21 wins in 1992 and led his league in earned run average in 1996 (Marlins – 1.89) and 2000 (Dodgers 2.58). He won 15 or more games in six seasons.

_________________________________________

THREE – Tim Lincecum, Giants,… October 7, 2010

Photo: BrokenSphere, CC BY 3.0 <https://creativecommons.org/licenses/by/3.0>, via Wikimedia Commons

Tim Lincecum started Game One of the 2010 NL Division Series for the Giants (at home) against Derek Lowe and the Braves and he set the tone for a three games-to-one Giants’ Series victory. He pitched a two-hitter, walking one and fanning 14, while besting five Braves’ hurlers in a 1-0 pitching duel.  All this after giving up a booming double to CF  the first batter he faced (Braves’ SS Omar Infante). He settled down quickly  and – after retiring RF Jayson Heyward on a flyball to left – struck out 1B Derrek Lee and C Brian McCann to get out of the inning. He then struck out the side in order on 14 pitches in the second frame. Lincecum put an exclamation point on his outing, fanning  Heyward and Lee for the final two outs of the contest.

Lincecum pitched in ten MLB seasons, nine for the Giants before finishing with the Angels. He was a four-time All Star  and two-time Cy Young Award winner (2008-09). He finished with a 110-89, 3.74 career record.  From 2008 through 2010, he was 49-22, 2.83 and average 252 strikeouts per season. He was 5-2, 2.40 in 13 post-season appearances (six starts).

________________________________________

Honorable Mention:

Gerrit Cole, Astros, 2019 Game 2 …  In Game Two of the 2019 AL Division Series, Gerrit Cole of the Astros  was matched up against Blake Snell of the Rays (in Houston).  Cole was dealing that day, He went  7 2/3 innings, giving up just four hits and one walk (no runs), while fanning 15. In the second inning of that contest, Cole fanned  the side on just ten pitches. He also had a three-strikeout inning in the fifth – this time on 12 pitches (there was a single thrown in).  Cole’s strikeouts went like this:

First inning – two;

Second Inning – three;

Third Inning – one;

Fourth Inning – one;

Fifth Inning – three;

Sixth inning – zero;

Seventh inning – two;

Eighth inning – two.

Cole, still active, has pitched in 11 MLB seasons (2013-23 … Pirates, Astros, Yankees). He is a six-time All Star and led the AL in wins once, earned run average twice and strikeouts twice (a high of 326 in 2019). He is 10-6. 2.93. with 134 strikeouts in 104 1/3 post-season innings (17 starts).

_________________________________

Baseball Roundtable’s Top Two  Wild Card Game/Series Pitching Performances


ONE – Clayton Kershaw, Dodgers … October 1, 2020

Photo: Arturo Pardavila III on Flickr, CC BY 2.0 <https://creativecommons.org/licenses/by/2.0>, via Wikimedia Commons

In Game Two of the 2020 Wild Card Series, the Dodgers’ Clayton Kershaw shutdown the Brewers in a 3-0 win in Los Angeles.  Kershaw went eight innings, and gave up just three hits and one walk, while fanning 13.  In his eight innings, only two Brewers reached second base.  In the top of the sixth, Kershaw fanned  the Brewers 1-2-3 hitters (CF Avisail  Garcia, LF Christian Yelich, 1B Jedd Gyorko) on 12 pitches. Dodgers closer Brusdar Graterol came on to pitch a scoreless ninth for the save.

Kershaw, still active, has pitched in 16 MLB seasons (2008-2023), all for the Dodgers.  He is a ten-time All Star, three-time Cy Young Award winner.  He has led the NL in wins three times, ERA five times, complete games twice, shutouts three times and strikeouts three times.

In 2014, Clayton Kershaw went 21-3, 1.77 and won both the NL Cy Yong and Most Valuable Player Awards.

____________________________________________

TWO – Madison Bumgarner. Giants … October 1, 2014

Photo: SD Dirk on Flickr, CC BY 2.0 <https://creativecommons.org/licenses/by/2.0>, via Wikimedia Commons

In this 2014 Wild Card Game, Madison Bumgarner of the Giants tossed a complete-game shutout – giving up just four hits and one walk, while fanning ten. His Giants topped the Pirates 8-0 in Pittsburgh. He threw 109 pitches (79 strikes). Only three Pirates got past first base (one of those with the help of two Giants’ errors).

Bumgarner (active in 2023) has pitched in 15 MLB seasons (2009-2023).  The four-time All Star has a career 134-124, 3.47 record and has won 15 or more games in four seasons (all before 2017). He has been a post-season star, gaining 8-2, 2.11 in 16 appearances (14 starts) – and, even more impressive – 4-0, 0.25 in five World Series appearances (four starts).

Madison Bumgarner was the MVP of the 2014 NLCS and the 2014 World Series.


Primary Resources:  Baseball-Reference.com; “The World Series,,” Richard Cohen, David Neft, Roland Johnson, Jordan Deutsch,  Dial Press, New York (1976)


Baseball Roundtable – Blogging Baseball Since 2012.

100Baseball Roundtable is on the Feedspot list of the Top 100 Baseball Blogs.  To see the full list, click here.

Baseball Roundtable is also on the Anytime Baseball Supply Top 66 Baseball Sites list.  For the full list, click here

I tweet (on X) baseball @DavidBaseballRT

Follow/Like Baseball Roundtable’s Facebook Page here.  Find More baseball commentary; blog post notifications; PRIZES.

Member: Society for American Baseball Research (SABR); Negro Leagues Baseball Museum; The Baseball Reliquary.

P1006

Baseball Roundtable September 2023 Wrap UP … Records Were Made to be Broken

It’s October 1, and that means it’s time for the Baseball Roundtable monthly Wrap Up for September – a look at the stories and statistics that caught The Roundtable’s attention over the past month, as well as the standings, Roundtable Players and Pitchers of the Month, the Trot Index and more. Keep in mind, the stats presented are for September only and do not include games of October 1.

As usual, there a few things unusual over the past thirty days:

  • The first rookie with a 25-50 season and the first-ever 40-70 campaign (HR/SB);
  • A 200th career win and a 400th career home run;
  • New records set for home runs and RBI out of the leadoff spot;
  • A rookie getting on base via hit or walk in each of his first 29 games (streak still active);
  • A team holding their opponents hitless for 10+ innings and still losing the contest;
  • A player (an infielder no less) connecting for a home run in four consecutive innings ; and
  • More.

Read on for these highlights – and the more. As usual, we’ll start with Baseball Roundtable’s Players and Pitchers of the Month.

BASEBALL ROUNDTABLE PLAYERS AND PITCHERS OF THE MONTH

September 2023

NATIONAL LEAGUE

Player of the Month … Xander Bogaerts, SS, Padres

Photo: Casey Aguinaldo, CC BY-SA 4.0 <https://creativecommons.org/licenses/by-sa/4.0>, via Wikimedia Commons

Padres’ SS Xander Bogaerts delivered that “shiny thing” that gets Baseball Roundtable’s attention – a .400+ average. Bogaerts hit .416 in September, leading all MLBers with at least 50 at bats.  His 42 base hits also led MLB and he delivered ten doubles (also leading MLB), two triples, four home runs, 13 RBI and 25 runs scored (third in MLB). In addition, he swiped six bases in six attempts. Bogaerts collected hits in all but three of his 24 September games and had 12 multi-hit games. From September 15-20, he had six consecutive multi-hit games, going 14-for-27 (.519).  Bogaerts finished September with a .285-19-58 line on the season (19 steals). (Side note: Marlins’ SS Jon Berti hit .417 in September, but his 48 at bats fell just short of The Roundtable’s 50 at bat cutoff.)

Honorable Mentions:  Lot of deserving players here. Another Padre, LF Juan Soto hit .340 and led MLB with 29 September RBI (26 games). His ten home runs were third in MLB and his 26 runs scored were second. In addition, he swiped six bags. He gets extra credit for walking more times (18) than he fanned (15). Soto had five three-hit games in September.

_____

Juan Soto had a 36-plate appearance streak – from September 13 to his fifth at bat September 23 – when he did not strikeout.

_____

The Braves’ Ronald Acuna Jr. averaged .343 for the month, scored 29 runs (leading MLB) and delivered 23 RBI.  His 11 September homers tied teammate Matt Olson for the MLB high. He also stole 11 bags in 14 tries.   A shout out also goes to to Reds’ CF TJ Freidl, who had a .333-7-18 month, and had three September triples as well.

______________________________________

Pitcher of the Month: Blake Snell, LHP, Padres

An easy choice. Blake Snell was masterful in September, putting up an MLB-best (among pitchers with at least 20 innings pitched during the month) 0.58 earned run average in 31 innings (and topping the NL in strikeouts with 41). That earned him a 3-0 record in five starts. Snell gave up just 13 hits in his 31 innings (a .123 opponents’ batting average), although he did walk 14.  He gave up a run (two actually) in just one of his five September starts. Snell closed out September at 14-9, 2.25 on the season.

Honorable Mentions:  Braves’ southpaw Max Fried went 3-0, 1.88 in four starts, fanning 27 batters in 24 innings; Marlins’ lefty closer Tanner Scott went 3-1, 1,65, with nine saves in 13 appearances and struck out 20 batters, with just one walk, over 16 1/3 innings.

_______________________________________________________

AMERICAN LEAGUE

Player of the Month – Tie: Jose Altuve, 2B, Astros & Marcus Semien, 2B, Rangers

Photo: Jeffrey Hayes, CC BY 2.0 <https://creativecommons.org/licenses/by/2.0>, via Wikimedia Commons

Jose Altuve’s 32 September hits were just one off the American League lead – as  he put up a .308-7-17 stat line, with 18 runs scored, in 25 September games. Altuve had ten multi-hit games in September. As September came to a close, Altuve was .312-17-51, with 14 steals in 89 games this season.

On September 5, Altuve went three-for-five, with three home runs (out of the leadoff spot), as his Astros topped Texas 14-1.

Rangers’ 2B Marcus Semien was an offensive force with  .292 average with a league-topping (tied) nine homers, 19 RBI and an AL-highest (tied) September 23 runs scored. Semien had a pair of two-homer games in September. He finished September at .278-29-100, with 14 steals on the season.

Honorable Mention:  Twins’ rookie infielder Royce Lewis went .313-6-23 in an injury-shortened month.


_______

Pitcher of the Month – Tarik Skubal, LHP, Tigers

Tarik Skubal went 4-0, 0.90 in five September starts (and, remember, he was pitching for the Tigers). His ERA was second only to Blake Snell among pitchers with at least 20 September innings. He also fanned 43 batters (second only to the Rays’ Tyler Glasnow‘s 48) and walked just four in 30 innings. His 0.60 WHIP was the lowest among pitchers with at least 20 September innings, and he held hitter to a .135 average. In his lone September no-decision, Skubal went four innings, giving up just two hits (no runs), while walking none and fanning eight.  He finished September at 7-3, 2.80 (with 15 starts this season).

Honorable Mentions:  Yankees’ RHP Gerrit Cole went 3-0, 1.03 in five September starts , including a two-hit, complete-game shutout (versus the Blue Jays) in his last start.

__________________

Surprise Player of the Month – Reese Olson, RHP, Tigers

A 24-year-old righty, Reese Olson made his MLB debut on June 2 – called up from Triple-A Toledo (where he was 2-3, 6.38 in ten starts). The 13th Round draft pick (out of North Hall High School in Gainesville, GA,) came into September with a 2-6, 5.10 record, but he turned on the after burners in the season’s final full month – going 3-1, 1.44 in five starts, including a six-inning one-run outing versus the powerful Dodgers.  In September, Olson putting up a 0.77 WHIP and held hitters to a .147 average.


________________________________________

THE TROT INDEX … A REGULAR BASEBALL ROUNDTABLE FEATURE

Through September,  35.7 percent of the MLB season’s 182,977 plate appearances ended in a trot (back to the dugout, around the bases, to first base). We’re talking about strikeouts, home runs, walks, hit by pitch and catcher’s interference – all outcomes that are, basically, devoid of action on the base paths or in the field. Here’s the breakout: strikeouts (22.7%); walks (8.6%); home runs (3.2%); HBP (1.1%); catcher’s interference (less than 1%). Strikeouts, by the way, outnumbered base hits 41,560 – 40,618.

The 35.7 percent figure is up from 2022’s full season 34.6 percent.  Other recent seasons: 2021 – 36.3 percent; 2020 –  37.3 percent;  2019 – 36.2 percent; and 2018 – 34.8 percent.  By further comparison, in 1990, the Trot Index was 26.1 percent.  

____________________________________

Observations:  There were only a handful  surprises in September.

First, the AL Central – that nobody seemed to want to win – suddenly came alive.  The Twins took charge with an 18-9 month and seemed to be hitting on all four-, six- or eight-cylinders (depending on what kind of car you have).  Offensively, they led MLB in runs scored for the month; were third in home runs (second in the AL); first in MLB in on-base percentage and walks drawn; third in total bases (first in the AL). On the mound, they were third in the AL in earned run average (seventh in MLB); second overall (and in the AL) in strikeouts; and gave up the fewest walks in the AL (second in MLB). They had MLB’s (and the AL’s) second-best September strikeouts-to-walks ratio and strikeouts per nine innings.  Key contributors were: 3B Royce Lewis (.313-6-23 in just 18 games); RF Max Kepler (.287-3-16); OF/3B Willi Castro (.312, with 18 runs scored) – and the list goes on.  In fact, seven Twins had 10+ September RBI and nine scored 10+ runs. On the hill, nine Twins’ pitchers put up ERA’s under 3.00 and seven held hitters to an under .200 average.  Don’t count them out in October.

The Tigers surprised a lot of people with their 17-10 month – led by some sterling young pitching: Tarik Skubal  (4-0, 0.90 in five starts) and Reese Olson (3-1, 1.44 in five starts) – and an offense driven in part by  24-year-old  1B Spencer Torkelson (.255-7-25 in September) and 40-year-old DH Miguel Cabrera (.324-1-10 during the month).  The Bengals also got a .297-5-11 month from C Jake Rogers and twenty runs scored from RF Matt Vierling.

The AL West was a surprise in that only the Rangers were above .500 for the month (15-13) – moving past the Mariners and Astros in a tight race.  The Orioles, notching their 100th win are no longer a surprise.

Over in the NL, the Padres had a solid 19-7 September, but their move was too late . Meanwhile the Braves, Brewers and Dodgers played well enough to hold off the competiti0n.

——Team  Statistical Leaders for September  2023 ———-

RUNS SCORED

National League –  Braves (160); Cubs (151); Dodgers (147); Padres (146)

American League – Twins (173); Orioles (143); Rangers (143)

The fewest runs in September were scored by the White Sox (82). In the National League, it was the Giants at 92.  Also under 100 runs were the Angels (94) and  A’s (99).

AVERAGE

National League – Braves (.275); Marlins (.271); Padres (.269)

American League – Astros (.265); Royals (.263); Guardians (.261)

The lowest team average for September belonged to the Angels at .220. The lowest in the NL was the Cardinals (.221). 

HOME RUNS

National League – Braves (52); Phillies (46); Reds (43)

American League –  Rangers (49); Twins (46); Astros (43)

The Guardians had the fewest home runs in September at 20.  The Diamondbacks were at the bottom of the NL at 21.

The Braves led MLB in slugging percentage for at .502.  The Astros led the AL at .475. 

STOLEN BASES

National League – Phillies (39); Reds (32); Padres (32)

American League – Guardians (38); Royals (31); A’s (25)

The White Sox stole the fewest sacks in Septembers  – six  in eleven  attempts.   The Giants were at the bottom of the NL, with 10  in 13  attempts. 

WALKS DRAWN

National League –   Cardinals (113); Brewers (109); Phillies (107)

American League  Twins (125); Rangers (124); Blue Jays (109)

The Twins  led MLB in on-base percentage for September at .355. The Reds led the NL  at .349.  The White Sox  had MLB’s lowest  OBP for September at .269.  The Nationals were at the bottom of the NL at .294. Six of the bottom seven in OBP were from the American League: White Sox; Angels; A’s; Red Sox; Mariners; Yankees.

BATTER’S STRIKEOUTS

National League – Phillies (281); Rockies (264); Pirates (264)

American League – Mariners (274); Yankees (273); Red Sox (272)

Astros’ batters fanned the fewest times in September (181). The Nationals fanned the fewest times in the NL at 195. While the Phillies led MLB in September whiffs, the next five teams were from the AL: Mariners; Yankees; Red Sox; A’s; Angels. 

 Bonus Stats:

  • Braves’ batters racked up the most total bases in July at 499.  The White Sox were at the bottom of MLB at 310. 
  • The Marlins were successful on all 20 of their September steal attempts. The only team with a 100% success rate.

_______________________________________

EARNED RUN AVERAGE

National League – Brewers (2.77); Padres (3.36); Mets (.347)

American League –  Tigers (3.00); Orioles (3.30); Twins (3.64)

The Rockies had the highest September ERA at 6.52.  Nine  teams were at 5.00+ including the Rockies and the Nationals (5.51); Reds (5.49); Braves (5.45); Rangers (5.31); Cardinals (5.23); Pirates (5.14); White Sox (5.08); Royals (5.00).

STRIKEOUTS

National League – Braves (266); Phillies (264); Dodgers (260)

American League –  Rays (304); Twins (279); Blue Jays (267)

The Rays averaged an MLB-best 11.15 strikeouts per nine innings in September. The Braves averaged an NL-best 9.54.  Fourteen teams averaged nine whiffs per nine or better. 

FEWEST WALKS SURRENDERED

National League  – Giants (56); Dodgers (71); Diamondbacks (82)

American League – Rays (66); Twins (66); Orioles (67)

The Giants walked an MLB-lowest 2.16 batters per nine innings in September.  The A’s walked an MLB-worst 4.73 batters per nine frames.

SAVES

National League – Pirates (10); Braves (10); Marlins (10)

American League – Yankees (11); Guardians (8); Tigers (8); Royals (8); Rays (8)

The Cubs blew the most saves in August  – recoding just six saves in 16 opportunities.

Bonus Stats:

  • The Braves gave up an MLB-high 47 home runs in September. (Interestingly, the Braves gave up an MLB-low 25 in August).   The Mets gave up an MLB-low 42 home runs in September.
  • The Brewers held opponents to an MLB-low .202 average in September – after holding opponents to an MLB-low .206 average in August. The Rockies’ staff was touched for an MLB-high .306 average in September.
  • The Rays strikeouts-to-walks ratio for September topped MLB at 4.61. The A’s had MLB’s worse ratio at 1.65.

—-SEPTEMBER 2023 HIGHLIGHTS —–


A First (homer) on the First (swing) of the First (at bat) . which happened to be on the  on the First (of the month)

Twenty-year-old switch-hitting Jasson Dominguez made his MLB debut on September 1, playing CF and batting fifth for the Yankees (playing in Houston). His first MLB at bat came against none other than three-time Cy Young Award winner Justin Verlander.  After letting a  first pitch curve go by for a strike, he took is first MLB swing at Verlander’s next offering – a 94 mph fastball – and smacked his first MLB home run.

Dominguez, by the way, was heralded as a five-tool player  ranked as the Yankees’ second-best prospect.  In his first eight games with the Yankees he hit .258, with four home runs and seven RBI. However, a scan on September 10 revealed an arm injury that required Tommy John surgery and he is now out for nine-to-ten months.

It Took Two Days, but it Was Worth It

Photo by Keith Allison

This highlight started in the ninth inning of the Astros’ September fifth 13-6 win over the Rangers in Texas.  Astros’ 2B Jose Altuve, who had already gone deep in the sixth inning, finished off the Astros’ scoring with a solo home run off Martin Perez in the top of the ninth.

Fast forward to the very next day – Astros at Rangers again. Altuve led off the first inning with a home run off Nathan Eovaldi. He homered again the second inning (a solo shot with one out) off Eovaldi. Then, he added a homer in the third inning, this time a two-run shot off Dane Dunning.  According to the Elias Sports Bureau, that made Altuve the first player in the “Expansion Era” (since 1961) to homer in four consecutive innings.  More “InBaseballWeCountEverything.”  Altuve also tied the MLB record with five homers in a two-game span.

A Nice Round Number

Photo: Keith Allison from Hanover, MD, USA, CC BY-SA 2.0 <https://creativecommons.org/licenses/by-sa/2.0>, via Wikimedia Commons

On September 5, as the Yankees topped the Tigers 5-1, in New York, Yankee DH Giancarlo Stanton broke up 1-1 tie with a two-run homer in the bottom of the sixth.  It was the 22nd long ball of the season for Stanton and the 400th of his  14-season MLB career. Stanton is a five-time All Star, the 2017 National League MVP (Marlins).  He has hit 30+ homers in seven seasons (a high of 59 in 2017), led the league in homers twice and drove in 100 or more runs in three campaigns.

Let’s Get This Party Started

Angels 1b/1B Nolan Schanuel was the 11th overall pick in the 2023 MLB Draft (after putting up a .386-46-176 stat line in three college seasons at Florida Atlantic). Forty days and 22 minor-league games later, he was in the big leagues – and he’s not slowing down a bit.  He made his debut August 18 and quickly ran off a ten-game hitting streak to start his MLB career. His first hitless game came on September 1, but he got on base via a walk in that contest,  In fact, as of September 29, he had appeared in 29 MLB gams and been on base via hit or walk in every one.  His 2023 stat line as of September 30 – 29 games,  .275-1-6, with 19 runs, 20 walks and 19 strikeouts.

Happy Birthday, Joey!

On Sunday, September 10, Reds 1B Joey Votto celebrated his fortieth birthday in style – leading off the eighth inning with a home run off the Cardinals’ Andrew Suarez (part of a 7-1 Reds Win in in St. Louis).  It was Votto’s 14th long ball of the season and the 356th homer of his 17-season MLB career. Votto is a six-time All Star and was the 2010 National League MVP.

A Tough Way To Lose

On September 10, three Brewers hurlers (Corbin Burnes, Devin Williams, Abner Uribe) held the Yankees not just scoreless – but hitless – over the first ten innings at Yankee Stadium. The Brewers, however, had managed just three hits and no runs.

The Brewers scored in the top of the eleventh – a single plating that “placed” runner. (Don’t even get me started on that.) The Yankees also plated their gift runner in the bottom of the inning.

Each team scored twice in the twelfth, before the Yankees finally won it 4-3 in the thirteenth – with five of the seven total runs scored being  ‘gifted” baserunners.” (Okay, that got me started.)

And a Happy Birthday to you, too, Freddie!

Dodgers’ 1B Freddie Freeman turned 34 on September 12th, but he didn’t show his age. In an 11-2 Dodgers win against the Padres (in LA), Freeman went four-for-five, with a homer, a double, four runs scored and two RBI. It was the fourth time Freeman has gone yard on his birthday – one shy of the MB record (more #InBaseballWeCountEverything).

It’s A Grand Old Game

On September 15, Twins’ 24-year-oold rookie infielder Royce Lewis laced a second-inning Grand Slam off of The White Sox’ Jesse Scholtens – breaking a 0-0 tie and starting the Twins toward a 10-2 victory in Chicago. And the Grand Slam was one of the record books.

  • It was Lewis fourth grand slam in 18 games – shortest span of games for four Grand Slams in MLB history;
  • It gave Lewis a share of the record for most Grand Slams by a rookie in a season;
  • It gave Lewis the Twins’ franchise record for Grand Slams in a season.

Here a list of Lewis 2023 Grand Slams:

August 27, sixth inning  – off the Rangers’ Chris Stratton;

August 28, second inning – off the Guardians’ Xzavion Curry (gotta be the only MLBer whose first name starts XZ);

September 4, second inning – off the Guardians’ Lucas Giolito;

September 15, second inning – off the White Sox’ Jesse Scholtens.

Side Note; Lewis also had a Grand slam in 2022, when he played only 12 games (keeping his rookie status intact), giving him five Grand Slams in his first 66 MLB games,

Lewis, hampered by injury concerns, finished the 2023 season with a .309-15-52 stat line in just 58 games.

Sometimes It’s Not So Grand 

When Twins’ C Ryan Jeffers watched a called third strike from Angels’ righthander Andrew Wantz – in the second inning of a Twins 9-3 win over the Angels on September 24, it marked a not so grand MLB moment.  It was the Twins hitters’ 1,597th strikeout of the season – setting a new MLB single-season record. Notably, the Twins winning record this season is the exception, rather than the rule, among MLB’s top swing-and-miss teams.

A Braves New World

On September 16, as the Braves lost to the Marlins 11-5 in Miami, Braves’1B Matt Olson  went two-for-three with a home run .  It was his 52nd long ball of the season and gave him the Braves franchise single-season record for home runs (topping Andruw Jones … 51 in 2005). Olson, finished September with a .282-54-137 stat line (all career highs).  In fact, with one game left to play, Olson had reached career highs in hits, runs scored, triples, homers, total bases, RBI and average.  Note: On September 28, Olson drove in his 135th and 136th runs of the season, setting a modern-era (post 1900) franchise record for RBI (topping Eddie Mathews 135 in 1953).

The Time is WainwRIGHT

On September 18, Cardinals’ righthander Adam Wainwright – in his 18th MLB season – came into his start against the Brewers with a sore right shoulder and a back impacted by the wear and tear of more than 2,500 MLB innings.  He had 199 MLB wins and a career 3.54 earned run average on his resume – but a 4-11, 7.95 record on the 2023 season.  On this day, Wainwright captured some of the old magic. He pitched seven strong innings (his longest start of the season), gave up just four hits (two walks) and held the Brewers scoreless (his first scoreless outing of the season) – as his Cardinals won 1-0.

The win, Wainwright’s 200th MLB victory – proved to be his final MLB win. A few days later, Wainwright, who had already given notice that this would be his last season in uniform – confirmed that his back and shoulder issues would prevent him from taking the mound again begore retirement. (For trivia buffs, his last pitch was a 2-2 curveball to Brewers’ 3B Josh Donaldson (that Donaldson it for a flyout to center).

In the five seasons from 2009-214, Adam Wainwright went 92-50, 2.83 in 165 starts.

Wainwright will retire with a 200-128, 3.53 record. A three-time All Star, he twice led the NL in victories, owns a pair of Gold Gloves and three times finished in the top three in Cy Young Award voting. As a hitter, he homered on the very first pitch he ever saw (from the batter’s box) off the Giants’ Noah Lowry on May 24, 2006).  He went on to hit  .193, with ten homers and 75 RBI in 742 career at bats. For trivia buffs, what appears to be Adam Wainwright’s last MLB appearance was as a pinch hitter (in front of a Cardinals home crowd) in the sixth inning of a September 29 game against the Reds.  He hit for DH Luken Baker (in the cleanup spot) and grounded out against Brandon Williamson. (At the time, the Cardinals trailed 14-2.)

The Zero Heroes

September saw three complete-game shutouts.

September 8 – Zac Gallen, Diamondbacks, in a 1-0 win over the Cubs in Chicago. Gallen used 107 pitches, giving up three hits, walking one and fanning nine.

September 11 – Brian Woodruff, Brewers, in a 12-0 win over the Marlins in Milwaukee. Woodruff used 106 pitches to toss a seven-hitter, with one walk and seven whiffs.

September 27 – Gerrit Cole, Yankees, in a 6-0 win over the Blue Jays in Toronto.  Cole used 105 pitches, gave up two hits, walked none and fanned five.

Through September there were 21 single-pitcher shutouts in MLB. In 2022, there were 16.

Taking This Twins Thing Seriously

On September 17th Twins manager Rocco Baldelli and his wife Allie added to their family with the birth of – of course – twins (both boys).

A Rookie First

On September 20, as the Diamondbacks topped the Giants  7-1 in Arizona, D-back’s rookie Corbin Carroll – starting in RF and leading off – had a big day. He went four-for-five, with a home run, three runs scored and two stolen baes. Not only did he lead the D-backs to a win, but he also hit his 25th homer  of the season and stole his 49th and 50th bases – making him the first AL/NL rookie ever with a 25-50 season.

Another National Leaguer Goes “Clubbing”

Photo: Thomson200, CC0, via Wikimedia Comm

On September 22, as the Braves topped the Nationals 9-6 in Washington D.C., Braves’ RF Ronald Acuna Jr. clubbed his 40th home run of the 2023 season. (He went two-for four, with a homer, double, hit-by-pitch, three runs scored and one RBI in the game). At the time, Acuna also had 68 stolen bases (in 81 attempts).  In the process, he became just the fifth member of the unique 40-40 club (forty homers and at least forty steals in the same season – joining Joe Canseco, A’s (42/40 in  1988); Barry Bonds, Giants (42/40 1996); Alex Rodriguez, Mariners (42/46 in 1998); Alfonso Soriano, Nationals (46/41 in  2006).

With that homer, Acuna also established a new exclusive club – the 40- homer/sixty-steal club. As September closed, they had to rename Acuna’s club the 40-70  Club (41 homers and 73 steals to go with a .338 average).

A Good Year to Lead Off

Ronald Acuna, Jr.’s September 22, home run gave him the record for home runs hit out of the leadoff spot in the  lineup in a single season at 40. In September 26, he extended that record to 41. As September closed, the Dodgers’ Mookie Betts had 39 home runs out of the leadoff spot this season, tying for second on the list.

Ditto the Above Headline

On September 23, Dodgers; 2B/OF Mookie Betts smacked a pair of doubles and drove in two runs, as the Dodgers topped the Giants 7-0 in LA.  Betts’ two RBI were his 104th and 105th of the season, giving him the single-season MLB record for RBI out of the leadoff spot. Charlie Blackman had held the record at 103 (2017). By September’s end Betts had extended his record to 107 RBI (.306-39-107).

Well, That’s Kind Of Surprising

On September 23, Aaron Judge had a big day versus the Diamondbacks (in New York).  Batting second and starting in RF for the Yankees, Judge:

  • Doubled off Brandon Pfaadt in the bottom of the first inning;
  • Hit a three-run homer to right-center off Pfaadt in the third;
  • Hit a two-run homer off Pfaadt in the fifth;
  • Hit a solo shot off Slade Cecconi in the seventh.

It was Judge’s second three-homer game of the 2023 season – which is why it is mentioned here.  Given a history that includes such sluggers as Babe Ruth, Lou Gehrig and Mickey Mantle, it is surprising that Judge is the first Yankee with two three-homer games in a season. The Yankees, by the way, prevailed 7-1, with Judge collecting six RBI

More #InBaseballWeCountEverything

On September 24, with the Phillies leading the Mets 5-2 (in Philadelphia), the Phils called Mike Lorenzen in from the bullpen in the top of the ninth inning. Two groundouts and a strikeout later, Lorenzen had his first save of 2023. It came in just his second 2023 relief appearance – following 25 starts.  Why is it a highlight?  On August ninth, Lorenzen pitched a complete-game, no-hitter.  The save made him just the tenth  pitcher (since saves became an official stat in 1969) to toss a no-hitter and pick up a save in the same season.  Other names on the list Bob Moose (1969). Jim Bibby (1973); Nolan Ryan (1973); John Candelario (1973); Jerry Reuss (1976); Chris Bosio (1980); Matt Garza (1993); Tim Lincecum (2010).

They call Him the Streak

Photo: Soto:  Ryan Casey Aguinaldo, CC BY-SA 4.0 <https://creativecommons.org/licenses/by-sa/4.0>, via Wikimedia

Between August 26 and September 27, the Padres’ Juan Soto ran off a streak of 30-games getting on base. During that streak her hit .349 (38-for-109), with 11 home runs, 32 RBI and 27 runs scored.,  He also drew 23 walks and was hit by a pitch (.463 on-base percentage).


——Individual Statistical Leaders for September 2023——–

AVERAGE (minimum 75 September at  bats)

National League – Xander Bogaerts, Padres (.416); Noelvi Marte, Reds (.387); Seiya Suzuki, Cubs (.370)

American League –  Yandy Diaz, Rays (.345); Andres Gimenez, Guardians (.333); Josh Lowe, Rays (.318)

The lowest September average (among players with at least 50 at bats in the month)  belonged to Giants’ C Patrick Bailey  at .121 (7-for-58).

HOME RUNS

National League – Ronald Acuna, Jr., Braves (11); Matt Olson, Braves (11); Juan Soto, Padres (10); Kyle Schwarber, Phillies (10)

American League – Marcus Semien, Rangers (9); Nelson Valazquez, Royals (9); Logan O’Hoppe, Angels (9)

The Dodgers J.D. Martinez had the highest September slugging percentage (at least 75 at bats) at .724.  The AL leader was the Astros’ Yordan Alvarez at .629.

HITS

National League – Xander Bogaerts, Padres (42); Seiya Suzuki, Cubs (40); Ozzie Albies, Braves (38)

American League –  Gunnar Henderson, Orioles (33); Marcus Semien, Rangers (33); Jose Ramirez, Guardians (33)

The top seven hitters – in terms of base hits – for September were from the National League.

RUNS BATTED IN

National League – Juan Soto, Padres (29); Seiya Suzuki, Cubs (26); J.D. Martinez, Dodgers (25); Matt Olson, Braves (25)

American League –  Jose Abreu, Astros (26); Spencer Torkelson, Tigers (25); Royce Lewis, Twins (23)

The Rockies Nolan Jones led MLB (at least 75 September at bats) players in on-base percentage at .460. The AL  leader was the Yankees Aaron Judge at .452.  

DOUBLES

National League –   Willy Adames, Brewers (10); Xander Bogaerts, Padres (10); Michael Harris II, Braves (10); Marcell Ozuna, Braves (10)

American League –  Adley Rutschman, Orioles (9); Anthony Santander, Orioles (9); six with eight

TRIPLES

National League – Brenton Doyle, Rockies (4); TJ Freidl, Reds (3); Nolan Jones, Rockies (3)

American League –  Kyle Tucker, Astros (4); Gunnar Henderson, Orioles (3); five with two

The Cubs’ Seiya Suzuki  and Braves’ Marcel Ozuna led MLB in September extra-base hits with 18. The  Orioles’ Gunnar Henderson and Rangers’’  Marcus Semien led the AL with 17.

STOLEN BASES

National League –  Corbin Carroll, Diamondbacks (13); Elly De La Cruz, Reds (12); three with 11

American League – Esteury Ruiz, A’s (13); Bobby Witt, Jr., Royals (11); Andres Gimenez, Guardians (8)

The Diamondbacks’ Corbin Carroll  stole his MLB-leading 13 bases in September  without ever getting caught.

WALKS

National League –  Bryce Harper, Phillies (24); Kyle Schwarber, Phillies (24); Nolan Jones, Rockies (20)

American League –  Aaron Judge, Yankees (27); Edouard Julien, Twins (24); Andy Rutschman, Orioles (19)

The Astros’ Alex Bregman  led in walks/strikeouts ratio (among batters with at least 75 September plate appearances)  at 2.00 … 16 walks versus 8 whiffs in 26 games.

BATTER’S STRIKEOUTS

National League – Kyle Schwarber, Phillies (43); Ryan McMahon, Rockies (33); Nick Castellanos, Phillies (33)

American League – Ryan Noda, A’s (45); Teoscar Hernandez, Mariners (40); Eugenio Suarez, Mariners (40)

PITCHING VICTORIES

National League – Spencer Strider, Braves (4-1); Michael Wacha, Padres (4-2); 13 with three

American League –  Tarik Skubal, Tigers (4-0); Brito, Yankees (4-1); 20 with three

Leading MLB with four September losses were: John Brebbia, Giants (1-4, 4.82); Hunter Brown, Astros (1-4, 9.14); Griffin Canning, Angels (0-4, 4.13); Carlos Rodon, Yankees (2-4, 8.10)

Right Place Right Time & Vice Versa

The Rangers’ Dane Dunning went 3-0, in five September games (four starts) with a 5.02 ERA. The Yankees Michael King went 1-2 in five starts, with a 1.30 ERA.

EARNED RUN AVERAGE (minimum 25 September innings pitched)

National League –  Blake Snell, Padres (0.58); Brandon Woodruff, Brewers (1.67); Logan Webb, Giants (2.02)

American League – Tarik Skubal, Tigers (0.90); Michael King, Yankees (1.30): Reese Olson, Tigers (1.44)

The Royals’ James McArthur  threw the most September  innings without giving  up an earned run (14 1/3). In 11 September  appearances, he gave up just  hits and no runs, while fanning 15 and not walking a single batter.

 INNINGS PITCHED

National League: Zac Gallen, Diamondbacks (36 2/3); Merrill Kelly, Diamondbacks (36 1/3); Logan Webb, Giants (35 2/3)

American League:  Justin Verlander (39); Jordan Montgomery, Rangers (36 1/3); Logan Gilbert (35 2/3)

 STRIKEOUTS

National League – Blake Snell, Padres (41K / 31 IP); Merrill Kelly, Diamondbacks (40K / 36 1/3 IP); Zac Gallen (38K / 36 2/3 IP)

American League – Tyler Glasnow, Rays (48K / 33 1/3 IP); Nick Pivetta, Red Sox (43K / 33 1/3 IP); Tarik Skubal, Tigers (43K / 30 IP)

SAVES

National League – David Bednar, Pirates (9); Tanner Scott, Marlins (8); three with six

American League – Emmanuel Clase, Guardians (8); Clay Holmes, Yankees (8); Pete Fairbanks, Rays (7)

The Pirates’  David  had the most saves without a blown saves in September at nine.

WHIP (Walks +  Hits per Inning Pitched – minimum 25 August innings)

National League – Ryan Pepiot, Dodgers (0.76); Brandon Woodruff, Brewers (0.81); Freddy Peralta, Brewers (0.83)

American League – Tarik Skubal, Tigers (0.60); Gerrit Cole, Yankees (0.69);  Reese Olson, Tigers (0.77)

The Padres’ Blake Snell (among pitchers with at least 25 September inning) held hitter to the lowest average (.123). In the AL, that honor went to Tarik Skubal of the Tigers at .135.

 Random  Bonus Stats:

  • Lucas Giolito of the White Sox gave up the most September homers (10 in 25 2/3 IP), He went 1-3, 6.66.
  • The Yankees’ Gerrit Cole pitched the most September innings without giving up home run – 35.
  • The Pirate’s Johan Oviedo walked the most batters in September (19 in 23 1/3 innings).

Primary Resources:  Baseball-Reference.com; MLB.com; Baseball-Almnac.com


Baseball Roundtable – Blogging Baseball Since 2012.

100Baseball Roundtable is on the Feedspot list of the Top 100 Baseball Blogs.  To see the full list, click here.

Baseball Roundtable is also on the Anytime Baseball Supply Top 66 Baseball Sites list.  For the full list, click here

I tweet (on X) baseball @DavidBaseballRT

Follow/Like Baseball Roundtable’s Facebook Page here.  Find More baseball commentary; blog post notifications; PRIZES.

Member: Society for American Baseball Research (SABR); Negro Leagues Baseball Museum; The Baseball Reliquary.

P1005


Who’s Your Daddy? … Episode 18 … Hoyt Wilhelm

Welcome to  the 18th post in the Baseball Roundtable’s “Who’s Your Daddy?” series, where we take a look at Roundtable-selected lineups that performed exceptionally well against some of MLB’s greatest pitchers.

As always, I would stress that the pitchers included in the Who’s Your Daddy? series are among the “best in the business.”  They are selected not because of the players who performed well against them, but rather because success among hitters when they were on the mound was the exception rather than the rule.  We’ve looked at pitchers from a wide range of eras – from Carl Hubbell to Bob Feller to Nolan Ryan to Justin Verlander. Note:  For those unfamiliar with the series, it’s origins are explained at the end of this post.

___________________________

Before we get started on this edition,  here are links to the previous editions of this series.

Please note: For still active pitchers, the stats are as they stood on the date of the post.

  • Nolan Ryan, click here.
  • Sandy Koufax, click here.
  • Pedro Martinez, click here.
  • Bob Gibson, click here.
  • Randy Johnson, click here.
  • Greg Maddux, click here.
  • Justin Verlander, click here.
  • Bob Feller, click here.
  • Roger Clemens, click here.
  • Max Scherzer, click here.
  • Tom Seaver, click here.
  • Mariano Rivera, click here.
  • Warren Spahn, click here.
  • Lefty Grove, click here.
  • Steve Carlton, click here.
  • Robin Roberts, click here.
  • Carl Hubbell, click here. 

If you go back through past editions of “Who’s Your Daddy?”, you may find a few surprises – like how Will Clark owned Nolan Ryan; Jerry Lynch‘s .714 average versus Sandy Koufax; the fact that Brian Harper faced Roger Clemens 23 times and never struck out; how Ival Goodman (who averaged one home run each 47 at bats over his 10-season MLB career) poked six home runs in just 64 at bats against Carl Hubbell; or that Magglio Ordonez hit .500 in his career versus Mariano Rivera and never fanned against him.

____________________________

As I looked back at past posts in the series, I realized the pitchers featured in these posts had been known for a variety  of pitches – blazing fastballs, sweeping curveballs, devastating change ups, wicked screwballs, darting splitters and more.  However, this series has yet to feature a knuckleball specialist. Well, that time has come.  Today, we feature Hall of Famer, and premier knuckleballer, Hoyt Wilhelm.

As Usual, One Things Led to Another

In keeping with the Baseball Roundtable tradition – “When I begin looking into something one thing always seems to lead to another,” the selection of Hoyt Wilhelm for this series was prompted by a report that, when Padres’ rookie knuckleballer Matt Waldron picked up a win  over the A’s on September 16, it was the first MLB win for knuckleball pitcher in nearly five years (since September 20, 2018).  That started me thinking about MLB’s best-ever knuckleballer and led me to feature Wilhelm in the “Who’s Your Daddy?” series.  

Before we get into the lineup of players who fared especially well against Wilhelm, let’s take a look at his unique career.

Photo: Public domain, via Wikimedia Commons

Hoyt Wilhelm was less than 100 days shy of his thirtieth birthday when he made his major-league debut.  Yet, he still fashioned  a 21-season, 1,070-appearance MLB pitching career – making his last MLB appearance (two scoreless inning in relief) just 16 days shy of his fiftieth birthday. But I’m getting ahead of myself.  There is a lot more to the Wilhelm story.

At a time when the knuckleball was primarily used by pitchers who had “aged out” of effective curves and heaters, Wilhelm began using the pitch (actually a fingertip-ball in his case) as his mainstay as a teenager. In 1942, after high school, Wilhelm signed with the Class-D North Carolina State League Mooresville Moors,  who played just 12 miles from his home town of Huntersville. North Carolina. He went 10-3 for Mooresville before being drafted into the Army. He spent three prime years in the military, seeing plenty of combat and receiving a Purple Heart for wounds he suffered in the Battle of the Bulge.

Hoyt Wilhelm pitched his entire MLB career with a piece of shrapnel (from the Battle of the Bulge) lodged in his back.

After his release from the service, Wilhelm returned to  Mooresville, where he went 41-15 over two seasons and, in 1947, he was signed by the New York Giants.  And, the rest, as they say, is history. Working primarily as a starter, he worked his way up from Class-B to Triple-A between 1948 and 1951 – going 56-46 and pitching to a 3.68 earned run average over 813 innings.  For my home state (Minnesota) readers, Wilhelm spent the 1950-51 seasons with the Triple-A Minneapolis Millers – going 26-15, 4.41, primarily as a starter.

In 1952, Wilhelm stuck with the Giants and had a stellar rookie season – appearing in a league-leading 71 games, going 15-3 (his .833 winning percentage led the NL) and putting up a league-leading (among qualifiers – a minimum of 154 innings pitched) 2.43 earned run average. Surprisingly he finished a distant second in the Rookie of the Year balloting to another reliever, Joe Black of the Dodgers.  Black got 19 votes to three for Wilhelm and one each for the Pirates’ Dick Groat and the Braves’ Eddie Mathews.  As the chart below show, it seems like it should have been a lot closer.

A Unicorn

Hoyt Wilhelm remains the only MLB pitcher to win an earned run title in a season in which he did not start a single game. 

To make a long story short, Wilhelm and his knuckler stayed in the big leagues through 1972.  He pitched in 1,070 games (52 starts, more than half of them  in 1959). His 1,018 relief appearances are fifth all-time and his 1,871 relief innings are first all-time, as are his 124 career wins in relief.

How Much Did Hoyt Wilhelm’s Knuckleball Flutter?

In his first 16 years in the major leagues, the teams Wilhelm suited up for led their league in passed balls in 15 campaigns. A couple of other indicators:

  • In 1958, with Wilhelm on the staff, Indians’ catchers committed a league-topping 35 passed balls. In 1959, without Wilhelm in the fold, that number dropped to six.
  • In 1959, Orioles’ catcher Gus Triandos had 28 passed balls – 24 of them came with Wilhelm on the mound.

Side Note:  The statistics for the Hoyt Wilhelm “Who’s Your Daddy?” lineup are not as telling as for the starting pitchers who have been featured in these posts – primarily because batters did not rack up at bats at the same frequency (given Wilhelm’s role as a reliever). For example, 89 MLB batters had 50 or more at bats versus Bob Feller in his 18 MLB seasons, while just ten opposing batters reached up at least 50 at bats versus Wilhelm in 21 seasons. Still, the group featured here makes for an interesting lineup.

Wilhelm was an  All Star in five seasons (eight All Star selections due to the playing of two All Star games from 1959 through 1962) and led the AL in earned run average, appearances and winning percentage twice each.  (Notably, he led the AL in ERA once as a reliever and once as a starter.) Wilhelm finished in the top three in pitching appearances in six times, and in the top three in saves five times. From 1964 through 1968 he pitched in 306 games, with a 1.74 ERA

While Wilhelm was used primarily as a starter in just one of his 21 MLB seasons (1959 Orioles).  He proved he could go the distance. In 32 games that season (27 starts), he went 15-11, led the AL with a 2.19 ERA. Made the All Star team, threw 13 complete game and delivered  three shutouts.

Seeing Floaters? Just Swing.

On September 20, 1958, Hoyt Wilhelm started on the mound for the Orioles (in Baltimore) versus a tough Yankee lineup that included the likes of Mickey Mantle, Bill Skowron, Elston Howard, Bobby Richardson and Hank Bauer. At the time, the Yankees were in first place at 89-58, while the Orioles were in seventh at 68-77. Wilhelm proved up to the task, no-hitting the Yankees in a 1-0 victory. (The only run coming on a seventh inning Gus Triandos’ home run.) Wilhelm walked two and fanned eight in the 99-pitch outing.


—The Hoyt Wilhelm -Who’s Your Daddy? ” Lineup—

Let’s start with a few statistics.

Put Me In Coach

Hoyt Wilhelm faced Giants’ 3B  Al Gallagher five times in his career – and never got him out (the most plate appearances for any player with a 1.000 on-base percentage versus Wilhelm). From 1970-72, Gallagher had five plate appearance versus Wilhelm and delivered three singles and two walks.  Gallagher was a .263 hitter over four MLB seasons (1970-73 … Giants, Angels).

On the flip side, you find another 3B – the Red Sox’ Joe Foy.  Foy faced Wilhelm 13 times over four seasons and never reached base against him (the most plate appearances versus Wilhelm for a hitter with 0.000 OBP versus the knuckleballer).  Foy only got the ball out of the infield three times versus Wilhelm.  Foy hit .248-58-291 over six MLB campaigns (1966-71 … Red Sox, Royals, Mets, Senators).

Now for the lineup that best handled Wilhelm’s flutterball.

Catcher – Roy Campanella

Photo: Bowman Gum, Public domain, via Wikimedia Commons

The knuckleball may have been hard to catch, but for at least a couple of catchers, it was not so hard to hit. Our starter at catcher is Hall of Famer  Dodger Roy Campanella, who hit .469-2-12 versus Wilhelm over 33 games (1952-57). Campanella’s .469 average versus Wilhelm was the highest among any player with at least 20 career at bats against him.  His fifteen hits were the third-highest against the knuckleballer, as were his 12 RBI. Campanella did not get his first hit against Wilhelm until his ninth plate appearance against him (two walks, a sacrifice, five outs).  From that point on, he went 15-for-15-28, with five walks.


Campanella played ten years with the Dodgers (1948-57), hitting .276-242-856 and making eight All Star teams. He played  ten years in the Negro National League II (1937-42, 1944-45), hitting .316-18-163, making three All Star squads and winning the 1944 Negro National League II batting title with .388 average.

Campanella was the National League MVP in 1951, 1953 and 1955.

Going Yard Twice

On August 13, 1953, Hoyt Wilhelm came on to relieve Al Worthington with his Giants leading the Dodgers 8-4, two men on and one out. Wilhelm got Jackie Robinson on an easy fly to second base, before Roy Campanella took a 2-1 pitch to deep RF for a three-run home run – cutting the margin to one. It stayed that way (8-7) until Campanella faced Wilhelm again with two outs in the top of the ninth.  This time Campanella took Wilhelm yard to LF.  The Giants eventually won 9-8 in ten innings.

Have to also give a shoutout to another catcher, Earl Battey, whose .414 average (12-for-29) versus Wilhelm was the second-highest among players with at least 20 at bats against him.

_______________________________________________________

First Base – Stan Musial

Hall of Famer Stan Musial hit .375 against Wilhelm over 24 games. His four home runs tied for second (career) against Wilhelm. Like Campanella above, Musial had a two-home run game against Wilhelm.  It came on May 2, 1954 in the second game of a doubleheader between Musial’s Cardinals and Wilhelm’s Giants (in St. Louis). In that game, Wilhelm came in to open the bottom of the fourth, with the Giants up 8-3. Musial connected off him for a two-run homer in the fifth and a solo shot in the seventh (his only two at bats versus Wilhelm in the game). The Giants did hang on to win 9-7.


They Call Him The Streak

Stan Musial’s record against Hoyt Wilhelm was a streaky one. From June 12, 1953 through May 2, 1954, Musial faced Wilhelm seven times and collected  five hits (one single, one double and three home runs) and two walks (one intentional).  Immediately after that streak of success, from June 20, 1954 through May 20, 1956, Musial faced Wilhelm nine times and got on base just once (an intentional walk). In those nine plate appearances, he got the ball out of the infield just once.

Musial was an All Star in 20 of his 22 MLB seasons. He was a three-time NL MVP, seven-time batting champion and led the league in a range of offensive categories: games (five times); runs scored (five times); hits (six times); doubles (eight times); triples (five times); RBI (twice); total bases six times); on-base percentage (six times); slugging percentage (five times); walks (once); and intentional walks (five times). He had a career batting average of .331 (3,630 hits in 10,972 at bats) and, despite 475 home runs, never led the league in homers.

An honorable mention at first base has to go to Steve Bilko, who hit .409 (9-for-22), with two homers and six RBI in 19 games versus Wilhelm. Bilko went  .249-76-276 in ten MLB seasons (1949-54, 1958, 1960-62 … Cardinals, Angels, Dodgers, Reds, Cubs, Tigers).

______________________________________

Second Base – Tie: Jackie Robinson & Gene Baker

Hall of Famer Jackie Robinson hit .344 versus Wilhelm and drove in five runs in 34 games.  Robinson also drew nine walks (tied for fourth all-time against Wilhelm) for  a .500 on-base percentage versus the knuckleballer – second among MLB batters with at least 20 at bats versus Wilhelm.

Can’t Touch That

In Jackie Robinson’s first six plate appearances versus Hoyt Wilhelm not a ball was put in play – yet he was on base four times.  (three walks, one hit by pitch and two strikeouts.) 

Robinson played in 11 MLB seasons – 1945 with the Kansas City Monarchs and 1947-58 with the Dodgers. He hit .313-141-761, with 200 stolen bases in 1,416 games. He was the 1949 NL MVP, when he led the league with a .342 average and 37 steals – to go with 122 runs scored, 203 hits, 16 home runs and 124 RBI.

Gene Baker hit .467 (7- for-13) versus Wilhelm – with his one walk versus Wilhelm, he matched Robinson’s .500 on-base percentage. In  nine MLB seasons (1948, 1953-58, 1960-61 … Monarchs, Cubs, Pirates), Baker hit .263-42-255. He was an All Star in 1955 (with the Cubs), when he hit .268-11-52 and played in all 154 games.

_____________________________________

Third Base – Rich Rollins

Rich Rollins hit Wilhelm for a .353 average in 33 games, with one home run and six RBI. His best game against the knuckler came on September 7, 1963 – when Rollins went three-for-four with an RBI versus Wilhelm), who pitched the first eight innings of a game his Orioles lost to Rollins’ Twins 4-2 in 12 innings. A Rollins’ two-run single in the twelfth (off Bruce Howard) was the winning hit in the contest.

Rich Rollins played in 10 MLB seasons (1961-70 …  Twins, Pilots, Brewers, Indians).  He hit .269-77-399 in 1,002 games.  His best season was 1962, when he went .298-16-96, with 96 runs scored and made his only All Star team.

_______________________________________

Shortstop – Dick Groat

Photo: Groat:  Public domain, via Wikimedia Commons

Dick Groat hit Hoyt Wilhelm at a .364 pace (8-for-22).  Notably all eight hits were singles and he had just one RBI versus Wilhelm.  That .364 average, however, puts Groat among the top ten batters with at least 20 at bats versus Wilhelm.  (He’s also one of the most interesting “athletes” on this list – which may have swayed my selection slightly.)

Groat was an All-America at Duke University in both baseball and basketball.  In fact, his best sport made have been hoops. As a senior (1951-52 college basketball season), he averaged 26 points and 7.6 assists per game (leading the NCAA in both categories) and was named the National Collegiate Player of the Year.  In 1952, he also hit .370 and led the Duke baseball squad in hits, doubles, RBI and steals. Duke went 31-7 and made their first College World Series appearance that season.

Dick Groat was the first player elected to both the National Collegiate Basketball and Baseball Halls of Fame.

In 1952-53, Groat (finishing his senior year at Duke) signed (and played) with the NBA’s Fort Wayne Pistons. Shuttling  back and forth between classes at Duke during the week and Pistons games on weekends. He averaged 11.9 points, 3.3 rebounds and 2.7 assists as a pro. In later interviews, Groat t noted “I never had to practice, just play on the weekend.”

That same year, Groat also signed a contract with the Pittsburgh Pirates. He played 95 games for the Pirates in 1952 – going straight from campus to the majors – hitting .284-1-29, providing superior defense and finishing third in the Rookie of the Year voting.

A stint in military service, then disrupted his athletic career(s). After Groat retuned from serving two years in the military, Pirates’ GM Branch Rickey convinced him to focus solely on baseball.  Groat rejoined the Pirates – and the rest is history.

Groat played 14 MLB seasons (1952, 1955-67 … Pirates, Cardinals, Phillies, Giants), hitting .286-39-707, earning All Star honors in five seasons and being selected the 1960 NL Most Valuable Player (that season, he won the NL batting title with a .325 average). Groat also led NL shortstops in putouts in four seasons, assist twice and double plays turned at shortstop five times.


____________________________

OF – Al Kaline

Photo: From collection of User: JGHowes, self-scanned for Wikipedia. JGHowes at en.wikipedia, Public domain, via Wikimedia Commons

Hall of Famer Al Kaline hit .348 against Wilhelm in 48 games (66 at bats/77 plate appearances). His four home runs tied for the second most versus Wilhelm, his 17 RBI were first, as were his 23 hits.  In addition, his ten walks ranked second against Wilhelm (a tie with Bob Allison). Overall, he put up a .429 on-base percentage and a .606 slugging percentagte against the crafty knuckleballer.

That’s The Way To Wrap It UP

In his final five seasons against Wilhelm (1965-69), Kaline reached base in 15 of 20 plate appearances: six singles, one double, one triple, one home run, five walks, one safe on an error, five outs.

Kaline played 22 MLB seasons (1953-74) – all for the Tigers. He was an All Star in 15 of those seasons and led the AL in batting in one (1955 at .340). He retired with a .297 average, 3,007 hits, 399 home runs, 1,582 RBI and 1,622 runs scored – as well as 10 Gold Gloves. He hit over .300+ in nine seasons and had 25 or more home runs in seven.

_____________________________________

OF …  Gary Geiger

Gary Geiger hit .379 (11-for-29), with a triple, three home runs (fifth-highest versus Wilhelm) and six RBI  in 17 games versus Wilhelm – and I needed someone with CF experience in the Garden.

Happy Fourth of July

Gary Geiger celebrated Independence Day 1960 by collecting a walk, a surprise bunt single and a two-run home run versus Wilhelm – who had come on in relief of Steve Barber – as Geiger’s Red Sox topped Wilhelm’s Orioles 10-7 in Boston.

Geiger played in 12 MLB seasons (1958-67, 1969-70 … Indians, Red Sox, Braves, Astros).  He career stat line  was .246-77-283 in 954 games.

Photo: Manny’s Baseball Land via tradingcarddb.com, Public domain, via Wikimedia Commons

Geiger, notably, started his professional career primarily as a pitcher (but with some time in the outfield as well). In 1955, Geiger went 20-7, 1.98 with the Class-D Hilton Cardinals, leading the league in complete games (26 in 27 starts), strikeouts (177) and shutouts (8). (All this, despite control problems: 115 walks in 236 innings). The Cardinals’ organization had pretty solid pitching depth and, in 1956 (at Triple-A), Geiger  went 3-2, 3.78 in 29 games on the mound, but also hit .327 in 39 games.  (He also walked 77 batters in 100 innings). The die was cast and Geiger’s  professional career moved forward as an outfielder.

He made it to the major leagues in 1958 (with the Indians) and played 12 often injury-marred  MLB seasons (1958-67, 1969-70 … Indians, Red Sox, Braves, Astros) – hitting .246-77-283 in 954 games.


_____________________________

OF … Carl Furillo

Carl Furillo hit Hoyt Wilhelm at a .333 pace (15-for-32) and, with five walks, had a .409 on-base percentage against him. Furillo’s ten RBI versus Wilhelm tied for the fourth-most against him and his three doubles tied for second (he also had two homers against Wilhelm).  On August 19,1953, Dodgers’ Furillo faced Wilhelm (who came on for the Giants in the third inning, with New York up  5-2) three times. In his three at bats versus Wilhelm that day, Furillo delivered a two-run single to center; a double to left; and an RBI double (also to left).

Catching Up to the Old Master

Carl Furillo had just one hit (a single) in his first 13 career at bats versus Hoyt Wilhelm (July 3, 1952 through July 12, 1953) and, in fact, got just one ball out of the infield during that time (and even that was ground ball that reached left field).  Then (beginning in his second at bat versus Wilhelm on July 12, 1953 through his last at bat versus the knuckleball master on July 18, 1957, Furillo  went 12-for-26 (.462) against him with three doubles, two homers and ten RBI.

________________________________________

Pitcher – Hal Jeffcoat

Okay, I found an interesting one for this spot. Hal Jeffcoat, who played in 12 MLB seasons (1948-59 … Cubs, Reds Cardinals). Over those12 campaigns he made 245 mound appearances and 559 in  outfield. His best season on the mound was probably 1956, when he went 8-2, 3.84 in 38 games (sixteen starts, two complete games).  His best season at the plate was his rookie campaign (1948), when he hit .279-4-42 in 132 games.

Jeffcoat went 6-for-11 (.545) in 11 games versus Wilhelm  (Jeffcoat played CF in eight of the 11, pitched in three).

Hal Jeffcoat  wen .248-26-188 over 12 MLB seasons (1948-59 … Cubs, Reds, Cardinals) and 39-37, 4.22 as a pitcher.

Like Hoyt Wilhelm, Hal Jeffcoat earned a Purple Heart in World War II. (He was a paratrooper with the 101st airborne. )

Jeffcoat was first recruited as a pitcher, with the endorsement of his brother George Jeffcoat, who made it to the major leagues ahead of him as moundsman. Hal’s three older brothers  all pitched professionally and young Hal had had shown promise in high school and semi-pro ball before serving in the military.

After competing military service Hal signed with the Cubs’ Double-A Nashville Volunteer, who (on the word of his brother George) were expecting a pitching prospect.  Hal  showed up in minor-league camp and  informed his new bosses that he was an outfielder, not a pitcher – and he quickly proved it  – hitting .291-15-75 at Class B and Double-A in 1946 and .346-4-118 at Double -A in 1947, also showing hustle (36 steals in two seasons) and defensive prowess and powerful arm. In 1948, he was with the Cubs (a 23-year-old rookie) and hit .279 in 134 games, while  leading NL centerfielders in outfield assists with 11. (Jeffcoat finished in the top two in CF assists in three of his first four MLB seasons

After a few seasons marked by injuries and  less than stellar offensive production, Jeffcoat agreed to tryout his stuff on the major-league mound.  He made his first MLB pitching appearance in his seventh MLB seasons (1954). And from that time on made just four more outfield appearances.

And, that is how he came to be the pitcher in this Hoyt Wilhelm, “Who’s Your Daddy/”  Lineup.

Primary Resrouces for this post: Baseball-Referene.com; Pirates Star Dick Groat, who also played in the NBA, dies at 92, Will Graves, April 27, 2o23, Associated Press;  Hoyt William Society for American Baseball Research Bio, by Mark Armour; Gary Geiger, SABR Bio, by Norm Ginsberg;  Hal Jeffcoat, SABR Bio, by Andrew Sharp.

_______________________________________

Who’s Your Daddy?  The Inspiration.

On September 24, 2004, in the middle of a tight pennant race, the Yankees handed future Hall of Famer Pedro Martinez and the Boston Red Sox a tough 6-4 loss.  Martinez went 7 1/3 innings giving up nine hits and five earned runs.  The game came just five days after (in his previous start) Martinez had lasted just five frames against the Bronx Bombers (eight hits, eight earned runs) in a 16-7 loss.

After that second loss, Martinez candidly commented, “What can I say? I just tip my hat and call the Yankees my daddy.”  Little did he know that his comment – and a Yankee fans’ chant of “Who’s your daddy?” would follow him into future starts in New York (all the way to his final MLB start – against the Yankees for the Phillies – in Game Six of the 2009 World Series).

The concept of “Who’s your daddy?” became the inspiration for Baseball Roundtable to take a look at the players who “had the number” of some of MLB’s premier pitchers.  Again, you can find links to the previous “editions” of “Who’s Your Daddy?” near the top of this post.

Baseball Roundtable – Blogging Baseball Since 2012.

100Baseball Roundtable is on the Feedspot list of the Top 100 Baseball Blogs.  To see the full list, click here.

Baseball Roundtable is also on the Anytime Baseball Supply Top 66 Baseball Sites list.  For the full list, click here

I tweet baseball @DavidBaseballRT

Follow/Like Baseball Roundtable’s Facebook Page here.  Find More baseball commentary; blog post notifications; PRIZES.

Member: Society for American Baseball Research (SABR); Negro Leagues Baseball Museum; The Baseball Reliquary.

P1003

1916 Giants … MLB’s Streakiest Team

In today’s post, Baseball Roundtable takes a look at (possibly) the streakiest team in MLB history. As is the Baseball Roundtable tradition, when I look into baseball events (past and current) “one thing always leads to another.” This journey began with my interest in the remarkable 1916 season of New York Giants’ pitcher Ferdie Schupp (more on that in a bit.) However, I soon became distracted by the remarkably streaky season of the 1916 Giants as a whole.

On this date (September 7) in 1916, the aforementioned Schupp started for the Giants against Nap Rucker and the Brooklyn Robins (Dodgers) at the Polo Grounds. Southpaw Schupp went the distance for the Giants, tossing a two-hitter. Lefty Rucker also went the distance (a six-hitter) and all four runs scored against him were unearned. The win brought the fourth-place Giants record to 60-62 and dropped the second-place Robins to 74-51.

More important, the win was the first of an MLB-record 26-game winning streak for the Giants.  (Side note: the streak was interrupted after 12 games by a 1-1 tie.  However, ties were not counted in MLB standings and, at the time, games were replayed not resumed. Therefore, MLB recognizes the Giants’ streak as the record.)

That the Giants would go on a streak is no surprise.  During the 1916 season, looking at streaks of five or more games, the Giants:

  • Had winning streaks of 26 and 17 games;
  • Suffered losing streaks of eight games (part of 13 losses in 15 games), five games and six games (the latter two part of a streak of 11 losses in 12 games).

The 1916 Giants are the only team with a 20 (or more)-game, in-season winning streak that did not finish in first place. In fact, the Giants started their record winning streak in fourth place, ended the streak in fourth place and finished the season in fourth place. 

The Giants’ two winning streaks provided a record-book bonanza.

  • The 26-game winning streak (September 7 through September 30) involved all home games (part of a 31-game homestand). That gave the Giants the record for the overall MLB winning streak and home winning streak.
  • The 17-game winning streak involved all road games (part of a 21-game road trip). That streak gave the Giants the record for consecutive road wins.  While the Tigers broke the overall record for consecutive road wins in 1983-84, the Giants still share the single-season record of 17 consecutive road wins (with the 1984 Tigers).

A Tiger by the Tail

The 1983 Tigers won their final four road games. Detroit then opened the 1984 season by winning their first 17 road games (on their way to a 35-5 start).  The 17 road wins tied the single-season record for consecutive road wins and (with the four final road wins of 1983) helped set a new multi-season mark for consecutive road wins.

Now, let’s get back to those 1916 Giants.  In their 26-game winning streak, they outscored their opponents 121-32 (not counting the 1-1 tie). The streak included ten shutouts and four one-run victories.

During the streak, southpaw, Ferdie Schupp, the original topic of the research behind this post, started six games and went 6-0, with a 0.33 earned run average.  He tossed six compete games and gave up just three runs (two earned) and just 17 hits in 54 innings.

Schupp (who made his first 1916 MLB appearance on June 13) finished the 1916 season with a 9-3, record and a 0.90 earned run average in 140 1/3 innings. Notably, Schupp’s 0.90 earned run average was – at the time – recognized as the MLB single-season earned run average record. If you look at today’s record books, the single-season lowest ERA record (post-1900) is assigned to the Red Sox’ Dutch Leonard (0.96 in 1914), with statisticians applying the current qualifying standard of at least one inning pitched per team’s game played. But as Daniel Levitt pointed out in his superb article in the 1996 Society of American Baseball Research “Baseball Research Journal (“Lowest Season ERA? Ferdie Schupp.  He meets the Criteria”), the standard for qualifying at the time was a season of with at least ten complete games. Levitt makes a strong case that Schupp should still have the record on the basis of the criteria at the time,  longevity of that recognition and the  lack of new evidence to the contrary. Baseball Roundtable agrees (that was the original focus of this post).

Schupp followed up his 1916 season with a 21-7, 1.95 record for the 1917 Giants (with 25 complete games in 32 starts). His career MLB mark (10 seasons) was  61-39, 3.32.

Here are a few other factoids about 20+ game MLB winning streaks:

  • In their 2017 22-game wining streak, the Cleveland Indians outscored their opponents 142-37, threw seven shutouts and won four one-run games. The streak covered 11 home games and 11 away games. The Indians’ big four starters of Trevor Bauer, Mike Clevenger, Carlos Carrasco and Corey Kluber picked up wins in 17 of the 22 games (they also got the wins in 65 of the team’s 102 2017 victories).
  • The 1935 Cubs outscored their opponents 137-50 in their 1935 21-game winning streak. It included four shutouts and five one-run games – and 18 home games (versus three road games). Eighteen of the Cubs’ 21 wins involved complete games by the Cubs’ starting pitcher (#HowTheGameHasChanged).
  • The 2002 A’s outscored their opponents 141-65 in their 20-game winning streak, which included four shutouts, four one-run games, ten home wins and ten road wins. The final three wins in the A’s streak were walk-off wins at home.

Primary Resources:  Baseball-Reference.com; Baseball-Almanac.com; “Best Season ERA? Try Freddie Schupp,” by Daniel R. Levitt, The Baseball Research Journal, Society for American Baseball Research, 1996.

Baseball Roundtable – Blogging Baseball Since 2012.

100Baseball Roundtable is on the Feedspot list of the Top 100 Baseball Blogs.  To see the full list, click here.

Baseball Roundtable is also on the Anytime Baseball Supply Top 66 Baseball Sites list.  For the full list, click here

I tweet (on X) baseball @DavidBaseballRT

Follow/Like Baseball Roundtable’s Facebook Page here.  Find More baseball commentary; blog post notifications; PRIZES.

Member: Society for American Baseball Research (SABR); Negro Leagues Baseball Museum; The Baseball Reliquary.


P1002

Baseball Roundtable 1,000th Post – a Potpourri of MLB Unexpected Occurrences and Coincidences

This day (August 22) in 1982, Cardinal’s backup catcher Glenn Brummer  produced an unexpected performance that still stands as a unique moment in Redbird lore. Let’s start this tale with a bit of  a bit of background.

First, Brummer was not just the Cardinals’ backup catcher, he was the backup to the backup – with starter Darrell Porter and backup Gene Tenace ahead of him.  He had, in fact, spent part of the early season as a backup catcher at Triple-A until an injury to Porter led to Brummer’s callup (when Porter recovered, the Cardinals kept Brummer on the team as a third-string backstop and defensive replacement).

Second, Brummer did not start behind the plate that day. In fact, he didn’t enter the game (Giants at Cardinals) until the bottom of the eighth, when he came on as a pinch runner for pinch hitter Steve Braun (who had hit for Tenace) and stayed in at catcher.  (Keep that pinch runner designation in mind, it will play later in this tale.)

Coming into the game, Brummer had one career stolen base (it had come on June 4 of that year) and he had notched just one plate appearance (in nine game appearances) since June 23 (when he delivered a single after coming in as a defensive replacement).

In that August 22 game, the Cardinals trailed 4-3 when Brummer entered, but tied it at four in the bottom of the ninth, which – ultimately – set up Brummer to deliver the unexpected (as a runner).

Brummer opened the bottom of the tenth with a strikeout (versus Gary Lavelle) and when his spot in the lineup came around in the twelfth inning, it was still 4-4 and Lavelle was still on the mound.  Brummer delivered a one-out single, then moved to second on a single by CF Willie McGee. After a foul pop out by 3B Julio Gonzalez, an infield single by SS Ozzie Smith loaded the bases (Brummer on third) with two outs. Brummer noticed that Lavelle didn’t seem to be paying much attention to him. (Drummer after all had one career MLB stolen base at the time.) So, he worked to extend his lead. Then, with a 1-2 count on LF David Green, Brummer made a successful straight steal of home to win the game. (It was his second and final steal of the season.)

The play, by the way , was not without controversy. As Brummer broke for home, Giants’ catcher  Milt May stepped in front of the plate to catch the pitch and attempt a tag on Brummer and umpire  Dave Pallone stepped to the side to better see and make the call. The Giants argued that Pallone had not made a “call” on the pitch – which would have been out number-three and negated the run if it was a strike. The Cardinals argued that since the pitch never reached the plate, it could not be a strike (or even a pitch). Pallone then called the pitch ball to end the debate and the steal became part of Redbirds’’ lore.

Brummer, by the way, played in 178 games in five MLB seasons (1981-85) – during which he hit .251-1-27 in 347 at bats and stole just four bases in 12 tries (including one memorable swipe for a 12trh inning victory).

So, why is this story her today?  Because, I’m pretty sure anyone would have given you odds of 1,00-to-one or better against Brummer swiping home (particularly with two outs and two strikes on the batter and the bases loaded) to win an extra-inning game. And I like that 1,000 number because this is the 1000th Baseball Roundtable post.

With that, I’m going to dedicate this post to some unexpected on-field occurrences or coincidences that I have particularly enjoyed coming across while researching the previous 999 offerings. These tidbits are presented in no particular order – like looking  at a series of unrelated slides (remember slides) – but I hope readers find some of them interesting or entertaining.

I Call Your Steal of Home and Raise You One

On August 14, 1958, the Indians’ Vic Power tied an MLB record by stealing home an MLB record-tying twice in one game – the second of which came in the bottom of the tenth inning, giving the Indians a “run-off” 10-9 win over the Tigers.  Why does this feat find a place on my unexpected list?   Power stole only three bases during the entire 1958 season.

Do You Want Fries With That?

On Opening Day, April 7 – 2022, Diamondbacks’ DH Seth Beer hit his second MLB home run – a walk-off, three-run shot in the bottom of the ninth (as  the Diamondbacks topped the Padres 4-2 in Arizona). Notably, Beer’s blast came on National Beer Day.  About a month-and-a half later, on National Hamburger Day (May 28), White Sox’ 3B Jake Burger hit his fifth career home run (as the White Sox lost to the Cubs 3-1 at Guaranteed Rate Field). Hmmm.  When is the next National French Fry Day?

An Oddly Even Game

On August 13, 1910, the Pittsburgh Pirates and Brooklyn Superbas (Dodgers) played perhaps the most “even” MLB game ever.  The first game of that day’s twin bill was pretty tight – a 13-inning,3-2 Pirates’ win.  Game Two put Game One  to shame.  It ended after nine frames in an 8-8 tie (called due darkness).  In the game:

  • Each team scored 8 runs;
  • Each team recorded 13 hits in 38 at bats;
  • Each team made two errors;
  • Each team recorded 13 assists and 27 putouts;
  • Each team gave up three walks;
  • Each team suffered one hit batsman;
  • Each team fanned five times;
  • Each team was charged with one passed ball;
  • Each team was awarded five RBI among their eight runs scored.

Another Oddly Even Game

On April 15, 1968, The Astros topped the Mets 1-0 in 24 innings.  In that one:

  • Each team had 11 hits in 79 at bats;
  • Each team had ten singles and one double;
  • Each team left 16 men on base;
  • Each squad made on error;
  • Each team threw two wild pitches;
  • Each team turned one double play.
  • Each team used four pinch hitters.

Oh, and by the way, the wining tally scored on a groundball error.  So, each team scored zero “earned” runs.

Won’t See This Again. Probably Wasn’t Expected Even Then.

On May 1, 1920 The Brooklyn Robins and Boston Braves played the longest game (in innings) in MLB history – a 26-inning 1-1 tie.  The unexpected?  Both starting pitchers (Brooklyn’s Leon Cadore) and Boston’s Joe Oeschger) went the distance.

Probably Won’t See This Either

Photo: Bowman, Public domain via WikiCommons

From 1950-59, The Phillies’ Robin Roberts averaged just over 300 innings pitched per season (3011 2/3 innings pitched in ten seasons). Further, in a six-year span (1950-55), he averaged 323 innings pitched per season and led the NL in innings logged five times  – never throwing less than 304 1/3 innings in a season.

Timing is Everything

Sammy Sosa is the only player to  hit 60 or more home runs in three seasons 1998, 1999 and 2001 – and he didn’t lead his league in home runs in any of those campaigns. In 1998, as a Cub,  he finished with 66 home runs to the Cardinals’ Mark McGwire’s 70. In In 1999, it was Sosa with 63 homers and McGwire with 65. In 2001,Sosa had 64 homers to the Giants’ Barry Bonds 73.

More timing – Shortest Solo Reign as MLB Home Run King

On September 25, 1998 Sammy Sosa hit his 66th homer of the season off Jose Lima – taking sole possession of the all-time lead for home runs in an MLB season.  Just 45  minutes later, Mark McGwire tied Sosa for the lead with his 66th homer  of the season and the very next day McGwire took sole possession of the record with his 67th.

As ESPN Classic reports,  at 8:39 p.m. (CDT) Sosa hit his 66th longball of the1998 season (fourth inning off Astros Jose Lima) – moving one ahead of McGwire as the all-time single-season record holder.  At 9:24 p.m. that same night, McGwire moved back into a tie with a home run off Nationals’ Shayne Bennett.   (McGwire eventually hit 70 that season, a record that stood until 2001, when Barry Bonds hit 71.) Note: Babe Ruth held the single-season  home run crown from September 28 1919 until October 1, 1961 (breaking his own record several times that span).

An Unexpectedly Tense Game

On September 9, 1965 future Hall of Famer Sandy Koufax pitched a perfect game against the Cubs (in LA). Unexpectedly, he pretty much needed to be that good.  His mound opponent that day was Bob Hendley (who would go on to a 48-52, 3.97 record in seven MLB seasons). Hendley gave up just one hit and one walk in the game – surrendering just one unearned run. Thus Hendley, perhaps unexpectedly, shares the record with Koufax for the fewest (combined) hits ever allowed in an MLB game (one).

Some Milestone Homers

  • Brothers B.J. and Justin Upton both hit their 100th career home runs on the same day – August 3, 2012.
  • On April 13, 2009. White Sox RF Jermaine Dye and 1B Paul Konerko each hit their 300th career home runs – and they did it back-to-back in the top of the second inning.

Stan and Nate – The Grandaddy of  All MLB Coincidences

This story has been told often, but it remains The Roundtable’s favorite baseball coincidence. On May 2, 1954, Stan “The Man” Musial had one of the greatest days at the plate in major-league history.  That day, the New York Giants faced Musial’s Cardinals in a double header before 26,662 fans at Busch Stadium (I). Game One, a 10-6 Cardinal win, saw Musial go four-for-four with three home runs (his first-ever three-homer game) and six RBI. In Game Two, a 9-7 Cardinals’ loss, Musial went two-for-four, with two home runs and three RBI – becoming the first player ever to hit five home runs in a doubleheader. 

Among the 26,662 fans witnessing Musial’s feat was eight-year-old Nate Colbert – who, on August 1, 1972, would become the second player in MLB history (and there are still only two) to hit five round trippers in a double header. In Game One of that doubleheader (Padres at Braves), Colbert went four-for-five, with two home runs and five RBI, as the Padres won 9-0.   In Game Two, an 11-7 Padres’ win, Colbert went three-for-four with three home runs and eight RBI.  Stan Musial, however, was not in the crowd.  (Now, that would really have been a coincidence.)

 A Royal Coincidence?

The Kansas City Royals  were the first AL expansion team to win a Division Title; a League Championship; and a World Series Crown – and they did it in three different seasons –  1976, 1980 and 1985, respectively.

Like Father, Like Son

Cecil  (father) and Prince (son) Fielder were both big-league power hitters.  Cecil enjoyed a 13-season MLB career, while Prince played in 12 MLB season. Cecil’s career stat line was .255-319-1,008, while Prince was .283-319-1,028.  The key coincidence for me here is that home run number.

Father and son:

  • Each hit 319 carer homers;
  • Each had one season of 50 or more homers;
  • Each had one season of 40-49 homers;
  • Each had four seasons of 30-39 home runs.

And, they were “closers:”

  • Each hit 97 home runs with two outs;
  • Each hit 18 ninth-inning long balls.

Are You Sure about That?

The winning pitcher in the first and only MLB Hispanic American All-star game was Alvin O’Neal McBean.  Click here for the full story on that one.

Consistently Is Not always A Hobgoblin

In 1996, the Rockies’ Vinny Castilla’s’ stat line was .304-40-113.  In 1997?  .304-40-113.

Statistics Can Be Fun

Placido Polanco is the all-time leader (Minimum 500 games) in fielding percentage at third  base and second base.

A Good Day To Be Born

In 1994, White Sox’ 1B Frank Thomas was the American League MVP and Astros’ 1B  Jeff Bagwell was the National League MVP – both were born on  May 27, 1968.

By George, That’s a Good one

Hall of Famers Tom  Seaver, Sparky Anderson, Ken Griffey, Jr., Babe  Ruth and Rube Waddell are all “Georges.”  George Thomas Seaver; George Lee Anderson; George Kenneth, Griffey, Jr.; George Herman Ruth; and George Edward Waddell.

That’s Your Uncle Bob

Bob Lemon, who made the Hall of Fame as pitcher, played CF when the Indians’ Bob Feller  no-hit the Yankees (1-0) – marking the first time the Yankees were no hit at Yankee Stadium. (Lemon started his career  as a 3B-OF. ) Makes a good trivia question:  What Hall of Famer played CF in Bob Feller’s second career no-hitter?

That was Fun, Let’s Do It Again.

On May 2, 2002 2B Brett Boone and CF Mike Cameron were batting in the two and three holes in the Mariners’ lineup, as they faced off against the White Sox in Chicago. After Mariners’ RF Ichiro Suzuki was hit by a pitch (on the first pitch) to open the game, Boone took the very next pitch from White Sox starter Jon Rauch to deep RF for a two-run home run.  It took four pitches, but Cameron followed up with a solo home run – a couple of back-to-back blasts.  Six runs and two outs later, Boone came up again and delivered another two-run home run (this time off Jim Parque) and Cameron followed with a solo shot to center.  Back-to-back twice in the same inning – an unexpected MLB first and still only.  Cameron, by the way, went on to hit an MLB single-game, record- tying four home runs in the contest – won by the Mariners 15-4.

Let Me Show You How its Done

Photo by gomarky

On June 18, 1999, the Yankees’ David Cone pitched a perfect game, as New York downed Montreal 6-0 at Yankee Stadium. It came on Yogi Berra Day and the ceremonial first pitch was thrown by Don Larsen – who pitched a Perfect Game in the 1956 World Series – to  Berra.

Perfectly Unexpected

The White Sox’ Phil Humber pitched eight seasons in the big leagues – going 16-23, with a 5.31 earned run average.  He made 51 starts and tossed just one career complete game.  It as a good one though – a perfect game against the Mariners (in Seattle). Humber completed the masterpiece in 96 pitches (67 strikes) with nine strikeouts. In the game, Humber did not go to a three-ball count on any batter until the ninth (two 3-2 counts) and only  seven balls were hit out of the infield.

I Like The Pressure

Twenty-year-old righty Francisco Rodriguez made his MLB (with the Angels)  on September 18, 2002. He pitched in just five games – 5 2/3 innings, three hits, two walks, 13 whiffs – but he made it the post-season roster. In the 2002 post-season he pitched in 11 games, 18 2/3 innings, giving up ten hits and two runs, while walking five and fanning 28. More importantly, he had five post-season wins – all before he recorded a regular-season decision (win or save).  He went on to pitch in 16 MLB seasons, going 52-53, 2,86, with 437 saves (leading the league three times) with 1,142 strikeouts in 976 innings.

On A Last Place Team. Kind Of Unexpected,  But It Was Lefty.

On (August 21, 1972, Phillies’ lefty Steve Carlton, on his way to his first Cy Young Award, lost a heartbreaker to the Braves (2-1 in 11 innings) in Philadelphia. Carlton went all 11 innings (two runs, seven hits, three walks, ten whiffs, as did his mound opponent Phil Niekro (one run, nine hits, three walks, ten strikeouts.) So, why does a Carlton loss appear in this post?

Because it broke a string of 15 consecutive winning decisions (with four no-decisions tossed in) since his last loss (which came on May 30).   In those 19 starts. Carlson had gone 15-0 and the Phillies had gone 17-2.  What attracted The Roundtable’s attention was that during that same time period between Carlton losses (June 1 – August 21), the Phillies had gone  27-47 … 17-2 in games Carlton started and 10-45 in those he didn’t. For the season, Carlton went 27-10, 1.97 and the Phillies went 29-12 in Carlton’s starts and 30-85 when he didn’t take the mound. Carlton, while pitching for the last-place Phillies led the NL in wins (27), ERA (1.97), starts (41), complete games (30); innings pitched (346 1/3); and strikeout 310. It earned him the Cy Young Award.

Getting A Late Start On A Strikeouts Lead

Had there been a Cy Young Award in 1902, Rube Waddell – like Steve Carlton above, would have won it.  And, his accomplishment would have been as unlikely as a pitcher on a last place club capturing that honor. Waddell started the 1902 season in the California League and didn’t make his first MLB start of the season until June 26 – for the fourth place Philadelphia Athletics (who were just one game over .500 at 26-25).

Despite missing more than 40 percent of the MLB season, Waddell went on to lead the league in strikeouts (210) and finish second in wins (24 versus seven losses); while putting up the league’s second-best ERA at 2.05. Oh, and he led the Athletics to the AL pennant. For more on the amazing and zany career of Waddell, click here.

Don’t Worry Boys, I’ll Handle This

In 1920, Babe Ruth, hit 54 home runs for the Yankees  Not a surprise – unless, of course, you factor in the fact that no other American League  team hit more than 50 and Ruth also outhomered all but one of the National teams (the Phillies had 64 team homers.)  The second-most home runs by any player in 1920 was the Browns’ George Sisler’s  19.

Ray Caldwell Hit By  Lightning  – Finishes Game

On August 24, 1919 hard-nosed righty Ray Caldwell made his first appearance on the mound for the Cleveland Indians (he had been released the Red Sox) – and it was electrifying (even death-defying) .  He started  against the Philadelphia Athletics – under threatening skies.  He got to the bottom of the ninth with a 2-1 lead.  With two outs and the A’s number-five hitter Joe Dugan at the plate, the skies delivered on their threat.  As witnesses reported, a lightning bolt blazed from the sky, hit near the press box, traveled down the ballpark railing, exited and crossed the field, dropping Caldwell (some said it hit him in the top of the cap).  Caldwell was on the ground for about five minutes, then slowly sat up, got to his feet, shook his head to clear the cobwebs (or perhaps th eclectic buzz), demanded the ball and promptly retired Dugan on a ground out to third.  For the full story on Caldwell unexpected finish to this game, click here.

Gotta Love them Zeroes

In 1968, Dodgers’ righty Don Drysdale pitched a record six consecutive complete-game shutouts between May 14 and June 4. In those 54 innings, he gave up just 27 hits and nine walks, while fanning 42. Surprisingly, the Big D finished the season at just 14-12 (but with a 2.15 ERA), despite the six straight whitewashings.  In all, eight of his 14 wins were shutouts.

Who Says Pitchers Can’t Hit?

The first National Leaguer (any position) to hit two Grand Slams in a game was a pitcher – Tony Cloninger, who did it in a Braves 17-3 win over the Giants  on July 3, 1966.  Cloninger collected a pitchers’ record nine RBI in the game – and also threw a complete-game seven-hitter. This tidbit gets “extra credit”  when you add the fact that, after retiring from MLB, Cloninger became a world-class slow-pitch softball player. In 1978 (six years after his MLB retirement), playing  for the United States Slow-Pitch Softball Association’s Slow-Pitch World Series Champion Howard & Carroll team, Cloninger was selected as the third baseman on the Series All-World Team.

Got Any More Bob millers Out in the Pen?

On August 15, 1962, as the Philllies topped the Mets 9-3 in the first game of a twin bill, Phillies’ starting left fielder Don Demeter touched up starting pitcher right-hander Bob Miller (Robert Lane Miller) for a third-inning, solo home run. In the ninth frame, Demeter (who had now moved to CF) hit a three-run home run, this time off  left-handed reliever Bob Miller (Robert Gerald Miller). So, two home runs in one game off two Bob Millers, one southpaw and one righty, one starter and one reliever, while in the lineup at two different positions.

The Jim and Chuck Show

In 1961, the Orioles’ Jim Gentile tied the MLB record and set a new AL mark (both since broken) for Grand Slams in a season with five bases-loaded long balls.  Every one of Gentile’s five four-run blasts was hit in a game started by  Orioles’ righty Chuck Estrada (who, as you would expect, picked up a victory in all four contests).  Added credit for the fact that Gentile hit only one other Grand Slam in his career (June 26, 1960) and – you guessed it – the starting and winning pitcher in that contest was Chuck Estrada.


More Grand Slam Surprises

In 1987, Yankees’ first baseman Don Mattingly set an MLB single-season record (since tied) with six Grand Slams. Despite a 14-season career that included 163 bases-loaded plate appearances, Mattingly did not hit another Grand Slam before or after those record-setting six.

Wha-a-at?

Babe Ruth had more inside-the-park home runs and more steals of home than Ricky Henderson.

A Couple Of Bookends

John Miller hit just two home runs in his MLB career – one for the Yankees in 1966 and one for the Dodgers in 1969.  Those blasts made him one of just two MLB players to homer in their first and last MLB plate appearance.

This Seems Unlikely, I Guess.

Only five times in MLB history has a pitcher fanned 20 batters in nine innings  – Roger Clemens (twice); Kerry Woods; Max Scherzer; and Randy Johnson. (Johnson was the only non-complete game. He fanned twenty in nine innings, but was relieved by Byung-Hyun Kim in the top of the tenth with the score tied 1-1.) The tidbit that attracted me here is that is that in those five nine-inning, 20-strikeout outings, these dominating pitchers did not walk a single batter. That’s right, 100 whiffs and not a single walk.

Side Note; Om  September 12 1962, Tom Cheney of the Washington Senators set the MLB record for strikeouts in a single game at 21. Cheney pitched a 16 -inning complete game, one run on ten hits and four walks, with 21 strikeouts – as the Senators won 2-1.

It’s Good To Have Backup

In 1961, when Roger Maris hit 61 homers to break Babe Ruth’s  homerun record, he drew zero intentional  walks. (He was batting in front of Mickey Mantle.)

Casey Got A Good Start at Yankee Stadium

Casey Stengel, while a member of the New York Giants, hit the first-ever inside-the-park and over-the-fence post-season home runs in Yankee Stadium, (Games One and Three of the 1923 World Series.)

Just Start Me In Twin Bills

In August of 1903, the Giants’ Joe McGinnity started both games of a double header three times (August 1, 8 and 31), pitched six complete games and won them all, giving up just ten runs.  What puts this on this list is, that same month, McGinnity pitched just one game on six other occasions – going 1-5 and giving up 28 runs. Apparently, he liked a full day’s work.

Primary Resources:  Baseball-References.com; Baseball-Almanac.com; MLB.com; ESPN.com

_________________________________________________

About Baseball Roundtable:  Over the span of 1,000 posts, Baseball Roundtable has published a combination stats and stories,  observation and opinion (mine and the readers’).   On these pages, The Roundtable has launched:

The Annual John Paciorek Award – honoring players with brief, but in some way notable, baseball careers. For the latest JPA post – with a link to all the JPA offerings, click here.

The “Who’s Your Daddy?” Series – presenting position-by-position lineups of players who performed exceptionally well against some of the best pitchers of all time. For the latest “Who’s You Daddy?” post, which includes links to the entire series, click here.

The Baseball Roundtable Trot Index – tracking the percentage of plate appearances that result in a “trot” – around the bases (home run); back to the dugout (strikeout); or to first base (walk, hit by pitch, catcher’s interference.)

The annual Baseball Roundtable Unofficial Fan Hall of Famed Ballot, as well as fan surveys on the baseball experiences (time of game, concessions, etc.), proposed rule changes and the general state of the game.

Lists covering topics from Baseball Roundtables’ favorite baseball quotes, nicknames and baseball cards.

Baseball Roundtable has also offered month-by-month MLB season summaries – with stats, stories (highlights) and Baseball Roundtable’s Players, Pitchers and Surprise of the Month.  Baseball Roundtable has also featured guest posts by former players; coaches; sportswriters; writers from such websites as LiftYourGame.net, CatcherHome.com; The BaseballReviews.com; OldSportCards.com; I70Baseball.com; and even an Emmy Award Winner.

Looking forward to the next 1,000 posts.  Thanks to all for reading The Roundtable.


Baseball Roundtable – Blogging Baseball Since 2012.

100Baseball Roundtable is on the Feedspot list of the Top 100 Baseball Blogs.  To see the full list, click here.

Baseball Roundtable is also on the Anytime Baseball Supply Top 66 Baseball Sites list.  For the full list, click here

I tweet (on X) baseball @DavidBaseballRT

Follow/Like Baseball Roundtable’s Facebook Page here.  Find More baseball commentary; blog post notifications; PRIZES.

Member: Society for American Baseball Research (SABR); Negro Leagues Baseball Museum; The Baseball Reliquary.