Winter Musings – Pitchers with Two Complete-Game Wins in a Day

Just some musing from the BBRT “We can be pretty sure that’ll never happen again” file.

On August 29, 1926, Cleveland Indians’ right-hander Emil “Dutch” Levsen had one remarkable day on the mound:

  • He started both games of a doubleheader against the Red Sox;
  • He went the full nine-innings in both contests;
  • He won both games – by scores of 6-1 and 5-1 – tossing two four-hitters;
  • He did it all without striking out a single Boston batter.

DutchDutch Levsen was the last pitcher to record two complete-game victories in a doubleheader – a feat which has been accomplished 52 times (by a total of 42 pitchers) in MLB history. (National League – 35 times/26 pitchers; American League – nine times/nine pitchers; American Association – five times/four pitchers; Players League – three times/three pitchers).

It’s not likely we’ll see anything like Levsen’s performance again.  Let’s face it, we now seldom see:  1) Doubleheaders (particularly single-admission twin bills); 2) Complete games (2017 saw a total of 59 MLB compete games – 1.97 per team);  3) Games in which a team does not record a single strikeout (2017 saw 8.25 strikeouts per team/per game); and, of course, teams sending the same pitcher out to start both ends of a double dip.

Unfortunately, for Levsen, there are indications that tossing both ends of a doubleheader was not such a great idea. The rookie righty (he had been in just 11 games in three previous call-ups) ended that August 28 twin bill with a record of 14-11 and a 2.96 earned run average. He made five more starts that season – picking up two wins and two losses, but also pitching to a 6.21 ERA. His final line on the 1926 campaign was 16-13, 3.41.  Levsen pitched two more seasons for the Indians, going 3-10, 5.47.

Someone has to be first …

The first MLB pitcher to earn two complete-game victories in a single day was William “Candy” Cummings of the National League’s Hartford Dark Blues. Cummings picked up a pair of complete-game wins against the Cincinnati Reds on September 9, 1876. The Hall of Famer – credited with inventing the curveball –  went 145-94, with a 2.42 ERA in six MLB seasons. 

Researching Levsen’s unique doubleheader accomplishment, led me deeper into twin bill history (much like examining MLB’s only all .400-hitting outfield … click here for that post … led me to a look at MLB’s .300-hitting teams … click here for that post.)  Here’s bit of what I discovered about hurlers who earned two complete-game wins in a single day.

___________________________

FEWEST RUNS GIVEN UP BY A PITCHER THROWING

TWO COMPLETE GAMES WINS IN A SINGLE DAY … ZERO

Ed Reulbach - two shutouts in one day.

Ed Reulbach – two shutouts in one day.

On September 26, 1908, Chicago Cubs’ right-handed hurler Ed Reulbach started both games of a doubleheader (versus Brooklyn).   Reulbach won both games of that twin bill, went the distance in both contests AND did not give up a single run.  He remains the only MLB pitcher to throw two complete game SHUTOUTS on the same day.

The Cubs were involved in a heated pennant race and the pitching staff was reportedly growing arm weary.  So, Cubs’ player-manager Frank Chance called on Reulbach to toe the rubber in both contests against the Brooklyn Superbas (Dodgers). The high-kicking right-hander responded by shutting down the Brooklyn squad 5-0 in game one and 3-0 in game two – giving up just eight hits in 18 innings on the day.  The extra work didn’t seem to bother Reulbach, as he came back after four days rest to shut out the Reds in his next start.  Just how critical were Reulbach’s two September 26 wins? The Cubs won the 1908 pennant with a 99-55 record – just one game ahead of both the Pirates and the Giants.

We interrupt this story for …

On July 4, 1882, there were plenty of fireworks as Pud Galvin of the National League Buffalo Bisons picked up a pair complete game wins versus the Worcester Ruby Legs – by scores of 9-5 and 18-8.  The 13 runs Galvin surrendered remain the most ever by a pitcher notching a pair of complete games wins in a single day.

Reulbach’s accomplishment should not have been a surprise.  “Big Ed” was on the way to a 24-7, 2.03 season in which he would lead the NL in winning percentage for the third consecutive year.  Reulbach’s final major league tally, over 13 seasons, was 182 wins, 106 losses and a 2.28 ERA. (Over his first four seasons, Reulbach went 78-29, with a 1.70 ERA.)

Now, that’s a bad day at the office … 

While Ed Reulbach managed to toss a pair of shutouts when starting both ends of a doubleheader (see story above). Elon “Chief” Hogsett may have had the worst day ever for a pitcher starting both ends of a double dip. It came on August 18, 1936 – with his St. Louis Browns facing the Detroit Tigers in St. Louis  (Note:  The 32-year-old southpaw had started the season with the Tigers and had been traded to the Browns – after seven seasons with Detroit – in late April.)  The southpaw submariner started Game One of the doubleheader by giving up six straight hits (one out was recorded on the base paths) before being pulled from a game Browns eventually won 10-7.  

Browns’ manager Rogers Hornsby sent Hogsett out to start the second game and he fared even worse in that tilt, giving up five hits and five runs and, again, recording only one out.  His line for the day:  2/3 of an inning pitched, ten hits, nine earned runs and one loss.  Hogsett, who came into the day 10-10 on the year with a 5.64 ERA, finished the day at 10-11, 6.12.   Hogsett pitched in 11 major league seasons, going 63-87, 5.05 ERA – starting 114 games and relieving in 116.

MOST TIMES DELIVERING TWO COMPLETE GAME VICTORIES

IN A SINGLE DAY – THREE

Portrait of Joe McGinnity, baseball playerJoe “Iron Man” McGinnity earned his nickname because of his off-season work in an iron foundry, but it was also a pretty apt descriptor of his presence on the mound.  McGinnity started both ends of a doubleheader an MLB record five times in his career, and three times in a single month.  Notably, in August 1903, McGinnity not only started both ends of a doubleheader three times, he also won all six games and completed all six.

Pitching for the New York Giants on August 1, 1903, McGinnity won the first game of a doubleheader against the Braves 4-1 and came back to win the second game 5-2. Just a week later (August 8), he repeated the feat, beating Brooklyn by scores of 6-1 and 4-3. Then, on August 31, he topped the Phillies 4-1 and 9-2.  McGinnity finished the season 31-20, 2.43 and recorded 246 wins, 142 losses and a 2.66 ERA in ten MLB seasons. The Hall of Famer led his league in wins five times, winning percentage twice and earned run average once. A workhorse, he also led the National League in games pitched six times.
TwoTwoTwo

PITCHERS WHO WORKED OVERTIME IN WINNING

TWO COMPLETE GAMES IN A DOUBLEHEADER

On July 12, 2017, Pud Galvin of the Buffalo Bisons threw a pair of complete games as Buffalo swept the Troy Trojans by scores of 4-3 and 5-4, with the second game going 12 innings – giving Galvin the high-water mark for most innings pitched in achieving complete games victories in both ends of a twin bill. Others to include an extra inning game in single-handedly completing a doubleheader sweep on the mound are:

  • Jack Stivetts, whose Boston Beaneaters – on September 5, 1892 – topped the Louisville Colonels 2-1 (11 innings) in Game One and 5-2 (nine innings) in Game Two;
  • Detroit Tigers’ hurler Ed Summers, who – on September 25, 1908 – topped the Philadelphia Athletics 10-5 in Game One and 1-0 in Game Two (ten innings). Summers, by the way, was in his rookie season and went 24-12, 1.64 on the year, with 301 innings pitched.

Put me in coach, I’m ready to play …

woodKnuckleballer Wilbur Wood is the last pitcher to start both ends of a twin bill – although that was not the original plan.

On July 20, 1973, Wood started the first game of a double header for the White Sox (against the Yankees).  He got off to a good start, whiffing Yankee lead-off hitter 2B Horace Clarke on a wicked knuckler. Unfortunately, the pitch also fooled catcher Ed Hermann and Clarke reached first on a passed ball – which proved the highlight of Wood’s game.  In order, he followed up with: a walk to RF Matty Alou; a two-run double to LF Ron White; a run-scoring single to CF Bobby Murcer; an RBI single to catcher Thurmon Munson; a run-scoring single to 3B Graig Nettles; and an early exit in an eventual 12-2 loss.

Given Wood’s short stint on the mound and the lack of stress placed on a knuckleballer’s arm, White Sox’ manager Chuck Tanner sent Wood back to the mound to start game two. The results were marginally better.  Wood lasted 4 1/3 innings, giving up seven hits and five runs, earning his second loss of the day as the Yankees triumphed 7-0.  Workhorse Wood, by the way, ended the 1973 season with 24 wins and 20 losses, the last American Leaguer to win and lose 20 games in the same season (Phil Niekro did it in the NL in 1979).

FEWEST STARTING PITCHERS IN A DOUBLEHEADER – TWO

When the Boston Braves and Philadelphia Phillies faced off in a double header on August 12, 1921, they collaborated to make MLB history – with both teams sending the same starting pitcher to the mound in both games for the only time ever.  George Smith was the Phillies’ double-starter, while Jack Scott did the honors for the Braves. Scott was the losing hurler in both games, while Smith tossed a 12-hit shutout to win Game Two.  (Both pitchers were knocked out of game one by the third inning, Scott taking the loss, Smith getting a no-decision.) Smith, by the way, was on course for a 4-20, 4.76 season, while Scott would finish the year 15-13, 3.70.  Both hurlers had career records under .500.

__________________________

LEAST LIKELY TO PICK UP TWO COMPLETE-GAME WINS IN A DAY

HIBELLThe last National Leaguer to earn a pair of complete-game wins in a single day was the St. Louis Cardinals’ Herman “Hi” Bell, who, on July 19, 1924, stymied the Boston Braves 6-1 and 2-1 – giving up just six hits over his 18 innings. Bell, a 26-year-old rookie, had just one career win and two complete games going into the doubleheader.  Further, he picked up only one more win and one more complete game the rest of the season – finishing at 3-8, 4.92. In eight MLB seasons, Bell went 32-34, 3.69 with 14 complete games in 47 starts.


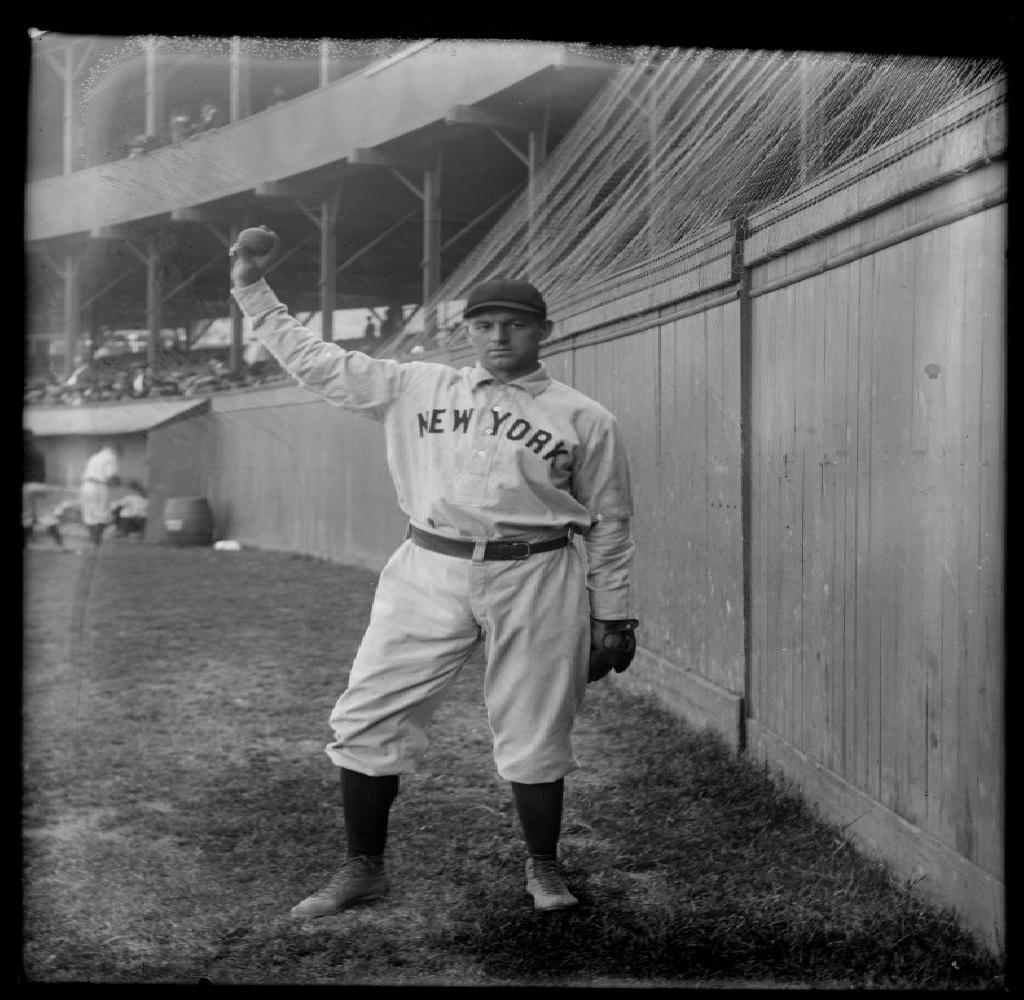
Hmmm?  The mystery of Babe Ruth’s Pitching Doubleheader

While Babe Ruth isn’t on the list of pitchers who picked up two complete-game victories in a day, he is on record as having once started both games of a twin bill on the mound – under somewhat mysterious circumstances.

It happened on July 11, 1916, when Ruth was on his way to a 23-12 record and league-low 1.74 earned run average for the Red Sox. Red Sox’ manager Bill Carrigan had Ruth on the mound to start the first game (against the White Sox). Ruth pitched to just one batter, and was then relieved by Rube Foster, who finished the 5-3 Boston win.

In the bottom of the first inning, Dave Danforth started on the mound for the White Sox.  Like Ruth, he pitched to just one batter before Chicago manager Clarence “Pants” Rowland brought in Jim Scott, who got knocked around for four runs in 2 2/3 innings. (The White Sox used six pitchers in the game.)  Two starting pitchers, each earmarked to face just one batter – who knows what kind of mind games the managers were playing?

Ruth then started the second game of the double dip, going the distance to top the White Sox 3-1 on a six-hitter.  White Sox second-game starter Mellie Wolfgang also went the distance in Game Two.


Primary Resources: Baseball-Reference.com; Baseball-Almanac.com. Society for American Baseball Research.

I tweet baseball @DavidBBRT

Follow/Like Baseball Roundtable’s Facebook page here.

Member:  Society for American Baseball Research; The Baseball Reliquary; The Negro Leagues Baseball Museum.

Putting the Ball in Play … MLB’s .300-hitting Teams

Fenway park photo

Photo by davidwilson1949

A team hitting .300 for the season … It hasn’t happened for 68 years, but it’s not as rare as you might think.  In fact, there have been 73  .300+-hitting teams – from the 1871 National Association Philadelphia Athletics, Boston Red Stockings and Troy Haymakers to the 1950 Boston Red Sox.  Let’s look at the 1950 Boston Squad, the most recent team to rake at a .300+ pace for a full season.  Note: You’ll find a full list of .300-hitting MLB team at the end of this post. 

The Red Sox’ .302 team average was 31-points above the overall American League average and 20-points above the Tigers and Yankees, who shared the second-best AL team batting average at .282.   If you take out the Red Sox’ numbers – the rest of the league hit just .266. It was not enough to bring the Red Sox the pennant, however.  That went to the Yankees (98-56).  Boston finished third, four games off the pace. Pitching was the culprit; the Red Sox led the AL in runs scored at 1,027 (the  Yankees were second at 914), but Boston finished sixth out of eight teams in earned run average (4.88).

The Red Sox offense was led by: Walt Dropo (.322-34-144); Vern Stephens (.295-30-144); Ted Williams (.317-28-97); and Bobby Doerr (.294-27-120).  But that .300 team batting average would not have been possible without Billy Goodman, who led the AL with a .354 average – and was the first (and still only) true utility (infield/outfield) player to win a batting crown.  Read Goodman’s story here.

1950 Red Sox

A few .300-hitting team tidbits:

  • Of the 73  .300-hitting teams, 40 hit that mark after 1900;
  • No team has had more .300-hitting seasons than the Pittsburgh Pirates – with seven;
  • The 1876 National League Champion Chicago White Stockings (Cubs) outhit the league average by the widest margin – 72 percentage points. The White Stocking hit .337, the league average (which includes Chicago) was .265 (without Chicago, the rest of the NL hit .254);
  • The National League has recorded the most .300+ seasons (38), followed by the American League (23), National Association (11) and American Association (1).

The highest team batting average ever recorded over a season belong to the 1894 National League Philadelphia Phillies at .350 – led by an all-.400 outfield (future Hall of Famers – Billy Hamilton, Sam Thompson and Ed Delahanty and super-reserve Tuck Turner, who outhit them all). You can read more on the Phillies all-.400 garden here.

The Phillies’ fourth-place finish should not come as a surprise – eight of the National Leagues’ 12-teams hit over .300 that season.

1894 Phillies

More .300-season tidbits:

  • Only twice has MLB seen a league average of .300+ for a season: the 1894 National League with the MLB all-time high of .309 and the 1930 National League at .303;
  • No decade saw more teams hit .300 or better for a season than the 1920s (1920-29), accounting for 26 (36 percent) of the 73 such campaigns in MLB history;
  • 1930 saw the most teams hit .300 or better at nine (of 16 MLB teams) – six in the NL and three in the AL; 1894 is second, with eight of 12 NL teams topping the .300 mark;
  • The National League Baltimore Orioles hold the record for the most consecutive .300+ seasons at five (1894-1898); the American League record is three, shared by the Detroit Tigers (1921-23) and Saint Louis Browns (1920-22); and the National Association record (five) belongs to the Boston Red Stockings (1871-75). Note: The Pittsburgh Pirates had four consecutive post-1900 seasons of .300+ (1927-30).

        .300+ Seasons (team batting) By Decade

                                    1870s … 12                       1900s … 0                         1930s … 13

                                    1880s … 1                          1910s … 0                         1940s … 0

                                    1890s … 20                       1920s … 26                      1950s … 1

                                                                             1960s forward … 0

__________________________________________

MLB TEAMS THAT HAVE HIT .300 FOR THE SEASON

                                                                   Avg.              Lg. Avg.

1950

Boston Red Sox (AL)                                 .302                   .271

1936

Cleveland Indians (AL)                               .304                   .289

New York Yankees (AL)                             .300

Detroit Tigers (AL)                                      .300

1934

Detroit Tigers (AL)                                      .300                    .287

1930

New York Giants (NL)                                 .319                   .303

Philadelphia Phillies (NL)                            .315

St. Louis Cardinals (NL)                              .314

Chicago Cubs (NL)                                     .309

Brooklyn Dodgers (NL)                               .304

Pittsburgh Pirates (NL)                                .303

New York Yankees (AL)                              .309                     .288

Cleveland Indians (AL)                               .304

Washington Senators (AL)                         .302

1929

Philadelphia Phillies (NL)                            .309                    .294

Chicago Cubs (NL)                                      .303

Pittsburgh Pirates (NL)                                .303

1928

Pittsburgh Pirates (NL)                               .309                     .281

1927

Pittsburgh Pirates (NL)                               .305                     .282

New York Yankees (AL)                              .307                     .286

Philadelphia Athletics (AL)                          .304

1925

Pittsburgh Pirates (NL)                                  .307                  .292

Philadelphia Athletics (AL)                            .307                  .292

Washington Senators (AL)                            .303

Detroit Tiigers (AL)                                        .302

1924

New York Giants (NL)                                    .300                  .283

1923

Cleveland Indians (AL)                                   .301                 .282

Detroit Tigers (AL)                                          .300

1922

Saint Louis Browns (AL)                                 .313                .285

Detroit Tigers (AL)                                          .306

Pittsburgh Pirates (NL)                                   .308                .292

New York Giants (NL)                                     .305

Saint Louis Cardinals (NL)                              .301

1921

Detroit Tigers (AL)                                           .316                .292

Cleveland Indians (AL)                                    .308

Saint Louis Browns (AL)                                  .304

New York Yankees (AL)                                   .300

Saint Louis Cardinals (NL)                               .308                .299

1920

Saint Louis Browns (AL)                                   .308                .284

Cleveland Indians (AL)                                     .303

1899

Philadelphia Phillies (NL)                                  .301               .282

1898

Baltimore Orioles (NL)                                       .302               .271

1897

Baltimore Orioles (NL)                                       .325               .292

Boston Braves (NL)                                           .319

1896

Baltimore Orioles (NL)                                       .328               .290

Cleveland Spiders (NL)                                     .301

Boston Beaneaters (NL)                                    .301

1895

Philadelphia Phillies (NL)                                  .330              .296

Baltimore Orioles (NL)                                       .324

Cleveland Spiders (NL)                                     .305

1894

Philadelphia Phillies (NL)                                    .350                .309

Baltimore Orioles (NL)                                        .343

Boston Beaneaters (NL)                                     .331

Chicago Colts (NL)                                             .313

Brooklyn Grooms(NL)                                         .312

Pittsburgh Pirates (NL)                                       .312

Cleveland Spiders (NL)                                       .303

New York Giants (NL)                                         .301

1893

Philadelphia Phillies (NL)                                   .301                   .280

Cleveland Spiders (NL)                                      .300

1887

Saint Louis Browns (American Assoc.)              .307                   .273

1876

Chicago White Stockings (NL)                            .337                   .265

1875

Boston Red Stockings (National Assoc.)             .321                   .254

1874

Boston Red Stockings (National Assoc.)             .312                   .273

1873

Boston Red Stockings (National Assoc.)             .340                   .290

Baltimore Canaries (National Assoc.)                 .316

Philadelphia Athletics (National Assoc.)              .301

1872

Philadelphia Athletics (National Assoc.)              .317                   .285

Boston Red Stockings (National Assoc.)             .317

Troy Haymakers (National Assoc.)                      .300

1871

Philadelphia Athletics (National Assoc.)              .320                   .287

Boston Red Stockings  (National Assoc.)             .310

Troy Haymakers   (National Assoc.)                    .308


Primary Resources: The ESPN Baseball Encyclopedia Fifth Edition; Gary Gillette/Pete Palmer; Sterling Publishing (2008) and Baseball-Reference.com.


I tweet baseball @DavidBBRT

Follow/Like Baseball Roundtable’s Facebook page here.

Member:  Society for American Baseball Research; The Baseball Reliquary; The Negro Leagues Baseball Museum.

Baseball Roundtable Unofficial Fan Ballot – Hall of Fame A Tough Sell

The 2018 Baseball Hall of Fame electees (via the traditional Baseball Writers Association of America ballot) have been announced – and four players were selected for 2018 induction by the BBWAA – Chipper Jones, Jim Thome, Vlad Guerrero and Trevor Hoffman.   It was just the sixth time in HOF history that the traditional balloting has produced at least four inductees (four in 1939, 1947, 1955, 2015 and five in 1936, the Hall’s inaugural year).  These four 2018 electees will join Modern Era Committee selections Jack Morris and Alan Trammell during the July 29 Induction Ceremony.  Baseball Roundtable congratulates all six worthy inductees.

FiveHOF

BBRT NOVEMBER PREDICTIONS – ON THE MARK

In early November, Baseball Roundtable made its 2018 BBWAA Balloting predictions – projecting the election of Chipper Jones, Jim Thome, Vlad Guerrero and Trevor Hoffman.  For a complete look at the 2018 ballot, BBRT’s November predictions and how BBRT would have voted (if I had a ballot), click here.

As regular readers may recall, Baseball Roundtable conducted an unofficial fan BB HOF ballot in November/December – inviting voters from among BBRT readers and a handful of Facebook groups dedicated to  fans of the national pastime.

SPOILER ALERT: 

Voters in the BBRT unofficial fan ballot gave the necessary 75 percent support to just two candidates – Chipper Jones and Jim Thome. Notably, players further down the ballot got more support in the fan vote (than in the official BBWAA balloting), while PED suspects got a bit less support in the fan ballot.

The order of finish in the BBRT fan balloting was remarkably similar to the BBWAA.  The same five players finished in the top five positions.  However, Guerrero, Hoffman and Martinez all got consisderably less support.

Although the order was mixed, nine players were included in the first ten spots on both ballots – and fourteen players appeared among the first fifteen vote-getters on both tallies. The most notable variation was Fred McGriff, who finished ninth on the fan ballot (37.9%), but 12th (23.2%) in the BBWAA voting.

Again, the most significant difference between the BBWAA and BBRT fan ballots is that only two players (Jones and Thome) reached the necessary 75 percent for election to the Hall in the fan ballot, as opposed to four in the BBWAA voting.  Looking at the ballots, that variation can be partially explained by fans belonging to the “Voting-from-the-Heart” Cadre (an explanation of the voting cadres BBRT identified appears later in this post). This group of voters appears to be swayed at least partially by a home-town bias or loyalty to a favorite player.  This  seems evidenced by the fact that the BBWAA voting saw six players not receiving a single vote, while only two were shutout in the BBRT fan balloting. (Fourteen players failed to reach five percent on the BBWAA ballot, while twelve failed to reach that threshold in the unofficial fan ballot.)

We’ll look at the results in more detail, but here are a few high-level observations:

  • A total of 271 fan ballots were cast – but ten were eliminated because they included votes for more than the allowed ten players (as many as 21 on one ballot). There were 422 BBWAA voters
  • The average number of players voted for per ballot on the fan ballot was 7.9.  BBWAA voters used an average of 8.5 of their ten allowed votes.
  • 50 percent of the BBWAA voters used all ten avaliable votes; compared to 43 percent in the BBRT balloting.
  • Only one player – Chpper Jones – was checked on 90 percent of the fan  ballots. Both Jones and Vlad Guerrero topped 90 percent on the official BBWAA voting.
  • In the BBRT fan balloting, only five players reached at least 50 percent, while nine reached that level in the BBWAA voting.

HOfChart

___________________________________________

Now, how about a look at what BBRT observed as “VOTER CADRES.”

The ballots and comments (form fans and BBWAA members( pointed to a half dozen voter “cadres” impacting BBRT fan balloting, most of which were also reflected in the BBWAA balloting.  This is not a judgement on voter strategies, but rather just an observation on factors that appear to be influencing voting patterns and vote totals.

The Anti-PED Cadre

This group declines to vote for PED users or (depending on the strength of their opposition) those under various levels of suspicion. There continues to be enough of these voters to effectively block a significant number of PED-associated candidates from election.  Yet, there still is enough support to keep them on the ballot, reducing the numbr of available votes for other candidates. (A bit of a Catch-22 here.)  This cadre made its presence felt in both the BBWAA and BBRT balloting.

A FEW FAN COMMENTS ON PEDs

Here are a few comments from the BBRT unofficial fan ballot that shed some light on the depth and impact of this issue.

“I know baseball turned a blind eye in the steriod era, but I didn’t. Hammering Hank is the true home run king.”  Luke … CA

“I voted the steroid users in because the HOF needs to have the conversation. The Mitchell Report showed that GM’s knew who was using … they were complicit. I was an A’s season ticketholder, they marketed Bash Brothers inflatable arms!”    Bill … CA

“The ten-vote limit isn’t working. Voters who support PED-users take votes away from non-users on the ballot – and those who oppose PED-users keep suspected violators from being elected. Both sides lose.” Bob …  MN

The Small-Hall Cadre

This cadre focuses on  demanding the highest standards for election to the Hall of Fame – and tends to vote for very few (or even zero) candidates.  This, by the way, is not a new approach. Back in 1988, for example, nine blank ballots were cast in the BBWAA voting. A Los Angeles Times article quoted New York Daily News reporter Phil Pepe (who sent in one of the nine blank ballots) as saying the Hall of Fame was “too crowded,” adding  “I think to go in alongside Ruth, DiMaggio, Williams, Aaron, Cy Young, you have to be the cream of the cream. The more you erode the standards, the more the standards will be eroded.” (1)  This cadre has a notable impact on elections, since each ballot a player is not named on requires three ballots to counter that omission.

The Ballot-Hierarchy Cadre

Member of this cadre most often draw a line between first-ballot and subsequent-ballot votes, demanding far more to secure first-ballot entry. It is part of the reason that we have never seen a unanimous selection.  But the impact of the balloting does, in some cases, go further. In a column (after turning in a blank ballot in 2013), ESPN’s Howard Bryant wrote: “I believe in the hierarchy of the ballot, that the first ballot is different than the second or the tenth, that there is a special prestige to a player being voted in the first time he is eligible.” (2)   The question is,  “Do voters just withhold that first-, second- or other-ballot vote, or does it go to another candidate who meets the hierarchy test?”  There also appears to be a group of voters who combine “Ballot-Hierarchy” with “Anti-PED,” withholding votes from PED suspects until later years of eligibility.

The Strategist Cadre

Somewhat related to the “Ballot Hierarchy” group – at least in impact – this group reasons that certain players are sure bets to get the required 75 percent (like Chipper Jones this year) and chooses not to add to the sure-thing margin, but rather cast that vote for a player they find deserving further down the ballot.  This approach may actually improve the chances of additional electees (while also continuing to ensure we don’t see a unanimous selection). A subset of this group are those who note that certain players (in, for example, the 40 percent range), while NOT likely to reach 75 percent in a given year, ARE pretty much assured of adequate support to stay on the ballot. This subset witholds votes from those candidates and votes to protects those the would like to see on the ballot (but who are less “safe”).

The From-the-Heart Cadre

This group (which seemed to show up in the BBRT unofficial fan ballot) casts votes for a specific player (or players) further “down the board” either as a “fan” statement or to ensure that player does not fall off the ballot (get less than five percent).  This strategy may cost deserving candidates votes and delay/preclude their election. A Minnesota fan voting in the unofficial BBRT balloting, commented “I was a little concerned about Johan Santana, so I looked for some players I would support who seemed safe for a return and dropped one of those votes to Santana.”  Simiilarly, BBWAA voter Minnesota StarTribune sportswriter Patrick Ruesse indicated he voted for “Scott Rolen and Johan Santana to keep them on the ballot.” (5)

The Ten-Best Cadre

This group simply votes for whom they felt are the ten best players; regardless of the factors influencing any of the cadres already noted.  (Well, in some cases it is the eight or nine candidates they feel are deserving.) A few provided comments on who they would have added if they had one, two or three more votes. New York Post Sportswriter Ken Davidoff, who used all ten of his allotted votes, indicated he would have “included as many as five more” had he been allowed. (3)    CBS sportswriter Matt Snyder put it this way in a January 11 article, “I definitely want more than ten players from this ballot to make the Hall of Fame, but it feels wrong to game the ballot. My stance is to just vote for who I believe are the ten best candidates and let the chips fall where they may.” (4)

THE RULE

Voting shall be based on the player’s record, playing ability, integrity, sportsmanship, character and contributions to the team(s) the on which the player played. 

Footnotes:

(1) Blank Hall of Fame ballot serves as protest … January 14, 1988; Associated Press

(2) Drawing a blank on a HOF ballot … January 9, 2013; Howard Bryant, ESPN Senior Writer; espn.com

(3) My crowded Hall of Fame ballot, with no regard for the ‘sacred place’ … January 20, 2018; Ken Davidoff; New York Post (nypost.com)

(4) Hall of Fame Roundtable: Should voters ‘game” the ballot to get more players in? … January 22, 2018; Matt Snyder; cbssports.com

(5) It’s a Hall voter’s prerogative to change mind … January 25, 2018; Patrick Reusse; StarTribune

A COUPLE OF BOBBLEHEADS SOON TO BE ON THE WAY

hofbhBaseball Roundtable conducted a random drawing from among those voting in the unofficial Hall of Fame fan ballot – and a follower from Georgia was selected to receive a pair of bobbleheads (Jack Morris and Bernie Williams).  They will be shipped out as soon as I hear back with shipping info. (If you are a Baseball Roundtable FB follower and are from Georgia, check your FB messages – it might be you.)


I tweet baseball @DavidBBRT

Follow/Like the Baseball Roundtable Facebook Page here.

Member:  The Society for American Baseball Research; the Baseball Reliquary; The Negro Leagues Baseball Museum.


BBRT ‘s Top College Baseball Player – All Time

THE BEST NCAA BASEBALL SINGLE-GAME PERFORMANCE EVER

It was May 9, 1999 and the Florida State Seminoles’ baseball squad was facing the University of Maryland Terrapins at Shipley Field, College Park, Maryland.  The sun was shining, the wind was blowing in and college hardball history was about to be made.

Playing second base for the Seminoles that day was 6’1”/200-pound, right-handed hitting Marshall McDougall – who was in his first season at Florida State after playing two seasons for Santa Fe Community College.  McDougall’s day started off innocently enough with a first-inning single- but things were about to change.  As the Seminoles charged off to a 26-2 win, McDougall’s day looked like this:

1st Inning – Single

2nd Inning – Solo home run

4th Inning – Three-run homer

6th Inning – Two-run long ball

8th Inning – Grand Slam

9th Inning – Three-run home run

That’s right, seven-for-seven with six home runs in a Division 1 contest.  In the process, McDougall set (and still holds) the NCAA records for home runs in a game (6); consecutive home runs (6); RBI in a game (16); and total bases in a game (25).  He also achieved a rare “home run cycle” (solo, two-run, three-run and Grand Slam HR in a game).  Side note: Only one HR Cycle has been achieved at the professional level – by Tyrone Horne.  For that story, click here.

McDougall finished the 1999 NCAA season with a .419 average, 28 home runs,  NCAA season-leading totals of 106 RBI and 104 runs, and 22 steals in 25 attempts (all in 71 games) – earning All American and Atlantic Coast Conference Player of the Year honors.   He followed that up with a .346-15-67 campaign in 2000.

McDougall was drafted by the Oakland A’s in the ninth round of the 2000 MLB draft. He played professionally from 2000-2012, and appeared in 18 games for the Texas Rangers in 2005 – collecting a double and two singles in 18 MLB at bats.  

I started this post with the Marshall McDougall story because today’s focus will be on Baseball Roundtable’s selection for the  top three college baseball players of all time.  Clearly, there is plenty of  room for debate – “all time,” after all, covers a lot of ground and leaves ample space for discussion. Still,  I think I’ve picked a trio of pretty darn good ones.  I’m also including side note on a couple of additional college players who were in the running.

  1. Pete Incaviglia – Oklahoma State  University – 1983-84-85

InkyIn 1985, Pete Incaviglia had what may be the best offensive season in Division 1 history, In 75 games, he hit .464, cranked 48 home runs, drove in 143 and even tossed in 14 stolen bases in 16 attempts.  In the process, he set several single-season NCAA Division 1 records that still stand: home runs (48); RBI (143); total bases (285); and slugging percentage (1.140).  It was the final season of a three-campaign college career that saw “Inky” play 215 games, hit .397, bash a Division 1 career record 100 home runs and drive in 324.

Picking the 6’ 1”, 230-pound outfielder/DH at number-one was not a difficult task.  In 1999, Incaviglia – a two-time first-team All-American and member of the College Baseball Hall of Fame –  was named the Baseball America Player of the Century.  Who knows, he might also have been the High School Baseball Player of the Century as well.  He was a three-time High School Player of the Year in California.

Incaviglia was selected in the first round of the 1985 MLB draft by the Montreal Expos, who traded him to the Texas Rangers (reportedly because Incaviglia wanted to jump directly to the major leagues). On Opening Day of the 1986 season (April 8), Incaviglia successfully completed the leap from college campus to major league stadium – starting in right field and batting cleanup for the Rangers in a 6-3 home win over the Blue Jays. He went on to play 153 games in his rookie season, hitting .250, with 30 home runs (his only 30-HR MLB season) and 88 RBI. In a 12-season MLB career, he hit .246, with 206 round trippers and 655 RBI.

JOHN OLERUD – A COLLEGE BABE RUTH?

John Olerud was one of the finalists as I pared my list down to three – largely because of his 1988 season for Washington State – when the 6’5” first baseman/pitcher dominated on the hill and in the batter’s box.  As a hitter, Olerud went .464-23-81 that season.  On the mound he was 15-0 with a 2.49 era.  That performance makes him the only college player to hit 20 home runs and record 15 pitching victories in the same season.  For his college career, Olerud went .434-33-131 in the batter’s box, and 26-4, 3.17 as a pitcher. He went on to a 17-season MLB career, during which he won a batting title (.363 for the Blue Jays in 1993), was a two-time All Star and three-time Gold Glover. He retired with a .294 MLB average, 255 home runs and 1,230 RBI.

2. Derek Tatsuno – University of Hawaii – 1977-78-79

TatsA 5’10”, 175-pound southpaw hurler, Derek Tatsuno was the first college pitcher to achieve 20 victories in a single season. (There has been just one 20-win season since – by Mike Loynd 20-3 for Florida State in 1985.)  Tatsuno did it in 1979, when he went 20-1 (in 22 starts), with a 1.86 earned run average and an NCAA single-season strikeout record of 234 (in 174 1/3 innings pitched).

For his college career, Tassuno went 40-6, with a 2.04 earned run average and 541 strikeouts in 402 1/3 innings. He led NCAA Division 1 pitchers in strikeouts in each of his three college seasons.  The two-time All American was elected to the College Baseball Hall of Fame in 2007.

Tatsuno’s college mound success was not really a surprise to those who knew him.  He went 27-1 as a high school pitcher – his only loss being a 1-0, 11-inning heartbreaker.

Tatsuno was drafted by the Padres in the second round of the 1979 MLB draft (with a $100,000 offer), but got a better offer to pitch in the Japanese amateur leagues. He continued to be drafted by MLB clubs and  and finally signed the sixth time he was drafted – when the Brewers selected him 25th overall in the January 1982 draft. Tatsuno never played in the major leagues. In four minor league seasons, he went 20-16, with a 4.59 earned run average. Note:  The card pictured is from hit timeeith the minor league Hawaii Islanders.

ROBIN VENTURA – MAKE ROOM JOE DIMAGGIO

The fight for the third spot on my list was a tough one – between the eventual winner (Rickie Weeks, discussed next) and 16-season MLB 3B/1B Robin Ventura. Ventura, who played Division 1 ball for Oklahoma State University for three seasons (1986-88) – hit .428 for his college career. He never hit under .391 for a season, never hit fewer than 21 home runs (68 over three seasons) and drove in 95 or more runs in each campaign.   In addition, in 1987, Ventura achieved what is still the NCAA’s longest hitting streak – 58 games.  Ventura was a three-time All American and winner of both the Dick Howser Trophy and Golden Spikes Award. He was elected to the College Baseball Hall of Fame in 2006.

3. Rickie Weeks – Southern University – 2001-2003

weeksI am putting Southern University second baseman Rickie Weeks at number-three on my All Time College Baseball Players list. Weeks played for Southern University in 2001-02-03. Over his three-season career, he hit at an NCAA Division 1 career record .465 pace (minimum 200 at bats), with 50 home runs, 233 RBI, 245 runs scored – and a remarkable 65 stolen bases in 66 attempts.  He won consecutive Division 1 batting titles (2002-2003), with averages of .495 and .479 and finished his college career with an NCAA Division 1 record .927 slugging percentage. Weeks was a two-time All American and winner of both the Golden Spikes Award and Dick Howser Award.

Weeks was selected second overall (by the Brewers) in the 2003 MLB draft – and made his MLB debut in September of 2003.  Still active in 2017, after 14-MLB campaigns, Weeks has a .246 MLB average, with 161 home runs, 474 RBI, 733 runs scored and 132 stolen bases His best MLB season was 2010, when he hit .269, with 29 home runs, 83 RBI and 112 runs scored.

I tweet baseball @DavidBBRT

Follow/like Baseball Roundtable’s Facebook page here.

Member:  Society for American Baseball Research; the Baseball Reliquary; The Negro Leagues Baseball Museum

Billy Goodman – No Position? No Problem!

goodmanThroughout most of his MLB career, Billy Goodman was a player without a position.  In 1950, for example, Goodman (with the Red Sox) played 45 games in left field, 27 at third base, 21 at first base, five at second base and one at shortstop (12 as a pinch hitter). Okay, a good utility man is not that unusual.  In 1950, however, Goodman became the first (and still only) true utility player to capture a league batting title. Goodman played in 110 games and raked at a .354 pace (150 hits, 91 runs scored, four home runs, 68 RBI – second place in the AL MVP voting).  It didn’t seem to matter where he played or where in the lineup he batted, Goodman just continued to hit. In fact, if you exclude positions on defense or in the lineup in which he played just one game, 1950 saw him hit .300 or better wherever he played and wherever he batted.

GoodChartABilly Goodman set the stage for his major league utility role early in life – reportedly playing all nine positions over the course of his high school career.  (Note: I prefer to call it his MLB versatility role.) His versatility as an athlete went beyond the baseball field, as he was also top player on his high school basketball and football squads.

Billy Goodman averaged a nice, round .300 over a 16-season MLB career.

Once he began his professional career, there was little double that Goodman was going to hit for average. In 1944, as an 18-year-old – playing at High A for the Atlanta Crackers of the Southern Association, the 5’11’, 165-pound (he wasn’t going to be a power hitter) Goodman got into 137 games and hit a healthy .336 (the league batting average was .279). After a year off for military service, Goodman was back at Atlanta (now Double A) hitting .389 in 86 games.

Then, in 1947, he started slowly (as a part-timer with the Red Sox), before going down to Triple A Louisville, where he hit .340 in 89 games. He was back in Boston, full-time, in 1948 – where he eventually took over the first base position and hit .310 as a rookie.  Despite his steady bat, Goodman seem to be constantly challenged for playing time (usually by hitters with more power), but thanks to his versatility, he also seemed to consistently “work” his way into the lineup. One thing was for sure, with Goodman around the Red Sox had little to worry about when it came to slumps or injuries – they could just slot Goodman into the position of need and count on him to handle the glove and bat with high professional skill.

In his 16-season MLB career, Goodman played for the Red Sox (1947-57). Orioles (1957), White Sox (1958-61) and Astros (1962).  He appeared in 623 games at second base, 407 at first base, 330 at third base, 69 in left field, 42 in right field, seven at shortstop and 227 times as a pinch hitter. He hit over .300 five times and over .290 eleven times (ten times in the eleven seasons in which he played at least 100 games). He was a two-time All Star. His final line was 1,623 games played, 1,691 hits (.300 average), 807 runs scored, 591 RBI, 19 home runs and 37 stolen bases.

GodochartB

Following his 1962 season with the Astros, Goodman served as player-manager of the Class A Durham Bulls – where (in 1963-64) he managed/co-managed the team to second- and fifth-place finishes, while playing in 114 games and hitting .345.  After that he held a number of scouting, instructional and minor league managing roles (until retirement from baseball in 1977).  He passed away in 1984 (cancer) –  at the age of 58.

Primary Resources:  Society for American Baseball Research; Baseball-Refeence.com


I tweet baseball @DavidBBRT

Follow/Like the Baseball Roundtable Facebook page here.

Member: Society for American Baseball Research; The Baseball Reliquary; The Negro Leagues Baseball Museum.

Ballpark Tours for 2018 – Get On Board for Baseball Adventure

BPTLOGOBallpark Tours (BPT) based out of Saint Paul, Minnesota, has been offering baseball fans busloads of hardball fun since 1982.  The tour group, which grew out of the “Save the Met” (outdoor stadium) organization, has taken groups of fans on baseball “treks” of three-to-ten days, ranging as far north as Duluth, as far south as Chattanooga, as far west as Colorado,  as far east as New York City – and simply “as far away” as Cuba. More details later in this  post, but for 2018,  BRT is offering a pair excursions:


  • A six-day trip (June 28-July 2) that includes a trio of games at Chicago’s Wrigley Field, as well as minor league tilts in Davenport, Iowa and Geneva, Illinois.
  • A ten-day trip that includes three games at Denver’s Coors Field, two games at Kansas City’s Kauffman Stadium and a pair of minor league contests in Omaha, Nebraska.

DenverA Ballpark Tours trip (I’ve been on 29 of them) is the perfect way to enjoy the national pastime – good times with good friends (old and new) who share a passion for baseball, fun and adventure.  Note:  this is an unsolicited endorsement. As Baseball Roundtable has noted in the past “Once you get on the Ballpark Tours bus, every mile is a memory.”   You also get a chance to create new memories inside and outside the ballpark – great baseball and, as always, Ballpark Tours stays in equally great downtown hotels – close to the action and attractions – and schedules time to enjoy the  local food, arts and entertainment.  To get the flavor of a BPT trek, you can browse reports from past trips by clicking here.

Now, here’s a brief rundown of the 2018 Ballpark Tours offerings, for more info and sign-up, click – link.

ROCKY MOUNTAIN HIGH REDUX – AUGUST 3-12.

Coors field photo

Photo by Max and Dee

My personal choice … seven games in three cities in ten days – and the opportunity to enjoy plenty of blues, brews and baseball with a typical Ballpark Tours crew.  I was on the original Denver BPT trek and, let me assure you, Coors Field and downtown Denver are well worth the trip.  (Lower Downtown is 28 square blocks of restaurants, clubs, bars and brew pubs.) And, you’ll get to see the Pirates and Rockies in the launching pad that is Coors Field. Free-time in Denver? Choose from among the likes of the Denver Botanic Gardens, Denver Art Museum, as well as – more to my taste – a variety of brewery and distillery tours.

Satchel Paige pitches to Martin Dihigo, with Josh Gibson catching - on the Field of Legends at the Negro Leagues Baseball Museum.

Satchel Paige pitches to Martin Dihigo, with Josh Gibson catching – on the Field of Legends at the Negro Leagues Baseball Museum.

In Kansas City, there is the Cards/Royals I-70 rivalry. And, what’s your free-time pleasure?  The Negro Leagues Baseball Museum is a must-see if you haven’t already been there – and there’s a great blues and barbeque place practically across the street.  In addition, you can choose from among the likes of the Nelson-Atkins Museum of Art, the Arabia Steamboat Museum or the Airline History Museum. More sedentary?  How about the Boulevard Brewing Company?  More adventurous?  Kansas City has the Swope Park Zip Line and (this is not a misprint) indoor sky-diving.

And, of course, there is Omaha – featuring the Salt Lake Bees and Omaha Storm Chasers.  From my last BPT trip to Omaha, I fondly remember the foods, fun and shopping in the Old Market area. (Spent a great deal of time, a bit of change, there.)

Time to explore all this? Four nights in Denver, three in Kansas City and two in Omaha.

All in all, a great trip.  A chance to create some unique memories that stretch from the bus to the ballpark and from the Negro Leagues Baseball Museum to Omaha’s Old Market.  And, I understand, the tour master is exploring the opportunities for some adventures as we cross Nebraska.

I am not gonna miss this one.

___________________________________________________

WINDY CITY HIATUS … BLEACHER BUMS XXXVI … JUNE 28 – JULY 2

The Kane County Cougars and Quad City Bandits, as well as three Twins/Cubs tilts in Wrigley Field – AND four nights at Chicago’s fabulous Palmer House Hilton.

bWrigleyThis a bit like the Cadillac – or probably Tesla – of baseball tours. Great baseball wrapped up in a package that includes: Wrigleyville; Chicago’s diverse opportunities for dining; the chance to take in lots of live music (with an emphasis on blues), comedy and theater; museums ranging from The Art Institute of Chicago to the Shedd Aquarium to the Museum of Science and Industry (my personal favorite).  Plus, of course, the usual BPT comradery and hoopla.  Do the Windy City and Twins/Cubs baseball in style!


Again here’s a link to your opportunity (to sign up) for a great baseball excursion – click here. 

More photos from past trips:

5 ballpark7bbq8singbptprogfild

5 scoreboard

MLB’s all-.400 Outfield – Best-hitting Garden Ever?

256px-1894_Philadelphia_Phillies

MLB has seen a total of 20 players put up a total of 28 (qualifying) .400+ batting average seasons – none, of course, since Ted Williams .406 in 1941. Fifteen of those 28 .400+ campaigns took place before 1900.  Even given the fact that slightly more than half of the .400+ seasons took place before 1900, the chance that four players on any one team would top the .400 mark in the same season seems unlikely. But that is exactly what happened in 1894, when the Phillies had an “all Hall of Fame” regular outfield, who all hit over .400 – LF Ed Delahanty (.405); CF Billy Hamilton (.403); RF Sam Thompson (.415).

What is somewhat surprising is that none of these .400-hitting regular Philadelphia fly-chasers led the National League – or even the Phillies – in batting average.


There were, in fact, a single-season MLB-record five qualifying .400 hitters in 1894.  Leading the National League, with an all-time MLB-record .440 average, was Boston Beaneaters’ center fielder Hugh Duffy (another future Hall of Famer). Second in the league was Phillies’ fourth/reserve outfielder Tuck Turner, who (in his second MLB season) played in 82 of the Phillies 132 games and hit .418. The third, fourth and fifth highest averages went to the Phillies mentioned aboce – Thompson, Delahanty and Hamilton.

The 1894 Phillies set a still-standing MLB record by hitting .350 as a team – 41 points above the NL team average (that season, eight of the 12 NL teams hit above .300).  Regardless of those offensive stats, the Phillies were – and remain – the only team ever to have four .400 hitters in a single season.  That season, Philadelphia’s four outfielders collected 757 hits (for a .409 combined average), had a combined .485 on base percentage, scored 555 runs, drove in 456 and stole 160 bases. Again, all in just 132 games.  They included the NL leaders in RBI (Thompson, 149), runs scored (Hamilton, 198), slugging percentage (Thompson, .696), on-base percentage (Hamilton, .521), walks (Hamilton, 128) and stolen bases (Hamilton, 100). Oh yes, the Phillies finished fourth, at 71-57 (with four games designated as no-decision), 18 games behind Baltimore.

Here are the players in the Phillies’ 1884 outfield.

Left Field – Ed Delahanty – Hall of Fame, 1945

DelehantyThe 6’1”/170-pound right-handed hitter – whose size earned him the nickname “Big Ed” –  was 26-years-old and in his seventh MLB season (six in the NL, one in the Players League) in 1894.  That season, he hit .405, collecting 200 hits, scoring 148 runs and driving in 133 (in 132 games). Delahanty hit four home runs and stole 22 bases that season.

Delahanty hit .346 over a 16-season MLB career (1888-1903), leading the league in hits once, doubles five times, triples once, home runs twice, RBI three times, total bases twice and stolen bases once. He is one of only three players to hit .400+ in three seasons (the others are Ty Cobb and Rogers Hornsby).  Delahanty was also known as a fleet outfield with a strong arm – an all-around player.

His .346 career average if the fifth highest in MLB history and he is also one of only 18 players to hit four home runs in a game. Ed was one of four Delahanty brothers to play in the major leagues – Ed (1888-1903); Frank (1905-09, 1914-15); Jim (1901-02, 1904-12, 1914-15); Joe (1907-09); Tom (1894, 1896-97).

ED DELAHANTY’S MYSTERIOUS DEMISE

Ed Delahanty died – at the age of 35 – during the 1903 baseball season. Delahanty was with the Washington Senators at the time – and had been caught in an AL/NL contact dispute. (Delahanty had signed contracts with both the AL Washington Senators and the NL New York Giants.)  On July 2, the Senators had lost a 1-0 game to the Tigers in Detroit, dropping to 16-43 on the season.  It was the final game of the Detroit series and the team was set to board a train for Washington D.C. and a 21-game homestand. An apparently disgruntled (or despondent) Delahanty jumped the team and boarded a train headed from Detroit to New York City (a train crossed through Canada on the trip) – mysteriously leaving his belongings in his Detroit hotel.

On the journey to New York, Delahanty, who was known to have issues with alcohol, became increasing disruptive and was put off the train at Bridgeburg, Ontario (now Fort Erie) – near the International Bridge over the Niagara River.  Delahanty decided to cross the International Bridge on foot and, while on the bridge, was confronted by a night watchman.   Exactly how it happened is not clear, but Delahanty apparently escaped the watchman’s grasp and ended up in the Niagara River. His body was found about a week later 20 miles downstream, below the Horseshoe Falls (the Canadian portion of Niagara Falls.) It was never determined whether Delahanty was pushed, fell or jumped to his death.

At the time, Delahanty – the 1902 AL batting champ – was hitting .333, but had played in just 42 of the Senators 59 games.

Center Field – Billy Hamilton – Hall of Fame, 1961

HamiltonThe center fielder in the Phillies’ all-.400 outfield was 5’6”/165-pound speedster Billy Hamilton – whose daring on the base paths earned him the nickname “Sliding Billy.”  The 28-year-old was in his seventh major league season and had already led his league (American Association and National League) in stolen bases three times, in addition to having the 1891 batting title under his belt. In 1894, in 132 games played, the left-handed hitter hit .403 and collected 225 hits – while also leading the NL in runs scored (an MLB all-time high of 198), walks, (128), stolen bases (100) and on-base percentage (.521).

Side note: In baseball’s early days, stolen bases were not awarded in the same way as post-1900. At times, players were credited with a stolen base for moving up a base on a fly out, advancing more than one base on a hit and advancing on an error. Under those rules, stolen bases were considerably more prevalent.  Still, Hamilton’s base-running was renowned and he did lead his league in stolen bases, under the rules of the day, five times.

Hamilton played 14 major league seasons, putting up a .344 lifetime average (tied with Ted William for seventh-best all time) and capturing a pair of batting titles. Hamilton was also an on-base percentage machine.  He led the league in walks five times (four consecutively from 1894-97) and in on-base percentage five time.  His career on-base percentage of .455 is the fourth-highest all time (behind Ted Williams, Babe Ruth and John McGraw). In addition, Hamilton led his league in runs scored four time and hits once.  He finished his 14-campaign MLB career with 1,697 runs scored in 1,594 games.  He also tallied 2,164 hits, 95 triples and 914 stolen bases (although various sources credit him with 912 or 937 steals).  His total bases rank third all time.

A GOOD START A (POSSIBLY) EVEN BETTER FINISH

Billy Hamilton is one of only six major leaguers – and the first ever – to open a game with a lead-off homer and end it with a walk off round tripper. He did it on May 17, 1893, as the Phillies topped the Senators 11-9 in ten innings.  Others to accomplish this feat are: Vic Power (Kansas City A’s – May 7, 1957); Darin Erstad (Anaheim Angels – June 25, 2000); Reed Johnson (Toronto Blue Jays – June 15, 2003); Ian Kinsler (Texas Rangers – June 19, 2009); Chris Young (Arizona Diamondbacks – August 7, 2010).

Right Field – Sam Thompson – Hall of Fame, 1974

ThompsonRight field on the 1994 Phillies was held down by another big man (for his time), 6’2”/207-pound left-handed hitting Sam Thompson. Thompson, who played in 15 MLB seasons and put up a .331 career average, had his best campaign in 1894, hitting .415, with 13 home runs and a league-leading 149 RBI in just 102 games. He came into the 1894 season already holding one batting title, one home run crown, one RBI crown and having led the league in hits twice. As with Big Ed Delahanty, Thompson’s size and power earned him the moniker “Big Sam.”  He was also known as a solid fielder with a rifle arm – and is still ranked number-12 all-time in outfield assists.

In his career, Thompson led the league in hits three times, doubles twice, triples once, home runs twice, RBI three times and batting average once,. He finished with a .331 average, 1,308 RBI, 1,261 runs scored, 126 home runs and 232 stolen bases (in 1,410 games).

20/20 VISION

Sam Thompson was the first player to reach 20 home runs and 20 stolen bases in the same season.

Outfield Reserve – Tuck Turner

TurnerLittle (5’6”/155-pound) switch-hitting George “Tuck” Turner was the surprise of the Phillies’ all-.400 outfield in 1894.  The 27-year-old was in just his second MLB season (he hit .323 in 36 games for the Philies in 1893) and played 82 games (56 in LF, 22 in RF, three in CF and one on the mound). In those 82 games, Turner hit .418 (second in the NL and highest on the Phillies), collected 145 hits, scored 95 runs and drove in 84,  Turner followed that up with a .386 average (59 games) in 1895 – giving him a .388 average over his first three MLB campaigns. Turner played three more MLB seasons, but hit only .260 (202 games) – and left the majors after the 1898 season with a .320 career average. (According to news reports at the time, Tucker was plagued with bouts of malaria during those final three seasons.)

THE OLD SWITCHEROO

Tuck Turner’s .418 average in 1894 is the highest MLB season average ever for a switch hitter.

Primary resources:  Society for American Baseball Research; Baseball-Reference.com; Baseball-Almanac.com; MLB.com

I tweet baseball @DavidBBRT

Follow/like Baseball Roundtable’s Facebook page here.

Member: Society for American Baseball Research; The Baseball Reliquary; The Negro Leagues Baseball Museum.

Cyclone, Boomer, Big Unit, King Felix and more … All About Those 23 Perfect Games

Cy Young, appropriately, pitched the first perfect game at the modern 60'6" pitching distance.

Cy Young, appropriately, pitched the first “perfecto” at the modern 60’6″ pitching distance.

Sometimes, when you are looking for one bit of informatiom, it opens a path to a treasure trove.  For example, I was examining the scores of MLB’s 23 officially recognized perfect (27 up/27 down) games.  I found that the most popular score of a perfect game is 1-0, with seven of the 23 perfect outings (30.4 percent) resulting in a 1-0 final score That’s not totally unexpected, but – as I examined MLB’s perfect pitching performances – I learned even more.  I was surprised to find out that in six of those seven 1-0 outcomes, that sole run scored by the winning squad was “unearned.”  At any rate, looking into those 1-0 outcomes led me to keep digging into the history of perfect games – and I’d like to share a few facts I found of interest as I looked into “the best” work of players known by such names as Boomer (Wells), Big Unit (Johnson), Catfish (Hunter), Gambler (Rogers), King Felix (Hernandez), El Presidente (Martinez), Doc (Halladay) and more.


  • 16 perfect games were pitched in the winning pitcher’s home park, only seven on the road. (Side note: When the Providence Grays’ John Montgomery Ward totally white-washed the Buffalo Bisons in Providence on June 17, 1880, Buffalo was the”home” team – at the time home team designation was determined by a coin toss.)
  • Fifteen perfect games belong to right-handers, eight to southpaws.
  • Fourteen AL hurlers and nine NL pitchers have fashioned “perfectos.”

FORESHADOWING?

Cy Young, who would toss a perfect game for Boston in 1904, pitched for the 1899 National League Saint Louis team known as the “Perfectos.”  They would become the Cardinals in 1900.

  • Twelve perfect games have occurred in American League games, nine in National League contests, one in an interleague tilt and one in the World Series.
  • David Cone of the Yankees threw the only perfect game in an interleague contest (through 2017), when he stopped the Expos 6-0 on July 18, 1999 at Yankee Stadium.
  • The largest crowd to witness a perfect game was for Don Larsen’s Yankee Stadium 1956 World Series’ performance against the Big Apple rival Dodgers – 65,519.  The smallest crowd was an estimated 1,800 for John Montgomery Ward’s June 17, 1880, 5-0 win for Providence over Buffalo.
  • The youngest pitcher to toss a perfect game was 20-year-old Providence righty John Ward (1880); the oldest was 40-year-old Diamondbacks’ southpaw Randy Johnson (2004).

A BIT OF BALANCE

There are those who question the validity of the two 1880 perfect games – Lee Richmond’s very first MLB perfect outing on June 12 and John Montgomery Wards’ just five days later.  The rules were different then – 45-foot pitching distance and eight balls to draw a walk.  However, that is balanced by the fact that pitchers couldn’t bring their arms above the shoulder in the windup and fielders were primarily gloveless. Consider that, in 1880, there were an average of 8.9 errors per game (both teams combined) and that of the 3,191 runs scored that season, 1,591  (49.9 percent) were unearned. Under those conditions, a perfect game was still quite the accomplishment.

  • Only two players under six-feet tall have pitched perfect games and they were the first two to accomplish it: Worcester’s Lee Richmond (5’10”) and Providence’s John Ward (5’9”).
  • The tallest player to pitch a perfect game was 6’ 10” Randy Johnson of the Diamondbacks, the heaviest 6’2”, 240-pound Mark Buehrle of the White Sox

GOOD TIMING

dAVID cONE BASEBALL photo

Photo by clare_and_ben

Yankee righty David Cone pitched a perfect game against the Expos on July 18, 1999 (a 6-0 New York win). To make it even more “perfect,” it was Yogi Berra Day and the ceremonial first pitch was thrown out by former Yankee Don Larsen – author of the only World Series perfect game.


  • The fewest pitches tossed in a perfect outing was 74 – by Addie Joss in his October 2, 1908 perfect outing, as he led his Cleveland Naps over the White Sox by a score of 1-0. As you might expect, his three strikeouts that day are also the fewest K’s in a perfect game.
  • The most pitches in a perfect game were the 125 thrown by Matt Cain as his Giants topped the Astros 10-0 in San Francisco. That ten runs is the most ever scored in support of a perfect game on the mound.
  • The most strikeouts recorded in a perfect outing are 14 – Dodgers’ Sandy Koufax (September 9, 1965 versus the Cubs) and Giants’ Matt Cain (June 13, 2012 versus the Astros).

HE’LL DO IN A PINCH

aDDIE jOSS photo

Photo by guano

The Cleveland Naps’ Addie Joss had to retire three ninth-inning pinch-hitters to complete his October 2, 1908 perfect outing against the White Sox – Doc White (for Al Shaw), who grounded out short to first; Jiggs Donahue (for Lee Tannehil), who fanned swinging; and John Anderson (for Ed Walsh), who grounded out to third. The only other pitcher to face three pinch hitters in the course of a perfect game was the Phillies’ Jim Bunning. In his June 21, 1964 perfecto against the Mets, he faced one pinch batter in the sixth and two in the ninth. (The final two outs of the game saw Bunning facing pinch hitters George Altman and John Stephenson – who both struck out swinging.)


  • The quickest perfect game took place on May 5, 1904, as Cy Young and his Boston Americans topped the Philadelphia Athletics 3-0 (in Boston) in a reported 85 minutes. (Some reports list the game at 83 minutes, either way it is the quickest.)
  • The longest perfect game took two hours and forty minutes, as David Wells and the Yankees bested the Twins 4-0 in New York.

TWO GREAT PLAYS TO SAVE TWO GREAT GAMES

Here is BBRT’s take on the two top perfect game-saving plays.

In Lee Richmond’s MLB first-ever perfect game (1880) for Worcester, the Buffalo Bisons’ slow afoot first baseman Bill Phillips appeared to break up the perfecto in the top of the fifth with a hard liner that found the grass in right field.  Worcester right fielder Alonzo Knight charged the ball, picked it up on the hop and fired to Providence first baseman Chub Sullivan to nip Phillips at first.  The perfect game was saved on a seldom seen 9-3 assist/putout.

Number-two. With Chicago’s Mark Buerhle having  eight perfect innings against the Rays under his belt (July 23, 2009), White Sox Manager Ozzie Guillen brought speedy outfielder DeWayne Wise in to play center field.  It immediately proved to be a “wise” move.  The first batter in the ninth, Rays’ RF Gabe Kapler, ripped a drive to deep left-center.  Wise, who had been playing shallow to avoid a bloop hit, took off.  He hit the center field wall hard, gloved hand extended above the fence (in home run territory) and snagged the drive.  After hitting the fence, the ball was jarred loose and Wise corralled it with his bare hand as he fell to the ground – saving the perfect outing.  Buehrle went on to retire the final two batters (strikeout/groundout to short) to complete the perfect game.  See the video of Wise’s catch below.

  • The White Sox and Dodgers franchises have been involved in the most perfect games – four each. (Note: The White Sox won three of their four; the Dodgers lost three of their four.)
  • The White Sox and Yankees staffs have pitched the most perfect games – three each.
  • The Rays and Dodgers have been the most frequent victims of perfect outings – three each. (Three of the six most recent perfect games have been pitched against the Rays).
  • Cleveland squads going by the names the Blues, Naps and Indians have been involved in perfect games.

COME ON – JOIN THE PARTY!

Twenty-three of the current thirty MLB franchises have been involved in perfect games (on either the winning or losing side). The following teams have never been on the field for a perfecto: American League – Royals and Orioles. National League – Cardinals, Pirates, Brewers, Rockies and Padres.

  • Nine of the 23 perfect game pitchers logged 200 or more major league wins, led (of course) by Cy Young’s 511.
  • The list of perfect game pitchers includes seven Hall of Famers: John Ward, Cy Young, Addie Joss, Jim Bunning, Sandy Koufax, Cattish Hunter and Randy Johnson.
  • Seven of the hurlers who caught fire on the mound and achieved perfection for a game had career won-lost records under .500.
  • Seven of the perfect hurlers have more than one no-hitter (including the perfect game) on their resumes: Sandy Koufax (4 no-hitters); Cy Young (3); and two each for Jim Bunning, Mark Buehrle, Randy Johnson, Addie Joss and Roy Halladay.
  • The perfect games tossed by David Cone (1999), Mark Buehrle (2009), Philip Humber (2012) were the only complete game each threw in their perfecto season.

AVAILABLE ONE TIME – AND ONE TIME ONLY

Philip Humber threw just one complete game in his career - but it was "perfect."

Philip Humber threw just one complete game in his career – but it was “perfect.”

Phil Humber has the fewest career wins of any pitcher who has tossed a perfect game.  Humber finished an eight-season MLB career with a record of 16-31 and a 5.31 earned run average.  His perfect outing in 2012 was HIS ONLY COMPLETE GAME in 51 career starts. He finished the 2012 season at 5-5, 6.44 – notching the fewest wins and highest ERA ever for a pitcher in a season in which he reached perfection.


  • The most wins recorded by a pitcher in a season in which he three of perfect game was 39 – John Montgomery Ward, 39-24, 1.74 in 188o.
  • The most losses in a season in which a pitcher tossed a perfect game was 32 – Lee Richmond, 32-32, 2.15 in 1880.
  • 2012 was a banner year for perfect games with three – the most ever in a season.

GETTING AN EARLY START ON HISTORY

Charlie Robertson, who threw his perfect game for the White Sox against the Tigers on April 201922, was rather unique among perfect game hurlers. He pitched his gem earlier in his career than any other perfect game pitcher – in just his fourth MLB start and fifth career game. (By comparison, Randy Johnson was in his 17th season and Cy Young seeking his 380th victory when they threw their perfect games.) Robertson is also the only pitcher to throw a perfect game – and also finish below .500 for every season of his career (eight campaigns – career record 49-80, 4.44). In addition, he is the only pitcher to throw a perfect game against a team that batted over .300, as a team. In 1922, the Ty Cobb-led Tigers hit .306  – with six .300+ hitters in the everyday lineup, led by Cobb’s .401.   (The Tigers were shut out only five times that season).

  • No pitcher did more to help his cause (offensively) in a perfect game than Jim Hunter. As he shut down the Twins 4-0 on May 8, 1968, Hunter went 3-4 (double and two singles) with three runs batted in – recording the most hits, total bases and RBI by a pitcher in game in which he was perfect on the mound.  (One more hit and he could have been perfect at the plate as well.)
  • Jim Bunning is the only pitcher to record a save in the outing immediately before his perfect game. Three days befre his June 21, 1964 perfect game agasint the Mets, Bunning was brought in to get the last two outs in a 6-3 Phillies win over the Cubs.
  • David Cone (1999), Len Barker (1981) and Tom Browning (1988) all completed their perfect games without ever reaching ball three to any batter.
  • On September 16, 1988, Tom Browning almost became the first pitcher to start a perfect game on one day and finish it on another. The start of the game was delayed nearly 2 1/2 hours (starting just after ten p.m.) – and it wrapped up at about seven minutes to midnight.

WANT TO READ ABOUT PERFECT GAMES LOST WITH TWO OUTS IN THE NINTH INNING (OR LATER)?  Click here. 


———-MLB PERFECT GAMES LIST———

June 12, 1880 …. Lee Richmond, Worcester … Cleveland Blues 0 – at Worcester 1

Richmond’s 1880 record: 32-32, 2.15.  Career record: 75-100, 3.06.

June 17, 1880 … John Montgomery Ward, Providence Grays … Providence 5 – versus Buffalo Bisons 0

Wards’ 1880 record: 39-24, 1.74.  Career record: 164-103, 2.10.

May 5, 1904 … Cy Young, Boston Americans … Philadelphia A’s 0 – at Boston 3

Young’s 1904 record: 26-16, 1.97.  Career record: 511-316, 2.63

October 2, 1908 … Addie Joss, Cleveland Naps … Chicago White Sox 0 – at Cleveland 1

Joss’ 1908 record: 24-11, 1.16.  Career record: 160-97, 1.89.

April 30, 1922 … Charlie Robertson, Chicago White Sox … Chicago 2 – at Detroit Tigers 0

Robertson’s 1922 record: 14-15, 3.64. Career record: 49-80, 4.44.

October 8, 1956 … Don Larsen, New York Yankees … Brooklyn Dodgers 0 – at New York 2

Larsen’s 1956 record: 11-5, 3.26.  Career record: 81-91, 3.78.

June 21, 1964 … Jim Bunning, Philadelphia Phillies … Phillies 6 – at New York Mets 0

Bunning’s 1964 record: 19-8, 2.63. Career record: 222-184, 3.27.

September 9, 1965 … Sandy Koufax, Los Angeles Dodgers … Chicago Cubs 0 – at LA 1

Koufax’ 1965 record: 26-8, 2.04. Career record: 165-87, 2.76.

May 8, 1968 … Jim Hunter, Oakland A’s …. Minnesota Twins 0 – at Oakland 4

Hunter’s 1968 record: 13-13, 3.35. Career record: 224-166, 3.26.

May 15, 1981 … Len Barker, Cleveland Indians … Toronto Blue Jays 0 – at Cleveland 3

Barker’s 1981 record: 8-7, 3.91. Career record: 74-76, 4.34.

September 30, 1984 … Mike Witt, California Angels … California 1 – at Texas Rangers 0

Witt’s 1984 record: 15-11, 3.47. Career record: 117-116, 3.83.

September 16, 1988 … Tom Browning, Cincinnati Reds … LA Dodgers 0 – at Cincinnati 1

Browning’s 1988 record: 18-5, 3.41. Career record: 123-90, 3.94.

July 28, 1991 … Dennis Martinez, Montreal Expos … Montreal 2 – at LA Dodgers 0

Martinez’ 1991 record: 14-11, 2.39. Career record: 245-193, 3.70.

July 28, 1994 … Kenny Rogers, Texas Rangers … California Angels 0 – at Texas 4

Rogers’s 1994 record: 11-8, 2.46. Career record: 219-156, 4.27.

May 17, 1998 … David Wells, New York Yankees … Minnesota Twins 0 – at New York 4

Wells’ 1998 record: 18-4, 3.49.  Career record: 239-157, 4.13.

July 18, 1999 … David Cone, New York Yankees … Montreal Expos 0 – at New York 6

Cone’s 1999 record: 12-9, 3.44.  Career record: 194-126, 3.46.

May 18, 2004 … Randy Johnson, Arizona Diamondbacks … Arizona 2 – at Atlanta Braves 0

Johnson’s 2004 record: 16-14, 2.60. Career record: 303-166, 3.29.

July 23, 2009 … Mark Buehrle, Chicago White Sox … Tampa Bay Rays 0 – at Chicago 5

Buehrle’s 2009 record:  13-10, 3.84. Career record: 214-160, 3.18.

May 9, 2010 … Dallas Braden, Oakland A’s … Tampa Bay Rays 0 – at Oakland 4

Braden’s 2010 record: 11-14, 3.50. Career record: 26-36, 4.16.

May 29, 2010 … Roy Halladay, Philadelphia Phillies …. Phillies 1 – at Marlins 0

Halladay’s 2010 record: 21-10, 2.44.  Career record: 203-105, 3.38.

April 21, 2012 … Philip Humber, Chicago White Sox …. Chicago 4 – at Seattle Mariners 0

Humber’s 2012 record: 5-5, 6.44.  Career record: 16-23, 5.31.

June 13, 2012 … Matt Cain, San Francisco Giants … Houston Astros 0 – at San Francisco 10

Cain’s 2012 record: 16-5, 2.79, Career record: 104-118, 3.68 (through 2017).

August 15, 2012 … Felix Hernandez, Seattle Mariners …. Tampa Bay Rays 0 – at Seattle 1

Hernandez’ 2012 record: 13-9, 3.06.  Career record: 160-114, 3.20 (through 2017).

Primary resources: Society for American Baseball Research; Baseball-Reference.com; MLB.com; Baseball-Almanac.com


I tweet Baseball @DavidBBRT

Follow/Like Baseball Roundtable’s Facebook page here.

Member: Society for American Baseball Research; The Baseball Reliqauary; The Negro Leagues Baseball Museum.

Weird and Wild …Some Early Baseball Equipment and Rules … A Guest Post

BB REviewsBaseball Roundtable is pleased to bring readers a guest post from Chris Moskowitz of Baseball Reviews – thebaseballreviews.com – a solid source of information and opinion on baseball equipment from bats, to gloves, to shoes and more.  This youthful blogger is a lifelong baseball fan, who has played at the Recreational, Traveling Team, Competitive Club and High School level. He currently works for the Somerset Patriots (Bridgewater Township, New Jersey) of the Atlantic League (Independent).  You’ll find a link to The Baseball Reviews web site on the right-hand side of the BBRT home page.

_______________________________________________

THE WEIRD BEGINNINGS OF BASEBALL

by Chris Moskowitiz … thebaseballreviews.com

Yes, baseball has developed into an amazing and almost perfect sport. It is fair, fun, and an awesome choice for exercise and competition at any level. This is exactly why it is America’s favorite pastime.

But baseball hasn’t always been so great. Imagine playing baseball with a bat that is curved, facing a pitcher just 15 yards away from home plate. Consider handling a hot line drive without the aid of a fielder’s glove or crouching behind the plate without a catcher’s mask. Or imagine how long a game would take if it took nine balls outside the strike zone to produce a walk. All of these things seem a little far-fetched today, but this is how it was at the beginning of baseball.

FIELDERS’ GLOVES

Let’s talk about the gloves first. Gloves in baseball used to be nonexistent. Yes, you read that right, baseball gloves used to not be there to protect your hands. I would hate to have gone out to a position on the field in the era when there were no baseball gloves. A lot of people take something as simple as a baseball glove for granted. I know I did.

Imagine playing without a baseball glove and having to cleanly handle pop-ups or speeding grounders. It seems impossible. Especially when it’s cold out. Fall ball couldn’t be a thing in those times because there would have been too much pain in the joints of the hands of fielders. Imagine the sting you feel when you grab a sinking line drive with a glove. Now imagine the pain gloveless fielders must’ve gone through.

So how did they do it? Well, the answer is they would use smart techniques to stop the ball before fielding it. Some of these tactics include blocking the ball with their feet, slapping it down with their hands, or just letting it roll by, hoping the teammate behind them would stop it. I totally understand this, and would probably have done the same.

As the pain apparently mounted, innovation came. At first, fielders’ gloves looked pretty much like today’s batters’ gloves. Small, thin and not meant for catching or scooping. The main purpose of these earliest gloves was to knock the baseball down. Once the fielder could get the ball to stop, he could pick it up and throw it. Smart back then, now this is just a fielding exercise.

Fun Fact …

In the early days of baseball, there was considerable stigma attached to the use of a glove. One of the first group of confirmed players to don protective hand gear, first baseman Charlie Waitt, reportedly used a tan (near flesh-colored) glove, so as not to draw attention to the added gear. (Waitt played in the mid-1870s and early 1880s.)

The next step in innovation was to add the thumb and index finger pockets. I know that some baseball players like to stick their index finger out.  I don’t. The main purpose for that is to gain more control of the glove. As you can imagine, the thumb and finger pockets represented a big step forward for baseball gloves – and the art of fielding.

The next version of the baseball glove had a “pocket” in the palm of the glove to actually enable fielders to catch and field ground balls. That advance was a real game changer.

Glove


Since these early innovations, gloves have continued to gain in quality and craftsmanship. New, more pliable and durable materials have been introduced; gloves have been shaped and sized for specific positions (catcher, first base, infield, outfield); and manufacturers have even added flashy colors that allow you to match your fielder’s glove to your team colors.


Fun fact …

spaldingDo you know who the creator of Spalding Sporting Goods (a popular sports supplies company) was? It was Albert Spalding, a Hall of Fame pitcher for the Red Sox and White Sox.  Spalding – who led his league (the National Association and National League) in wins for all six of his full major league seasons. Spalding was well respected among players, and that respect was influential in the popularity of the baseball glove. When Spalding started wearing a baseball glove, a lot of others followed. After the popularity of the baseball glove started booming, he co-founded A.G. Spalding, a sporting goods company that is still very prominent today. He ran this company with his brother, Walter, and grew the company, while he grew baseball as well.  For example, in 1874, Red Sox owner Harry Wright charged Spalding with organizing the first foriegn tour by American baseball players – who played both baseball and cricket overseas. Later, as a baseball executive, Spalding is also credited with such innovations as Spring Training, efforts to bring more discipline to the sport and with organizing additinal “world tours” to promote the game. 

Also, did you know that the NBA official basketball is Spalding? Basketball wouldn’t be the same without baseball!

Note: Spalding played seven major league seasons (1871-1877), won 252 games and lost just 65, led his league in wins six times and put up career best numbers of 54-5, with a 1.59 earned run average in 1875.

BASEBALL BATS

Unlike baseball gloves, baseball bats were always in the picture, just not like we now know them.  At first, for example, all baseball bats (for any level of play) were wood. The technology was not developed enough to have metal baseball bats. It was easy just to use a machine to spin a piece of wood into a bat.

Fun Fact …

In the early days of baseball – before there were equipment manufacturers – players used to make their own bats (without restricutions on size, weight, etc.).  That must have made for some interesting sticks. 

Did you know that some baseball bats used to have two knobs on them instead of one? We are all used to the one knob at the end of the bat, so the bat doesn’t fly out of your hands.  When baseball was still in its early stages, some players used a two-knob bat, with the lower hand between the knobs and the upper hand resting on the top knob. Players like Hall of Famer Nap Lajoie (pictured below), who liked to “choke up” on the bat, were also known to use two-knob bats, resting the lower hand on the upper knob.    I wonder just how comfortable that was and what the impact was on bat control and power.

Embed from Getty Images

Another weird thing with baseball bats actually still goes on today. Bone rubbing is a very old technique to fill in the pores of your baseball bat with a hard enough material. This meant that the bats broke less, and were considerably stronger, which was a big advancement. Baseball greats like Babe Ruth and Lou Gehrig applied this bone treatment to their prized bats for countless hours.

One of the most outrageous baseball bat designs ever was the curved bat shape of the 1890s. Not all of the bats of the era were curved, but the unusually shaped sticks were popular among some players.  The purpose of this design was to enable hitters to put extra spin on the ball.  The thought was that if you could increase spin, the ball would fly farther – and, when the fielder got to the ball, the strong spin would make it harder to keep in the hand or glove.  This was true if the ball was hit perfectly with this bat, which was an extreme task because of the way the bat was shaped.  The degree of ball spin was less coming off regular baseball bats, which is why some players liked this bat. History shows us this bat design did not make it very far and is now primarily an example of experimental equipment design from long ago.

CATCHERS’ MASKS

In the earliest days of the national pastime, about the only piece of protective gear a catcher had was a rubber mouthpiece (similar to what boxers use). Of course, at that time, catchers had more leeway in terms of positioning. Most stood well behind the hitters, grabbing pitches and foul tips on the bounce. As the rules changed, requiring third strikes to be caught on the fly, catchers moved closer to the plate – and more protection was needed.

The catcher’s mask showed up in 1876 – a fencing mask modified by a fellow name Fred Thayer and used by the Harvard baseball squad. It was so popular (and much needed) that, by 1878, Thayer’s patented mask had secured a place in the popular A.G. Spalding Sporting Goods catalog. Over the years, protection for catchers has continued to improve – mitts, chest protectors, shin guards are all part of a modern-day catcher’s prized gear.


BASE ON BALLS

Not only has baseball equipment changed dramatically, we’ve also seen rules improvement from the early days of our national pastime. In the late 1870s, it took nine balls outside the striking zone to earn a walk. Imagine the effect of that rule on “pace of game.” In 1880, the figure was dropped to eight balls; it slid down to six in 1884; five in 1887; and the current four-ball rule came into play in 1889.

Fun Fact …

Here’s a fun, and kind of weird, fact.  In 1887, baseball experimented with a “four strikes and you’re out” rule.  This (what now seems weird) rule lasted only one season.

PITCHING DISTANCE

The last crazy part of baseball’s beginnings that I’ll share has to do with the distance between the pitcher and the batter. Nowadays, you’re probably used to the pitcher being 60-feet/six-inches away from home plate. However, that distance is lot more generous than the batter-to-pitcher path of baseball’s early days.

When baseball first started, the pitcher actually had no set length to pitch from. You could theoretically pitch from second base or just three-feet away. When baseball first “fixed” the pitching distance, the pitcher would stand 45-feet away from the batter. This seems like a pretty hazardous distance to me. It would be hard for any batter to avoid an errant (or purposeful) inside pitch and equally difficult for a pitcher to field a line drive smashed back at him.

The reaction time of a pitcher is one of the most important things in baseball. If the ball comes off the bat too fast or the pitcher is too close, the rules have to change. This is why  the distance is now 60-feet/six-inches and also why we see bat regulations. One of the bat regulations used now is BBCOR – or “Batted Ball Coefficient of Restitution – a measure of how much energy is lost (retained) when the bat makes contact with the baseball.

Well, all of these things had to come before we could witness the almost perfect baseball that we know today. All of these advancements have helped to make baseball more comfortable, safer and more enjoyable for players and fans.

Hope you enjoyed this guest post and, if you have a deeper interest in the equipment that is shaping today’s game, you can check out our equipment reviews at thebaseballreviews.com

Primary Resources: Society for American Baseball Research; Baseball-Reference.com; Baseball-Almanac.com; Smithsonianmag.com; 19cbaseball.com

If you have some specific interests, here are links directly to related reviews.

BATS: Click here.

GLOVES: Click here. 

CLEATS: Click here. 

OTHER GEAR: Click here. 

In addition, the “Guides” link has posts on everything from choosing a bat, to joining an adult league to caring for a baseball glove.

________________________________________________________


Baseball Roundtable tweets baseball @DavidBBRT

Follow/Like the Baseball Roundtable Facebook page here. 

More baseball commentary, blog post notifications, prizes. 

Member: Society for American Baseball Research; The Baseball Reliquary; The Negro Leagues Baseball Museum. 

Multi-tool MLB Players – Princes of Power & Sultans of Speed

Baseball Roundtable loves multi-talented players.  For example, among my current favorites are Rockies’ “Lumber and Leather” 3B Nolan Arenado (two home run titles and five Gold Gloves in five MLB seasons); Angels’ “Power and Speed” CF Mike Trout (youngest player to each 100 home runs and 100 stolen bases); and Astros’ “Is there anything he can’t do?” 2B Jose Altuve.  You get the idea.

BBRT recently focused on players that deliver exceptional offense and defense. You can see my post on MLB players who have won a Silver Slugger and a Gold Glove in the same season by clicking here.  In this post, Baseball Roundtable will focus on players who combined power and speed on offense – beginning with those who have led their league in home runs and stolen bases in the same season and working my way down to the kings of the 30/30 (HR/SB) Club.

————————

Power and Speed Factoid One:  Only three times in MLB history has a player led his league in both home runs and stolen bases in the same season.  Here they are:

Ty Cobb, Outfield, Detroit Tigers – 1909 – Nine home runs and 76 stolen bases

Ty Cobb, in just his third full MLB season (fifth MLB campaign overall) already had two batting titles and one stolen base crown under his belt.  Then, in 1909, he led the American League with nine home runs and 76 stolen bases – as well as with 216 base hits, 116 runs scored, a .377 average and 107 RBI.

Cobb, by the way, won just the one home run crown in his MLB career (1905-1928), but also earned six stolen base crowns and 12 batting titles – and led the AL in hits eight times, runs scored five times, RBI four times, triples four times and doubles three times. The Hall of Famer’s final (24 seasons/3,034 games) stat line was .366-117-1,944; with 4,189 hits, 2,244 runs scored and 897 stolen bases.

Ty Cobb is the only the only player to lead his league in home runs and stolen bases without ever hitting the ball over the fence or out of the park.   In 1909, all of Cobb’s AL-leading round trippers were of the inside-the-park variety.  

Jim Sheckard, Outfield, Brooklyn Superbas – 1903 – Nine home runs and 67 stolen bases

SheckIn his 17-season MLB career (1897-1913), Jimmy Sheckard won just one home run crown and a pair of NL stolen base titles. In 1903, he hit .332, with nine home runs, 75 RBI and 67 steals.  Considered one of the finest fielding outfielders of his time, Sheckard’s career stat line was .274-56-813, with 465 steals in 2,122 games. Sheckard’s best season was 1901, when he reached career highs in average (.354), base hits (196), home runs (11), RBI (104), doubles (29) and triples (a league-leading 19).


Chuck Klein, Outfield, Philadelphia Phillies – 1932 – 38 home runs and 20 stolen bases

ChuckChuck Klein successfully defended his 1931 home run crown (31 round trippers) with a league-topping 38 in 1932 – and he tossed in an NL-best 20 stolen bases. It was one of only two seasons in a 17-campaign career (1928-44) that the Hall of Famer reached double digits in thefts. In that 1932 season, Klein also led the NL in hits (226) and runs scored (152), while driving in 137 runs – a performance that earned him Most Valuable Player recognition.

Klein’s career stat line was .320-300-1,201, with 79 stolen bases. He also recorded 2,076 base hits and scored 1,168 runs. He led his league in runs scored three times, hits twice, doubles twice, home runs four times, RBI twice and batting average once.


Chuck Klein won a Triple Crown in the only season to feature Triple Crown winners in both the AL and NL – and from the same city no less.  In 1933 (the season after his home run/stolen base leadership), the Philadelphia Phillies’ Chuck Klein won the National League Triple Crow – hitting .368, with 28 home runs and 120 RBI. That same season, Philadelphia’s AL entry (Athletics) also featured a Triple Crown winner, Jimmy Foxx (.356-48-163).

—————————

Power and Speed Factoid Two:  Only six players have won both a home run crown and a stolen base title during their careers.  Let’s take a look at them.

You start, of course, with the three players from Factoid One – Ty Cobb, Jim Sheckard and Chuck Klein – then add:

Harry Stovey, Outfield/First Base – Worcester Ruby Legs, Philadelphia Athletics, Boston Reds, Boston Beaneaters, Baltimore Orioles, Brooklyn Grooms

StoveyPlaying from 1880 to 1893 (National League, American Association, Players League), Harry Stovey won five home run titles and two stolen base crowns. He led the NL in home runs in 1880 (six for Worcester) and 1891 (16 for Boston). Stovey also led the American Association in long balls in 1883 (14), 1885 (13) and 1888 (19) – all for Philadelphia. His two stolen base crowns came in 1886 (68 for Philadelphia of the AA) and 1890 (97 for Boston of the Players League). Over his career, Stovey hit .288, with 122 home runs, 912 RBI and 509 steals. In addition to his home runs and stolen base titles, he led his league in runs scored four tmes, doubles once, triples four times and RBI once.


Ed Delahanty, Outfield/First Base/Second Base – Philadelphia Quakers/Phillies, Cleveland Infants, Washington Senators

DelEd Delahanty enjoyed a 16-season MLB career (National League, American League, Players League). He twice led his league in home runs – both times for the Phillies – with 19 in 1893 and 13 in 1896. He led the NL in stolen bases (Phillies) with 58 in 1898. The Hall of Famer also led his league in hits once, batting average three times, doubles five times, triples once and RBI three times.  His career stat line was .346-101-1,466, with 456 steals and 1,600 runs scored.

Delahanty hit over .400 three times in his career – .405 in 1894; .404 in 1895; and .410 in 1899.


Willie Mays, Outfield – New York/San Francisco Giants, NY Mets

WillieThe “Say Hey Kid” won four home run crowns and four stolen base titles in his career – all of them with the Giants – just never in the same season. He led the NL in home runs in 1955 (51), 1962 (49), 1964 (47) and 1965 (52). He topped the league in stolen bases in 1956 (40), 1957 (38), 1958 (31) and 1959 (27).

In his MLB career (1951-73), the Hall of Famer also led the NL in hits once, runs scored twice, triples three times and batting average once.  His final stat line was .302-660-1,903, with 338 stolen bases, 3,283 hits and 2,062 runs scored in 22 seasons (2,992 games). He was the 1951 NL Rookie of the Year and the NL MVP in 1954 and 1965.  Mays, a true five-tool player, also earned 12 Gold Gloves.

So, there are your six players who have won both a home run title and a stolen base crown: Ty Cobb, Jim Sheckard, Chuck Klein, Harry Stovey, Ed Delahanty and Willie Mays.

———————–

Power and Speed Factoid Three: Only two players have both a 50-home run and a 50-stolen base season on their major-league resumes – Brady Anderson and Barry Bonds. 

Barry Bonds – 52 stolen bases for the Pittsburgh Pirates in 1990 and 73 home runs for the San Francisco Giants in 2001

Barry Bonds photo

Photo by kevinrushforth

No surprise here. Barry Bonds, the all-time MLB home run leader (762), reached forty or more home runs eight times in his 22-season MLB career (1986-2007 … Pittsburgh Pirates and San Francisco Giants) and stole forty or more bases three times.  What might be a surprise is that he only reached the fifty mark once in each category.

Bond’s career stat line: .298-762-1,996, with 514 stolen bases.  He also had 2,935 hits and 2,227 runs scored.  He led his league in home runs twice, RBI once and runs scored once. He was also a seven-time league MVP, 14-season All Star and eight-time Gold Glover.


Brady Anderson – 53 stolen bases for the Orioles in 1992 and 50 home runs for the Orioles in 1996

Brady Anderson photo

Photo by Keith Allison

A bit of a surprise here, since Brady Anderson’s second-highest season home run total was just 24 and he only reached 20 home runs three times in 15 MLB seasons (1988-2002 … Red Sox, Orioles, Indians). Anderson did top 20 steals in seven seasons. Anderson, a three-time All Star, put up a career stat line of .256-210-761, with 315 stolen bases.  His best season was 1996, when he hit .297, with 50 home runs, 110 RBI and 21 steals.


SHORT BREAK:  Please take a few minutes to vote in Baseball Roundtable’s (unofficial) Fan Hall of Fame balloting.  BBRT would like to get a nice fan sampling to compete with the final BBWAA vote.  Click here to access the ballot.  Thank you for helping out. 

————————-

Power and Speed Factoid Four: Only four players have hit 40 home runs and stole 40 bases in the same season. 

Okay, everyone pretty much knows this, but since there are no 50-50 seasons, the 40-40 list needs to be here.  I will, however, be brief.

Jose Canseco, Outfield, A’s – 1988 – 42 home runs and 40 stolen bases

In 1988, Jose Canseco hit  .307-42-124, with 40 steals – earning the AL MVP Award. His final stats (17 seasons … 1985-2001) were .266-461-1,407, with 200 stolen bases. He was a six-time All Star, 1986 Rookie of the Year and a two-time home run champ.

Barry Bonds, Outfield, Giants –  1996 – 42 home runs and 40 stolen bases

In 1996, Barry Bonds hit .308, with 42 home runs, 129 RBI and 40 steals. For more on Bonds, see Factoid Three.

Alex Rodriguez, Shortstop, Mariners – 1998 – 42 home runs and 46 stolen bases

Alex Rodriguez hit .310, with 42 home runs, 124 RBI and 46 stolen bases for the Mariners in 1996. In a 22-season MLB career (1994-2013/2015-2016 … Mariners, Rangers, Yankees), Rodriguez hit .295, with 696 home runs, 2,086 RBI and 329 steals. He was a 14-time All Star, three-time MVP and two-time Gold Glover. During his career he topped 40 home runs in a season eight times (with 50 or more three times) and stole 20 or more bases six times.  He led the AL in home runs five times, runs scored five times, hits once, doubles once and batting average once.

Alfonso Soriano, Outfield, Nationals – 2006 – 46 home runs and 41 stolen bases

Alfonso Soriano barely missed the 40-40 club in 2002, when he hit 39 home runs and swiped a league-leading 41 bases for the Yankees. He joined the club four year later with a .277-46-95, 41-steal season for the Nationals.  In his 16-season MLB career (1999-2014 … Yankees, Rangers, Nationals, Cubs), Soriano hit .270, with 412 home runs, 1,159 RBI and 289 stolen bases. He was a seven-time All Star and led his league in runs, hits and stolen bases once each (all in 2002, when he hit.300-39-102, with 41 steals for the Yankees). He topped 30 home runs in seven seasons and exceeded 20 steals in five campaigns.

————————

Power and Speed Factoid Five: Two players share the record for most times in the 30-30 (home runs/stolen bases) Club – and they are a father-son combination.

Going into the 1950s, MLB’s 30-30 Club had only one member – Saint Louis Browns’ outfielder Ken Williams, who hit .332, with 39 home runs, 155 RBI and 37 stolen bases in 1922. (He led the AL in home runs and RBI.) It was the only season that Williams (who finished a 14-season MLB career with 196 homers and 154 steals) ever reached thirty in either category. Williams retired with a .319-196-916 stat line.

The next 30-30 season was recorded by Willie Mays in 1956 (he did it again in 1957); then Hank Aaron joined the group in 1963; and Bobby Bonds earned his membership in 1969.  By 1978, there had been ten 30-30 seasons in MLB – and Bobby Bonds had five of them.  Through 2017, 38 players have acheived a total of sixty 30-30 seasons.  Only two have five 30-30 campiagns on their resume:   Bobby Bonds and his son Barry Bonds.


Bonds

Key resources; Society for American Baseball Research; Baseball-Reference.com; Baseball-Almanac.com


I tweet baseball @DavidBBRT

Follow/Like Baseball Roundtable’s Facebook Page here.   More baseball commentary, blog post notifications, prizes.

Member: Society for American Baseball Research; The Baseball Reliquary, The Negro Leagues Baseball Museum