The 2016 regular season is behind us, and that means it’s time for another BBRT monthly wrap up. So, in this very lo-o-o-ong post, we’ll look at September records, stats and happenings; season-ending stats and observations; September monthly BBRT honors; and post-season predictions. Note: I normally post the wrap up on the first of the next month, but this time I decided to wait until October 2 (to include the end-of-season stats.)
September gave us plenty to look at, with such occurrences as:
- The Cardinals setting a new MLB season record for pinch-hit home runs;
- The White Sox setting a new record for dogs attending a sporting event; and
- The Indians using a record nine pitchers to deliver a shutout.
We also saw some full-season accomplishments like:
- David Ortiz, in his final season, setting new major league records for doubles, home runs and RBI in a season at age 40 or over (his final numbers: .315-48-127, with 48 doubles);
- Zach Britton going 47-for-47 save in converting save opportunities – and setting an MLB record for the lowest ERA for a pitcher with at least 50 innings pitched;
- The Twins matching an MLB record by having four players with double-digit home runs;
- The Cardinals hitting a record 17 pinch-hit home runs;
- Three players appearing in all 162 games.
This post will cover these occurrences and more, but first a look at the upcoming post-season.
Post Season Participants
 There were no tight Divisional races as September came to a close. Your Division champs were the Indians, Red Sox, Rangers, Nationals, Cubs and Dodgers – and, as of September 30, all had leads of at least five games (Red Sox over Orioles), with the Cubs having the largest margin at 18 ½ games over the second-place Cardinals.
The Wild Card races were still to be decided as September came to a close. In the AL the Orioles held a one game edge over the Blue Jays, with the Tigers ½-game behind the Jays and the Mariners one game out of the final spot. Over the final weekend, Detroit and Seattle both went 0-2, dropping out of the Wild Card competition. Over in the NL, three teams were competing for two Wild Card spots, with the Mets one game up on the Giants and the Cardinals trailing San Francisco by one game for the final WC spot. The Mets split their final two contests, while the Cardinals and Giants both went 2-0 – knocking the Cardinals out of the post season. You can find full standings and won-lost records (full season and September) at the end of this post.
Your Final Playoff Teams:
AL: Division Champions: Red Sox, Indians, Rangers. Wild Cards: Orioles, Blue Jays.
NL: Division Champions: Nationals, Cubs, Dodgers. Wild Cards: Mets, Giants.
—–Baseball Roundtable Quick Picks for the Playoffs—–
Wild Card Play In
ORIOLES over Blue Jays: Two power-focused, high-scoring offenses, but pitching gives the Orioles the edge.
GIANTS over the Mets: Noah Syndergaard versus Madison Bumgarner – a great matchup. BBRT goes with MadBum’s post-season experience. Off-the-wall prediction … MadBum gets an RBI double in this one.
ALDS
ORIOLES over Rangers: A tough series, with both teams facing late-season issues with starting pitching. BBRT thinks Orioles’ bullpen will be the difference maker.
RED SOX over Indians: The BoSox have a balanced attack – a veteran presence – and enough pitching to keep David Ortiz on the field for at least another series. Still, if David Price falters, the Indians could sneak by.
NLDS
CUBS over Giants: MadBum can’t pitch every day and the Cubs have a solid offense – plus Jon Lester and Kyle Hendricks to start and Aroldis Chapman to close the door. Having to use Madison Bumgarner in the Wild Card game will hurt the Giants. For the Giants to win, Johnny Cueto has to pitch like a stud and Buster Posey has to hit like an MVP. I just don’t think they have the horses.
DODGERS over the Nationals. The Dodgers will ride solid pitching to a series’ win. Off-the-wall prediction: Clayton Kershaw, 2-6, 4.59 in 13 post-season games, will go 2-0, with an ERA under two in this series; and Kenta Maeda will shine.
ALCS
RED SOX over Orioles: The Red Sox just have too much for the O’s – and Big Papi wants to go out with a bang. Hanley Ramirez has been hot, Mookie Betts could be the ALCS MVP. Off-the-wall prediction: Zach Britton blows his first save of 2016 in this series.
NLCS
CUBS over the Dodgers: See the NLDS, the Cubs have a young powerful offense (led by Kris Bryant, Anthony Rizzo), stellar pitching and destiny on their side. Off-the-wall prediction: Ben Zobrist hits a pair of key home runs in this series.
WORLD SERIES
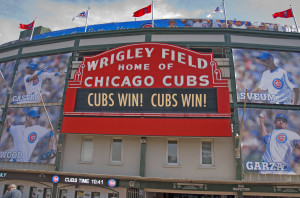
Two revered franchises. Seven games. A classic. Who wins? Toss up, but I give the CUBS the edge. (It’s a long and tiring season and they have youth on their side. I also like Kyle Hendriks and Jon Lester to win two games each. David Price may be the key for the Red Sox – along, of course, with the impact of Big Papi leading the emotional charge. Still, I see – Cubs Win! Cubs Win!
SEPTEMBER TEAM PERFORMANCE ——————

Photo by Trace Meek 
September’s winningest team was the Red Sox, who secured the Division title with a 19-8 month. Over in the NL, the Dodgers and Cubs both went 17-10 to lead the senior circuit in September wins. Other teams with at least 16 victories in the month were the Mariners (18-9); Mets (17-10); Orioles (16-11); Indians (16-11) – and the surprising Braves (16-10).
The Red Sox earned those 19 victories at the plate, on the mound and in the field – giving up the fewest September runs in MLB (85), while scoring MLB’s most runs for the month with 150. In the process, they achieved the AL’s second-lowest September 2016 ERA at 3.05 (only Baltimore was better at 2.90) and the league’s third-highest batting average at .275.
The worst September performance? The Twins at 8-19, the only team to record less than ten wins. (The Twins finished the season an MLB-worst 59-103.) In the NL, the worst September record belonged to the Phillies at 10-17. The Twins were almost the mirror image of the Red Sox. Minnesota gave up the most runs in the AL (154) in September, while scoring the league’s third-fewest (107).
Before we get into details, highlights and stats for September, let’s look at BBRT’s Honor Roll for the month.
—–Baseball Roundtable September Honors—–
AL Player of the Month – Miguel Cabrera 1B, Tigers
Cabrera put up solid offensive numbers across the board in September: a .347 average (fifth in the AL among players with at least 75 plate appearances); 10 home runs (second in the AL); 27 RBI (second in the AL); and 20 runs scored (fourth in the AL). Among the other players high on BBRT’s September list were Royals’ DH Kendrys Morales, with an MLB-leading 30 RBI, to go along with a .333 September average and eight home runs; and Tigers’ LF Justin Upton (.307-12-27 for the month). Red Sox’ DH David Ortiz (a sentimental favorite) was also in the running at .33-7-25. A close call, but Miggy gets the nod.
NL Player of the Month – Freddie Freeman, 1B, Braves
Photo by Neon Tommy
When Braves first-sacker Freddie Freeman went hitless in four at bats on September 29, it was his first hitless game in the month of September – and it ended 2016’s longest MLB hitting streak (which began on August 24) at 30 games. During the streak, Freeman hit .384 with seven home runs, 26 runs scored and 27 RBI, raising his batting average from .288 to .308. For the month of September – during which the Braves surprised baseball by going 16-10, hitting .292 as a team and leading the NL in runs scored – Freeman hit .385 (tied for best in the NL), with six home runs, 22 runs scored (tied for third in the NL) and 22 RBI (tied for second in the NL). Freeman also drew 18 walks – contributing to an MLB-best .486 on base percentage. Freeman’s primary competition for BBRT Player of the Month for September was his teammate, LF Matt Kemp. Kemp hit .337 in September, with nine home runs, while matching Freeman in runs scored (22) and RBI (22). Freeman’s streak and on-base-percentage (102 points higher than Kemp’s) gave him the edge.
AL Pitcher of the Month – Rick Porcello, RHP, Red Sox
Photo by Keith Allison
Five AL hurlers picked up four victories in September and, among those five, Rick Porcello (4-1, 2.70) was second in ERA (2.70), second in WHIP (0.88), first in innings pitched (he led the league with 43 1/3 innings) and third in strikeouts (37). Couple that with the fact that Porcello’s fourth September win was his 22nd of the season – against just four losses – and he earns BBRT Pitcher of the Month (and a likely a favorite’s position in the AL Cy Young balloting). The key competition came from resurgent Tigers’ RHP Justin Verlander, who – despite going just 2-1 in five starts – put up the AL’s third-best ERA for the month at 1.93 (behind only the 1.44 of A’s RHP Jharel Cotton and the 1.85 of Angels’ RHP Rickey Nolasco). Verlander also led the league (and all of MLB) in strikeouts for the month, with 48 in 32 2/3 innings.
NL Pitcher of the Month, Jon Lester, LHP Cubs
Easy pick here. Cubs’ southpaw John Lester was the only MLB pitcher to earn five wins in September (5-0 in five starts) and had MLB’s lowest ERA for the month at 0.48. Lester gave up just two earned runs in 37 2/3 innings pitched. For the month, opposing batters hit just .171 against Lester. In his five starts, he averaged just over 7 1/3 innings pitched, 4.4 hits, 0.8 walks, 6.2 strikeouts and 0.4 earned runs. Lester finished the season 19-4, 2.28 – having won his last ten decisions (in 14 starts). His last loss came on July 3.
AL Team of the Month – Boston Red Sox, 19-8
The Red Sox finished August 74-59, two games behind the Blue Jays in the AL East. They then went 19-8 in September to take control of the East, clinching the Division title on September 28. The Red Sox used a combination of pitching and hitting to earn Team of the Month recognition – giving up the fewest runs in the AL (85) and scoring the league’s most (150). Leading the Red Sox to a 3.05 ERA for the month (second-best in the AL) were starter Rick Porcello (4-1, 2.70) and Eduardo Rodriguez (1-1, 2.89). David Price added four wins (versus one loss), but did post a 4.35 ERA. In the bullpen, closer Brad Ziegler was ten-for-ten in save opportunities, and did not give up a single earned run in 12 appearances. Bullpen mates Koji Uehara (11 appearances) and Junichi Tazawa (five appearances) also boasted ERA’s of 0.00 for the month, and Joe Kelly gave up just one earned run in 10 appearances (0.75 ERA for the month.)
On offense, 1B Hanley Ramirez (.313-10-26) and DH David Ortiz (.333-7-25) provided the bulk of the power, with plenty of help from the likes of RF Mookie Betts (.314 with 17 runs scored and five steals) and 2B Dustin Pedroia (.315 with 18 runs scored).
NL Team of the Month – Atlanta Braves, 16-10
The Braves entered September with a dismal 50-83 record and then surprised everyone with a 16-10 September – built primarily around their offense. For the month, the Braves logged the ninth-best (or seventh-worst) ERA at 4.50, but led the NL (and all of MLB) in batting average at .292. They gave up the eighth-most runs in the league (123), but plated the most tallies (143). Leading the offensive surge for the Braves were: LF Matt Kemp (.337-9-22 for September) and 1B Freddie Freeman (.385-6-22) – with notable contributions from CF Ender Inciarte (.324 with an NL-leading 23 runs scored), 3B Adonis Garcia (.277-3-17, with 19 runs scored) and SS Danby Swanson (.313-3-13, with 14 runs scored).


Now, how about September team stats?
______________________________________________________________
SEPTEMBER TEAM LEADERS
ERA
AL: Orioles – 2.90; Red Sox – 3.05; Mariners – 3.22
NL: Dodgers – 3.00; Cubs – 3.08; Brewers – 3.28
Five MLB teams had ERA’s over 5.00 for the month of September: Royals – 5.37; Twins – 5.13; Phillies – 5.12; D-backs – 5.05; Rockies – 5.02.
Fewest Runs Allowed
AL: Red Sox – 85: Orioles – 89; Mariners – 103
NL: Dodgers – 89; Cubs – 95; Mets – 95
Four teams gave up 150 or more runs in September: Rockies – 165; Pirates – 159; Twins – 154; Phillies – 153; Royals – 150.
Earned Runs Allowed
AL: Orioles – 78; Red Sox – 81; Mariners – 88
NL: Dodgers – 80; Cubs – 85; Brewers – 86
Only two MLB teams gave up 140+ earned runs in September: Royals – 143; Twins -141. The Phillies gave up the most earned runs in the NL (137).
Strikeouts
AL: Indians – 240; Red Sox – 238; Tigers – 237
NL: Dodgers – 268; Mets – 250; Giants; 248; Cubs – 248
The Dodgers led all of MLB in strikeouts per nine innings in September at 10.06. Other teams reaching at least nine K’s per nine innings for the month were: Tigers (9.34); Nationals (9.13); Mets (9.12); Indians (9.04); Cubs (9.00).
Fewest Walks Allowed
AL: A’s – 65; Red Sox – 68; Indians – 71
NL: Brewers – 70; Dodgers – 71; Cubs – 73
No team walked more batters than the Reds, who handed out 113 free passes in September. The Yankees’ staff walked the most hitters in the AL for the month at 102. Coincidentally (or perhaps not), the Reds also gave up the most September home runs in the NL (41), while the Yankees gave up the most long balls in the AL (39).
Saves
AL: Rangers – 10; Red Sox – 9; Yankees – 9
NL: Mets – 9; Padres – 9; Marlins – 9.
Only two teams completed September without a blown save during the month: the Cubs and Indians (each with six saves). The Phillies had the worst save percentage for the month, with just five saves in 13 opportunities (38.5%).
Batting Average (hitters)
AL: White Sox – .286; Tigers – .278; Red Sox – .275
NL: Braves – .292; Reds – .286; Rockies – .273
The Padres had MLB’s lowest September batting average at .230, while the Twins were at the bottom of the AL at .231.
Runs Scored
Al: Red Sox – 150; White Sox – 148; Mariners – 147
NL: Braves – 143; Mets – 141; D-backs – 134
Only the Marlins scored fewer than 100 runs in September (99); while the usually high-scoring Blue Jays plated the fewest runners in the AL (100).
Home Runs
AL: Mariners – 42; Orioles – 41; Twins – 41
NL: Brewers – 42; Mets – 39; D-backs – 39
Just two teams launched fewer than 20 long balls in September; the Marlins (17) and the Indians (19).
Stolen Bases
AL: Royals – 31; Indians – 26; Angels 23
NL: Brewer – 31; Nationals – 25; Phillies – 24
Seattle had the best stolen base percentage for September, safely swiping 14 bags in 15 attempts (93.3%). The Tigers were the only team to be thrown out in more than half their steal attempts, being gunned down seven times in 13 attempts.
_______________________________________________________________
—–Now let’s look at some intriguing happenings from September—–
Not Exactly a Perfect time to go to the Pen
On September 10, Dodgers’ southpaw Rich Hill was definitely on his game. In fact, after seven innings – and 89 pitches – Hill was pitching a perfect game against the Marlins, boasting a 5-0 lead and nine strikeouts. It was at that time that Dodger Manager Dave Roberts decided to replace Hill (who had earlier spent time on the disabled list with blister issues) with reliever Joe Blanton (who retired the first two batters in the eighth before LF Jeff Francoeur hit a single). The Marlins ended up with two hits, the Dodgers ended up with a 5-0 win – and Hill ended up with a victory, but no “perfecto.” BBRT note: There has never been a combined perfect game in MLB. Second BBRT note: At least they were playing in Miami, imagine the uproar it they had been at home. Third BBRT note: If that had been Jack Morris on the mound, Roberts would have needed the Fire Department and the “Jaws of Life” to pry the ball out of his hands.
Complete Games – We Don’t need Not Stinkin’ Complete Games
On September 17, Carlos Carrasco started on the mound (against the Tigers) for the Indians in Cleveland. Carrasco gave up a leadoff single to Tigers’ 2B Ian Kinsler – a line shot off Carrasco’s right hand that broke a finger and knocked him out of the game (and the rest of the season). What followed was a bit of baseball history, as eight Indians’ relievers held the Tigers scoreless in a 10-inning 1-0 Cleveland victory. The Elias Sports Bureau reports that it is the most pitchers ever used in a complete-game shutout. The cast of characters? Carrasco; Jeff Manship (1 1/3 innings pitched); Kyle Crockett (2/3); Cody Anderson (two IP); Zach McCallister, Perci Garner, Bryan Shaw, Cody Allen (one inning each); Andrew Miller (two innings for the win.) Final line: 10 innings, four hits, three walks, ten strikeouts, no runs.
Shut Outs – Usually a Team Effort These Days
In 2016, MLB teams shut out their opponents 276 times – only 11.6 percent of those (32) were complete game shut outs (by a single pitcher). Clayton Kershaw led MLB with three complete game shutouts.
Put Me In Coach, I’m Ready to Play
On October 2, Alcides Escobar started at SS for the Royals, Jonathan Schoop started at 2B for the Orioles and George Springer started in RF for the Astros. They had one thing in common, they were each playing in their 162nd game of the 162 -game season – the only three players to do so in 2016.
Off to a Roaring Start

Photo by apardavila
On September 27, Yankee rookie catcher Gary Sanchez hit his 20th major league home run – in just his 51st major league game. The long ball tied Sanchez with Wally Berger of the Boston Braves (1930) for the fastest track (fewest games) to reach 50 home runs at the start of a career. Sanchez, who got two at bats in a late 2015 call-up (no hits) and had a zero-for-four game performance for the Yankees in a one-game call up in Mid-May of this season, has been a solid performer since returning to the Yankees on August 3. The 23-year-old finished the season at .299-20-42 in 53 games – earning mention as a rookie of the year candidate.
Save the Last Dance for Me
On September 28, the Orioles’ Zach Britton picked up the save in a 3-2 Orioles victory in Toronto. It was his 47th save in 47 2016 opportunities. He appeared in one more game – on October 2 in a non-save situation – pitching 1 2/3 innings without giving up an earned run and setting an MLB record for the lowest ERA for a pitcher with at least 50 innings pitched. Britton gave up just four earned runs in 65 1/3 innings for a 0.54 ERA. His stellar work as a closer helped the Orioles each post-season, where he hopes to notch additional saves in the ‘big dance.” BBRT note: Britton has a career ERA of 4.86 in 250 innings as a starter and 1.36 in 212 innings of relief.
Keeping he Pressure On
On September 12, the White Sox became the second team to score in every inning of a game this season, as they topped the Indians 11-4 in Chicago. The White Sox became just the 20th team in MLB history to score in every inning of a ball game (Note: Just last month, on August 11th, the Milwaukee Brewers scored in every inning of an 11-3 win over the Braves.)
That’ll do in a Pinch – Or Going to the Matt
On September 6, Matt Carpenter came to the plate as a pinch hitter (with two out in the top of the ninth inning and the Cardinals trailing the Pirates 6-5) in Pittsburgh. Carpenter homered to tie the game – and the Cardinals went on to win 9-7. The homer not only tied the contest, it gave the Redbirds the record for the most pinch hit home runs a season at 15. The Cardinals extended that record to 17 pinch-hit homers with long balls in that role by Matt Adams on September 27 and Matt Holliday on September 30.
Another Dose of Dozier

Photo by rtclauss
On September 22 – as the Twins lost to the Tigers 9-2 – Brian Dozier connected for his 42nd home run of the year. It was his 40th while playing second base (two came as DH), setting a new AL record for home runs hit in a season by a second baseman. It came as Dozier led off the first inning, his 19th career leadoff blast. The MLB record for homers in a season while playing second base (42) belongs to the Cardinals’ Rogers Hornsby (1922) and the Braves’ Davey Johnson (1973 … Johnson hit 43 that season).
A Doggone Good Performance
On September 13, Chicago White Sox fans turned in a doggone god performance – as the White Sox took on the Indians (at U.S. Cellular Field) on “Bark in the Park” day. According to the folks at the Guinness Book of World Records, 1,122 dogs attended the game – a world record for dogs attending a sporting event. The honor seems appropriate as the White Sox were the first team to sponsor a day for dogs in the park – a decade ago. Oh yeah, and the Sox gave the pooches something to howl about, winning the game 8-1.
The Shakespeare of Baseball Retires

Photo by Exile on Ontario St
On October 2, Vin Scully announced his last game for the Dodgers – ending a 67-year relationship with the team (the longest tenure any announcer has had with a sports team). Scully’s final game in the broadcast booth was a 7-1 Dodgers’ loss to the rival Giants in San Francisco. His final call at home, however, was much more appropriate. On September 25, Scully called his last Dodger home game – and it ended with Dodgers’ 2B Charlie Culberson hitting a two-out, extra-inning (11th), walk-off, division-title-clinching home run. The round tripper was, by the way, Culberson’s only home run for the season.
Scully – who won just about every sports broadcasting award available during his career – “called” more than 9,000 Dodger games. Among key “calls” in Scully’s career were:
- Don Larsen’s perfect game in the 1956 World Series;
- Perfect games by Sandy Koufax (1965) and Dennis Martinez (1991), along with 18 no-hitters;
- Hank Aaron’s 715th homer run;
- Kirk Gibson’s pinch-hit, walk-off home run in Game One of the 1988 World Series;
- Three World Series (1984, 1986, 1988); four NL Championship Series (1983, 1985, 1987, 1989); and
- Four All Star games (1983, 1985, 1987, 1989).
Vin Scully – Bits of Trivia
– Ironically, despite spending a career as a Dodgers’ broadcaster, Scully’s first baseball love was the rival Giants – who played at the Polo Grounds near his childhood home.
– Known for his smooth harmonious broadcast voice – some referred to it as dulcet – Scully sang in a barbershop quartet during his college years.
– On June 3, 1989 (a Saturday), Scully did the NBC Game of the Week play-by-play for a 10-inning Cardinals’ win over the Cubs in St. Louis. After the game, Scully flew to Houston, where his Dodgers were playing the Astros. (Scully was to broadcast the Sunday game.) The Saturday game went into extra innings and, rather than go directly to his hotel, Scully went to the ball park – and ended up calling the final 12 innings of that 22-inning contest. Two games, two cities, 23 innings – quite a busy day
Lucky Number Eleven
On September 25, Red Sox pitchers set a major league record by fanning 11 batters in a row – from the second out of the fourth inning to the final out of the seventh – as the Red Sox topped the Rays 3-2 in Tampa. The first six strikeouts (five swinging) went to starter Eduardo Rodriguez, while the last five (four swinging) were notched by reliever Heath Hembree. Overall, five Red Sox pitchers fanned 23 Rays’ batters in the ten inning contest: 13 by Rodriguez in 5 1/3 innings; five by Hembree in 1 2/3 IP; one by Matt Barnes in 1/3 IP; none by Fernando Abad (who faced one batter and gave up a hit); and four by Joe Kelly in 2 2/3 IP. And, how lucky was number eleven that day? It was also the Red Sox’ eleventh consecutive victory.
Tom Terrific
Photo by slgckgc
When Red Sox’ pitchers Eduardo Rodriguez and Heath Hembree set an MLB record by striking out eleven consecutive hitters in a September 25th game against the Rays, they were teaming up to top a “one-man show.” The previous record of ten straight batters fanned was set on April 22, 1970, by the Mets’ Tom Seaver – who fanned the last ten batters he faced while tossing a complete game and beating the Padres 2-1 in New York. Seaver’s line for the day: nine innings pitched, two hits, two walks, one earned run and 19 strikeouts.

Not So Lucky Number Eleven
On the final day of the 2016 regular season, Twins’ CF Byron Buxton led off a game against the White Sox (an eventual 6-3 Twins’ win) with an inside-the-park home run. The blast enabled the Twins to tie a major league record – having eleven players on the roster hit double digits (10 or more) in home runs in a single season. The power display did not pay off in the won-lost column, as the Twins finished the season with MLB’s worst record at 59-103, 35 ½ games out of first place in the AL Central. The team whose record the Twins tied was the 2004 Tigers – who finished that campaign 70-92, 20 games out of first.
____________________________________________________
STAT TIME – INDIVIDUAL LEADERS FOR SEPTEMBER
Average (minimum 75 plate appearances)
AL: Ian Kinsler, Tigers – .386; Elvis Andrus, Rangers – .363; Jarrod Dyson, Royals – .362
NL: Joey Votto, Reds – .385; Freddie Freeman, Braves – .385; Yadier Molina, Cardinals – .371
Among players with at least 75 plate appearances, no one fared worse than Cardinals’ 1B Brandon Moss, who went 7-for-83 in September – a .084 average. In the AL, the lowest average (minimum 75 plate appearances) went to the Twins’ infielder Eduardo Escobar (9-for-85) at .129.
Runs Scored
AL: Mike Trout, Angels – 21; Xander Bogaerts, Red Sox – 21; Adam Eaton, White Sox – 21
NL: Curtis Granderson, Mets – 23; Ender Inciarte, Braves – 23; Freddie Freeman, Braves – 22; Matt Kemp, Padres/Braves – 22
Home Runs
AL: Justin Upton, Tigers – 12; Miguel Cabrera, Tigers – 10; Hanley Ramirez Boston, 10
NL: Chris Carter, Brewers – 10; Matt Kemp, Braves – 9; Curtis Granderson, Mets – 8
RBI
AL: Kendrys Morales, Royals – 30; Miguel Cabrera, Tigers – 27; Justin Upton, Tigers – 27
NL: Anthony Rendon, Nationals – 23; Matt Kemp, Braves – 22; Chris Carter, Brewers – 22; Freddie Freeman, Braves – 22
Stolen Bases
AL: Mike Trout, Angels – 8; Kevin Kiermaier, Rays – 8; two with 7
NL: Dee Gordon, Marlins – 14; Trea Turner, Nationals – 13; Jonathan Villar, Brewers – 10.
Walks Drawn
AL: Joe Baustista, Blue Jays – 23; Mike Trout, Angels – 23; two with 22
NL: Cesar Hernandez, Phillies – 22; Ben Zobrist, Cubs -22; Brandon Belt, Giants – 19
Swing and Miss – Nationals’ shortstop Danny Espinosa led MLB in September strikeouts – fanning 40 times in just 85 at bats (.106 batting average for the month). In the AL, Brian Dozier led the way with 38 whiffs in 111 at bats – but fared better than Espinoza overall, hitting .270 with 10 home runs and 18 RBI for the month.
Earned Run Aveage (minimum 25 innings pitched)
AL: Jharel Cotton, A’s – 1.44; Ricky Nolasco, Angels – 1.85; Justin Verlander, Tigers – 1.93
NL: John Lester, Cubs – 0.48; Kyle Hendricks, Cubs – 1.38; Johnny Cueto, Giants – 1.78
Looking at pitches with a least four September starts, The Astro’s Doug Pfister had MLB’s worst ERA for the month at 11.74 (30 earned runs in 23 innings over six starts). In the NL, the worst ERA goes to the Pirates’ Ryan Vogelsong (8.72 over 21 2/3 innings in five starts).
Wins
AL: Ariel Miranda (Mariners (4-1, 2.62); Rick Porcello, Red Sox (4-1, 2.70); David Price Boston (4-1, 4.35); Taijuan Walker, Mariners (4-2, 4.31); Carlos Rodon, White Sox *4-2, 4.50)
NL: John Lester, Cubs (5-0, 0.48); Johnny Cueto, Giants (4-0, 1.78); Max Scherzer, Nationals (4-0, 2,43); Dan Straily, Reds (4-1, 3.13); Carlos Martinez, cardinals (4-2, 2.92) Adam Wainwright, Cardinals (4-1, 5.46)
The Cardinals scored 41 runs in Adam Wainwright’s five September starts, enabling him to go 4-1, despite a 5.46 ERA for the month. In contrast, fellow Cardinals’ pitcher Mike Leake also had five September starts, with an almost identical 5.47 ERA. The Cardinals scored just eight runs in Leake’s starts – resulting in a 0-3 record for the month.
Strikeouts
AL: Justin Verlander, Tigers – 48 (32 2/3IP); Carlos Rodon, White Sox – 44 (36 IP); Yu Darvish, Rangers – 42 (28 2/3 IP); Chris Sale, White Sox – 42 (36 IP)
NL: Madison Bumgarner, Giants – 44 (39 IP); Jeff Samardzija, Giants – 42 (36 2/3 IP); Max Scherzer, Nationals – 39 (33 1/3 IP)
Saves
AL: Zach Britton, Orioles – 8; Sam Dyson, Rangers – 8; five players with seven
NL: Nark Melancon, Nationals – 8; A.J. Ramos, Marlins – 8; three players with seven
_______________________________________________________
Finally, a look at full year stats– Team and Individuals
—–TEAM Stats 2016—–
Runs Scored
Al: Red Sox – 878; Indians – 777; Mariners – 768
NL: Rockies – 845; Cubs – 808; Cardinals – 779
Batting Average
AL: Red Sox – .282; Tigers – .267; Rangers/Indians – .262
NL: Rockies – .275; Marlins – .263; D-backs – .261
Home Runs
AL: Orioles – 253; Mariners – 223; Blue Jays – 221
NL: Cardinals – 225; Mets – 218; Rockies – 204.
Nobody scored fewer runs in 2016 than the Phillies (610). In the AL, Oakland had the most anemic offense, with just 653 runs. The worst team batting average belonged to the Padres at .235, while the Tampa Bay Rays were at the bottom of the AL (.243). In the power department, Atlanta notched the fewest home runs with 122, while the Royals were at the bottom of the AL with 147.
Stolen Bases
AL: Indians – 134; Royals – 121; Astros – 102
NL: Brewers – 181; Reds – 139; D-backs – 137
The Baltimore Orioles swiped only 19 bags in 2016 (in just 32 attempts). They were the only team in MLB with fewer than 35 steals and fewer than 60 attempts.
ERA
AL: Blue Jays – 3.78; Indians – 3.84; Mariners/Red Sox – 4.00
NL: Cubs – 3.15; Nationals – 3.51; Mets – 3.58
Only two teams in MLB had ERA’s of 5.00+ in 2016: The D-backs at 5.09 and the Twins at 5.08.
Strikeouts
AL: Indians- 1,398; Astros – 1,396; Yankees – 1,393
NL: Dodgers – 1,510; Nationals – 1,476; Cubs -1,441
Saves
AL: Rangers – 56; Orioles – 54; Mariners – 49
NL: Mets – 55; Miami – 55; Pirates – 51.
When it comes to converting saves, no team topped the Orioles, who converted 79.4 percent of their 2016 save opportunities. The Mets led the NL at 77.5 percent. At the bottom of the save percentage standings were the Reds (52.8%) and the Twins (56.5%).
Batting Average
AL Jose Altuve, Astros – .338; Mookie Betts, Red Sox – .318; Dustin Pedroia, Red Sox – .318
NL: DJ LeMahieu, Rockies – .348; Daniel Murphy, Nationals – .347; Joey Votto, Reds – .326
Home Runs
AL: Mark Trumbo, Orioles – 47; Nelson Cruz, Mariners – 43; three with 42
NL: Nolan Arenado, Rockies – 41; Chris Carter, Brewers – 41, Kris Bryant, Cubs- 39
Run Scored
AL: Mike Trout, Angels – 123; Mookie Betts, Red Sox – 122; Josh Donaldsn, Blue Jays – 122
NL: Kris Bryant, Cubs – 121; Nolan Arenado, Rockies – 116; Charlie Blackmon, Rockies – 111
RBI
AL: Edwin Encarnacion, Blue Jays – 127; David Ortiz, Red Sox – 127; Albert Pujols, Angels – 119
NL: Nolan Arenado, Rockies – 133; Anthony Rizzo, Cubs – 109; Matt Kemp, Braves – 108
The lowest batting average among players with a minimum of 500 plate appearances goes to the Nationals’ Danny Espinosa at .209 (108-for-516). In the AL, the lowest qualifying average goes to the Royals’ Alex Gordon at .220 (98-for-445). Your 2016 strikeout leaders were both named Chris: Chris Davis, Orioles, with 219 whiffs (.221-38-84 line) and the Brewers’ Chris Carter with 206 strikeouts (.222-41-95).
Stolen Bases
AL: Rajai Davis, Indians – 43; three with 30
NL: Villar, Brewers – 62; Billy Hamilton, Reds – 58; Starlings Marte, Pirates – 47
______________________________________________________________
2016 FINAL STANDINGS
Won Lost Pct. GB Sept. Oct.
AL EAST
Boston 93 68 .5xx … (19-8) (0-2)
Baltimore 88 73 .5xx 2.0 (16-11) (1-1)
Toronto 88 73 .5xx 4.0 (11-16) (2-0)
New York 84 77 .5xx 6.5 (14-11) (1-1)
Tampa Bay 67 94 .4xx 19.5 (10-18) (2-0)
AL CENTRAL
Cleveland 93 67 .5xx … (16-11) (2-0)
Detroit 86 74 .5xx 4.5 (14-12) (0-2)
Kansas City 81 80 .5xx 7.5 (12-15) (0-2)
Chicago 78 83 .4xx 13.0 (15-13) (0-2)
Minnesota 58 103 .3xx 27.5 (8-19) (2-0)
AL WEST
Texas 95 66 .5xx … (15-11) (0-2)
Seattle 86 75 .5xx 8.5 (18-9) (0-2)
Houston 84 77 .5xx 11.5 (12-15) (1-1)
Los Angeles 73 88 .4xx 20.5 (14-13) (1-1)
Oakland 68 93 .4xx 22.5 (10-17) (2-0)
AL Tops NL in Interleague Play
The American League had the edge in interleague play this past season – winning 139 interleague contests to 121 for the National League. Overall, eight AL teams had winning interleague records, five had losing records and two split thier 20 internleague contests. In the NL, five teams had positive interleague records, nine were under .500 and one produced a split. The Cubs were the most successful in interleague competition – going 15-5. The Reds and D-backs had the worst interleague records at 5-15.
NL EAST
Washington 94 67 .5xx … (15-12) (2-0)
New York 87 74 .5xx 9.0 (17-10) (1-1)
Miami 79 81 .4xx 11.0 (12-15) (0-2)
Philadelphia 70 91 .4xx 18.0 (10-17) (1-1)
Atlanta 67 93 .3xx 28.0 (16-10) (2-0)
NL CENTRAL
Chicago 102 58 .6xx … (17-10) (1-1)
St. Louis 85 76 .5xx 15.0 (14-14) (2-0)
Pittsburgh 78 82 .4xx 17.5 (11-17) (0-2)
Milwaukee 72 69 .4xx 28.5 (14-13) (2-0)
Cincinnati 68 93 .4xx 30.0 (12-16) (1-1)
NL WEST
Los Angeles 91 70 .5xx … (17-10) (0-2)
San Francisco 86 75 .5xx 1.5 (13-15) (2-0)
Colorado 75 86 .4xx 10.0 (11-16) (0-2)
Arizona 68 93 .4xx 18.0 (11-16) (2-0)
San Diego 68 93 .4xx 18.5 (13-15) (0-2)
I tweet baseball @DavidBBRT
Member: Society for American Baseball Research (SABR); The Baseball Reliquary; Baseball Bloggers Alliance.