As the 2020 MLB season opened, I wondered what impact the strange start to this campaign might have on the players and the game – if any. What would the difference be between a July 23 start, with a brief Summer (Spring) Training and the usual March start with a traditional Spring Training (using last season).
Now, I know this is a small sample and pretty meaningless – so I consider this post to be observation, rather than analysis. Basically, I used “all the games played until all the teams had played a game.” For 2019, that was 17 games (The two Mariners/A’s games in Tokyo on March 20 and 21 and the full slate on March 28). For 2020, it was 16 games (Yankees/Nationals and Giants/Dodgers on July 23 and the remaining teams – plus a second Giants/Dodgers game – on July 24),
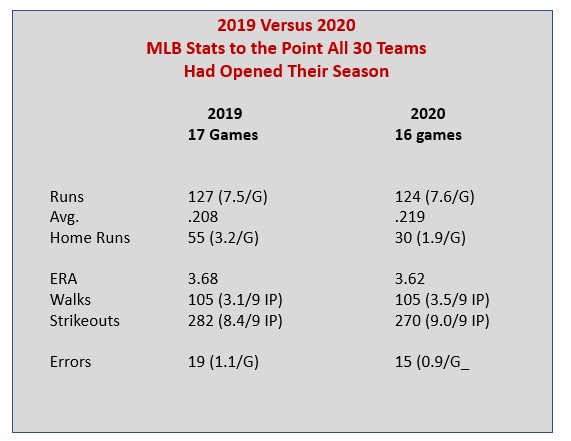
So, what did I observe? As the chart shows most of the stats were pretty similar (again in a small sample size). There were 7.5 runs per game in 2019’s first 16 games compared to 7.6 RPG in 2020’s first 16 contests. The earned run averages in the span were 3.68 for 2019 and 3.62 for 2020. In both samples, pitchers had the upper hand – which you would expect, on Opening Day you get the “aces” – although average-wise, hitters fared a bit better in 2020 (.219 to .208 in 2019).
The major difference was in home runs. The 2019 sample showing 3.2 long balls per game, versus 1.9 in 2020. The raw number on dingers are even more surprising – 55 homers in 2019’s first 17 games, just 30 in 2020’s first sixteen. Lots of possibilities here – adjustments to the baseball, how a ball travels in an empty ballpark, hitters timing due to short preparations. Ironically, there were actually more games with zero home runs in the 2019 sample (seven) than in the 2020 sample (three). Why? In the 2020 “Opener Sample,” the most home runs in any game was three. The 2020 sample had eight games with more than three (one with ten, one with six, three with five and three with four).
Here are a few more statistical observations.
- The fist seventeen games in 2019 saw five shutouts, the first sixteen in 2020 saw four shutouts.
- The 2019 sample had four teams scoring ten or more runs in a game, 2020’s sample just two.
- In 2019’s first seventeen games, both teams played error-free ball in seven contests, versus six such games in 2010’s first 16 match ups.
Ultimately, no conclusions to be drawn. Just thought I share a few numbers with my fellow stats freaks. (By the way, I am into both stats and stories.)
For a poetic look at Opening Day, click here. For some Opening Day records, click here.
Primary resources: Baseball-Reference.com; Stathead.com.
 Baseball Roundtable is on the Feedspot list of the Top 100 Baseball Blogs. To see the full list, click here.
I tweet baseball @DavidBBRT
Follow/Like Baseball Roundtable’s Facebook Page here. More baseball commentary; blog post notifications; PRIZES.
Member: Society for American Baseball Research (SABR); The Baseball Reliquary; The Negro Leagues Baseball Museum.