The Yankees’ Giancarlo Stanton’s two five-strikeout games this season are a sign of the times in major league baseball – a time of hard-throwing pitchers and free-swinging hitters. This post is meant, by the way, not as a judgment – but rather as an observation of how the game has changed and a look at some of the related statistics that caught my eye. Spoiler Alert: This post will appeal most to fellow stat freaks.
Let’s look at a few tell-tale signs of the current homer- and strikeout-heavy era.
THE PLATINUM SOMBRERO
The record for a batter’s strikeouts in a game is five – an accomplishment(?) which earns the mythical “Platinum Sombrero.” As most of you know, Giancarlo Stanton has already had two five-strikeout games this season – and it’s still April. (His five-whiff contests came on April 3 and April 8.) How rare is that? In MLB history, only one other player has two five-whiff games in their career. That distinction goes Toronto Blue Jays’ outfielder Alex Rios, who had five-strikeout games on July 29, 2006 and June 4, 2009.
Overall, there have been 68 five-strikeout games (by 66 players). Here are the documented five-strikeout games totals by decade. Pay particular attention to the numbers since 2000.
—–TOTAL FIVE-STRIKEOUT GAMES BY BATTERS—–
1871-79 1
1880-89 1
1900-09 0
1910-19 0
1920-29 0
1930-39 4
1940-49 1
1950-59 1
1960-69 6
1970-79 9
1980-89 6
1990-99 8
2000-09 17
2010-18 14
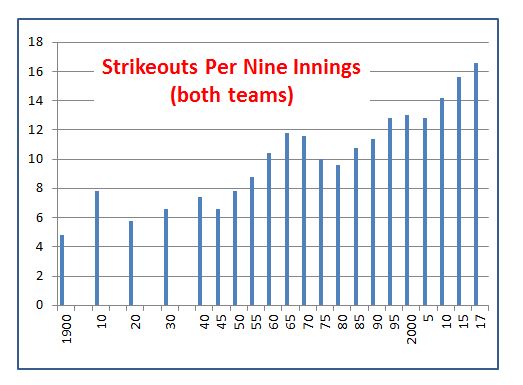
There is no doubt strikeouts are on the rise. In fact, MLB has set a new strikeout record in each of the past ten seasons. In 2017, fans saw an average of 16.6 strikeouts every nine-innings. Here’s the chart.
Looking a bit further, in 2017, 140 MLB players struck out at 100 or more times (Aaron Judge topped MLB with 208 whiffs.). Here’s an historic look.
—–MLB PLAYERS WITH 100+ STRIKEOUTS IN A SEASON—–
Year Number of Players
1910 0
1920 0
1930 0
1940 1
1950 2
1960 7
1970 27
1980 11
1990 37
2000 58
2010 88
2017 140
There are those, of course, who maintain the increased K’s are the price you pay for increased HR’s. And, the chart below would seem to support that. In 2017, we saw the first MLB season with more than 6,000 MLB home runs. A more accurate measure would be home runs per game – and 2017 was a record year there as well.

But there is other evidence to consider.
DO YOU HAVE TO PAY FOR LONG BALLS WITH STRIKEOUTS?
MLB’s three most prolific home run hitters – Barry Bonds, Hank Aaron and Babe Ruth – had one season of more than 100 strikeouts (in a combined 67 MLB campaigns) among them. That came in Bonds’ rookie season (1986), when he fanned 102 times. (In the spirit of “how the game has changed,” we should keep in mind that, while Ruth never fanned more than 93 times in a season, he did lead the league in whiffs five times. Neither Aaron nor Bonds – the other two 700+ HR players ever led the league in K’s.)
In 2017, Aaron Judge and Giancarlo Stanton (now Yankee teammates) hit a combined 111 home runs – and fanned a combined 371 times. In 1961, Yankee teammates Roger Maris and Mickey Mantle hit a combined 115 home runs – but fanned nearly 200 fewer times (179).
A prime example of the potential to combine power and plate discipline would be Ted Kluszewski, who put together three consecutive seasons of 40 or more home runs with 40 or fewer strikeouts. Note: In 2017, five players hit 40 or more home runs. Of these, J.D. Martinez (45 homer runs) had the fewest whiff at 128.
PLAYERS WITH 40 OR MORE HOME RUNS AND 40 OR FEWER STRIKEOUTS
Mel Ott, 1929 – .328-42-151, with 38 strikeouts,
Lou Gehrig, 1934 – .363-49-165, with 31 strikeouts
Joe DiMaggio, 1937 – .346-46-167, with 37 strikeouts
Johnny Mize, 1948 – .289-40-125, with 37 strikeouts
Ted Kluszewski, 1953 – .316-40-108, with 34 strikeouts
Ted Kluszewski, 1954 – .326-49-141, with 35 strikeouts
Ted Kluszewski, 1955 – .314-47-40. with 40 strikeouts
A UNIQUE 50-HOMER CAMPAIGN
Johnny Mize is the only player to record a season of 50 or more home runs and 50 or fewer strikeouts. In 1947, Mize hit .302-51-138, with just 42 whiffs.
One final reflection. MLB has seen a total of ten player seasons of 200 or more strikeouts (a total of six players) – and all have occured since 2008. In fact, 45 of the top 51 batter-strikout seasons have occured since 2000 – and the top 25 strikeout seasons (by a batter) have all occured since 2004 (18 of those 25 since 2010).
As the 2018 season unfolds, we can continue to expect high strikeout and home run totals. Pitchers are throwing harder, relief pitching is as – if not more – dominant than ever and batters seem to be increasing focused on going deep. As I write this post, MLB teams are averaging just over two home runs (combined) per game and a combined 17.3 strikeouts per nine frames – and that’s despite some pretty frigid weather across much of baseball. We’ve also see this trend reflected in an increasing interest in statistics like pitch velocity, spin rate and swinging strike percentage, as well as batted ball exit velocity and launch angle. Good for the game? Don’t know. Only time will tell. (Although I, admittedly, prefer more action on the base paths and in the field – and less trotting around the bases or back to the dugout.)
By the way, if you are interested in a look at how BBRT readers see today’s game – with opinions on everything from the length (time) of games, the designated hitter, record-breaking performances they would like to witness, favorite ballpark concessions and even Hall of Fame controversies, click here.
I tweet baseball @DavidBBRT
Follow/Like the Baseball Roundtable Facebook page here.
Member: The Society for American Baseball Research; The Baseball Reliquary; The Negro Leagues Baseball Museum.