Archives for January 2024

Roundtable Readers versus Baseball Writers – The 2024 Baseball Hall of Fame Results

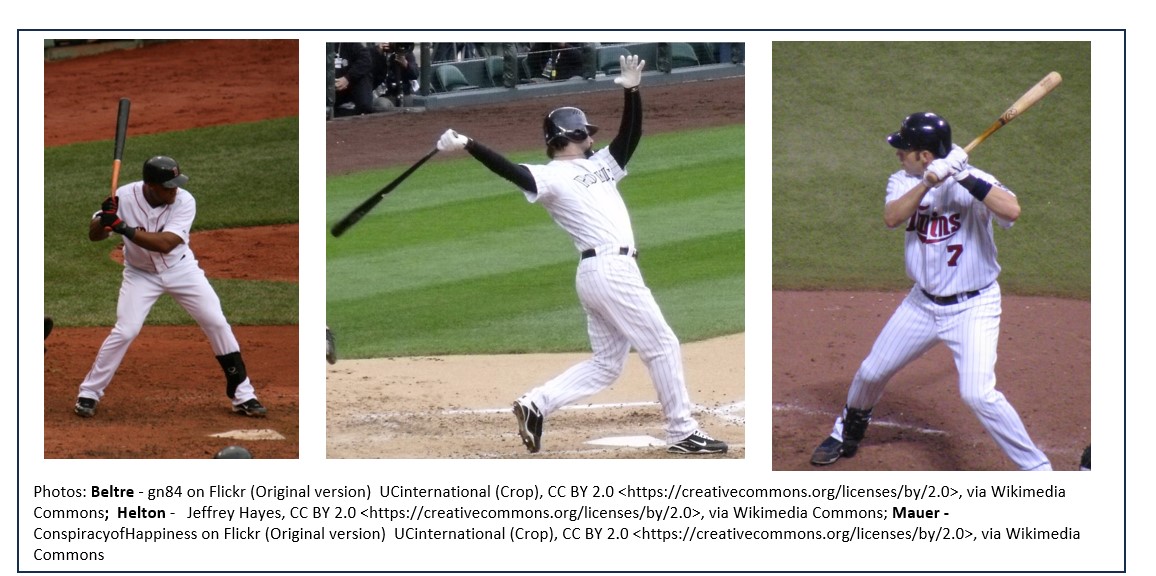
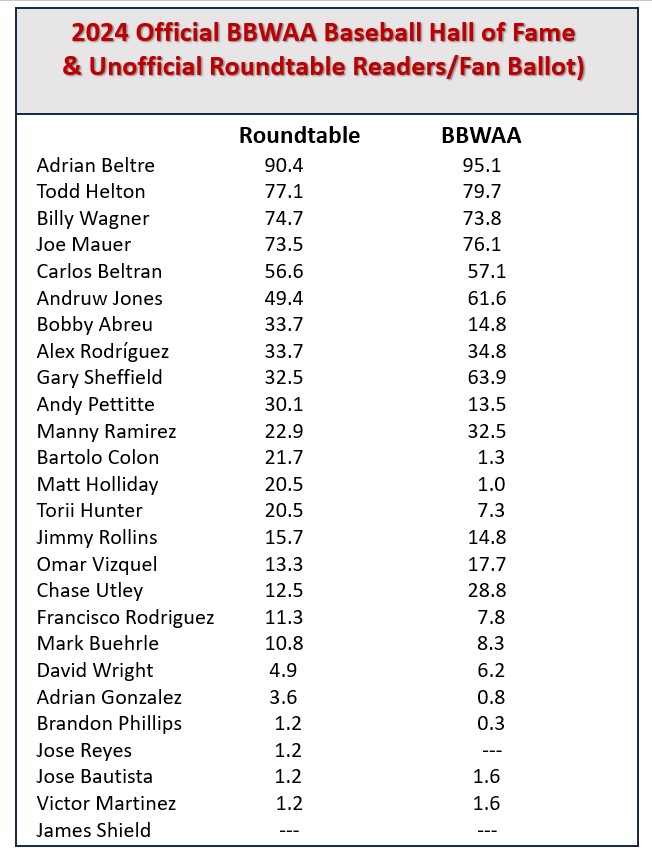
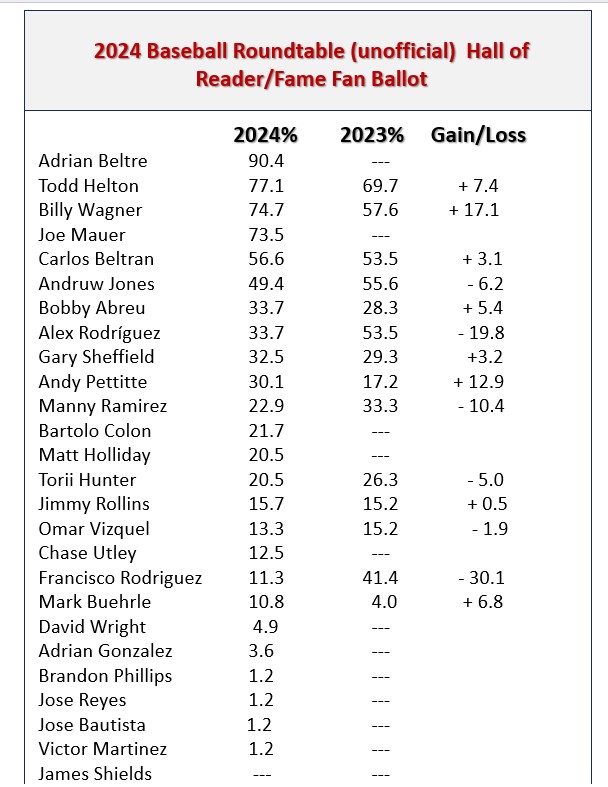
The 2024 Baseball Writers of America Baseball Hall of Fame ballots have been announced – and congratulations to Adrian Beltre, Todd Helton and Joe Mauer – worthy candidates all.  In this post, I’ll be taking a look at the differences (and similarities) between the official BBWAA results and Baseball Roundtable’s unofficial reader/fan balloting.  YOu’ll find some (handy?) charts at the end of the post.

Spreading Out the Love

The 83 reader respondents and the 385 official BBWAA voters voted for about an equal number of players per ballot.  The writers averaged 7.0 players per ballot, the readers 6.9 (a year ago, those figures were 5.9 and 6.2, respectively). The readers, however, spread out their support a bit more. Among readers 14 of the 26 players on the ballot (53.8%) got at least 20 percent of the vote, as compared to ten (38.5%) for the writers.

Getting that Magic 75 Percent

Among readers, only two players received the 75-percent support required in the BBWAA voting – First-time candidate Adrian Beltre (90.4%) and Todd Helton (79.7% in his sixth year on the ballot). Coming very close were first-timer Joe Mauer (73.5%) and nine-timer Billy Wagner (74.7%.) The most significant difference, of course, was that Mauer got the necessary 75-percent support among the writers, but fell short among Roundtable readers.  In reality, it was not much of a difference.  Mauer got 76.1 percent of the writer vote and 73.5 percent among Roundtable reader respondents. (Two more reader votes would have put him at 75.9%.)

The top four players on both tabulations were: Beltre, Helton, Joe Mauer and Wagner (although Wagner and Mauer finished 3-4 with the writers and flipped to 4-3 for the readers.)

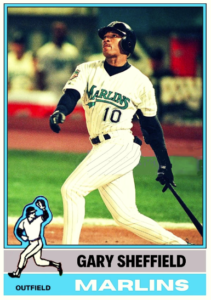
The biggest variable came at number five, where Gary ‘Sheffield got a boost from the writers in his final year on the ballot, going from 55,0% to 63.9, but still falling short. Sheffield finished ninth on the reader voting at 32.5%.

Other notable variations:

  • First-timer Bartolo Colon long a fan favorite, got 21.7 percent of the reader vote to just 1.3 percent from the writers;
  • Chase Utley got 28.8 percent support from the writers, but just 12.5 percent from readers.
  • Matt Holliday fell of the ballot with only 1.0 percent the writers, but got 20.5 percent of the reader vote.

Gainers and Losers

The biggest gainers on the fan ballot were Billy Wagner (up 17.1 percentage points) and Andy Pettitte (up 12.9).  The largest declines were Francisco Rodriguez  (down 30.1 percentage points) and Alex Rodriguez (down 19.8).  Note: Francisco Rodriguez was a bit outlier in 2023, with 42.4 percent in the reader balloting and just 10.8 percent from writers. Things were more aligned in 2023, 7.8 percent  from the writers and 11.3% from the readers.   

In the official BBWAA voting the movement was not as notable.  biggest gainers were Carlos Beltran (up 10.6 percentage points) and Gary Sheffield (up 8.9) while the largest decline was attributed to Andy Pettitte (down 3.5 percentage points).

Off The Ballot

Things were pretty even here.  Eight players receive less than the five percent needed to stay on the official ballot, while seven fell below that mark on the reader ballot. A couple of differences:

  • David Wright made the cut on the writers’ ballot (6.2%), but fell just short on the readers’ poll (4,9);
  • Bartolo Colon, as noted earlier, did well with readers, but  got only 1.3 percent from writers. The same was true of Matt Holliday, with 20.5 percent from readers, just one percent from writers.

Who Missing?

When asked which players no longer on the ballot, they would like to see in the Hall of Fame, readers named 33 different players. Here’s a list of the players mentioned on more than one reader ballot (number of mentions in parentheses).

Barry Bonds (9)

Roger Clemens (9)

Jeff Kent (9)

Lou Whitaker (6)

Pete Rose (5)

Don Mattingly (3)

Mark McGwire (3)

Dick Allen (2)

Dwight Evans (2)

Bobby Grich (2)

Ron Guidry (2)

Keith Hernandez (2)

Thurman Munson (2)

Luis Tiant (2)

Players with one mention: Ken Boyer, Jim Creighton, Bill Dahlen, Rap Dixon, Curt Flood, Steve Garvey, Joe Jackson, Tommy John, Kenny Lofton, Roger Maris, Dale Murphy, Joe Nathan, Al Oliver, Rafael Palmeiro, Dave Parker, Johan Santana, Curt Schilling, Urban Shocker, Sammy Sosa.
Side Note: Still waiting for confirmation, but the winner of the prize drawing was a Pennsylvania reader.  The prize includes a 1990 Topps Set; A 1986 Topps Traded Set; a Bill Murray minor-league (in uniform) bobblehead; a “The Wizard” replica Cardinals’ Nickname Day jersey; and 1960’s Coke and Fresca bottlecaps with Willie Mays and Bill Mazeroski on the inside.

Primary resources:  baseball-reference.com

Baseball Roundtable – Blogging Baseball Since 2012.

100Baseball Roundtable is on the Feedspot list of the Top 100 Baseball Blogs.  To see the full list, click here.

Baseball Roundtable is also on the Anytime Baseball Supply Top 66 Baseball Sites list.  For the full list, click here

I tweet (on X) baseball @DavidBaseballRT

Follow Baseball Roundtable’s Facebook Page here

Member: Society for American Baseball Research (SABR); Negro Leagues Baseball Museum; The Baseball Reliquary.

P1021

An Exercise in Futility – Bad Days in the Batter’s Box

Most baseball fans are aware of the fact that on May 1, 1920, the Brooklyn Robins and Boston Braves played in MLB’s longest-ever (by innings) MLB game – a 26-inning 1-1 tie in Boston. It’s also well-known that both starting pitchers Joe Oeschger and Leon Cadore “went the distance.”  Those are a couple of records (length of game and length of a pitching appearance), that are pretty much unbreakable.

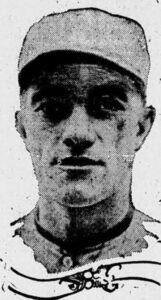
Photo: Public domain, via Wikimedia Commons

A Good Pick for A tough Day as a “Hitter

As always with Baseball Roundtable “one thing leads to another” and perusing the box score of that Oeschger/Cadore game led to another record that has stood the test of time.  Braves’ 2B Charlie Pick – batting second, did not reach base a single time in eleven plate appearances. That zero-for-eleven represents the MLB record for plate appearances in a game without reaching base, as well as the record for the most times a specific batter was retired by the same in pitcher in the same game (in baseball, we do track everything).   This, of course, was another thing that led to another – and this post will look at some of the most futile days spent in the batter’s box in MLB history.

But first, let’s finish with Charlie Pick.  Pick was no pushover. He came into the game hitting a robust .324 over the Braves’ first nine games of the season. (He would finish the season at .274.) Here’s how his day went:

  • First inning – Pop out to second;
  • Third inning – Foul pop to catcher;
  • Fifth inning – Fly out to RF;
  • Seventh inning – Ground out to pitcher;
  • Ninth inning – Grounded into a second-to-first double play;
  • Twelfth inning – Fly out to CF;
  • Fourteenth inning – Strikeout (looking);
  • Sixteenth inning – Ground out second-to-first;
  • Nineteenth inning – Fly out to RF;
  • Twenty-second inning – Fly out to CF;
  • Twenty-fifth inning – Pop out to shortstop.

Over the course of the game, Pick’s average dropped from .324 to .250.

Pick played in six MLB seasons (1914-16, 1918-20 … Nationals, Athletics, Cubs, Braves), hitting .261-3-86 in 367 games.

Side note: The only other player in the Braves’ lineup that went hitless that day was catcher Mickey O’Neil – and he was pulled for a pinch hitter in the bottom of the ninth after going zero-for-two with a sacrifice bunt.

A Hard Day’s Night

The only other player to record a .000 on-base percentage in eleven plate appearances in a single game is Twins’ shortstop Danny Thompson – and he falls slightly behind Pick here, since Thompson actually got on base once (via a fielder’s choice) and scored a run. On May 12, 1972, Thompson went zero-for-ten, with two strikeouts and one sacrifice in 11 plate appearances, as the Twins fell to the Brewers 4-3 in 22-innings (in Milwaukee).   Side note: Scoring rules on  a fielder’s choice are that the players is not credited with a hit or time on base, but does record  an at bat and plate appearance. )

Thompson’s feat was a bit unique in that it took place over two days. The first 21-innings took the teams into the morning of May 13 and – due to the rule that no inning could start after one a.m., the game was suspended with the score knotted at three apiece.  After a break of just over 12 hours, the game was resumed and the Brewers won it in the very first resumed inning. Unlike the 26-inning Robins/Braves game (above), the two teams used 13 pitchers and Thompson faced five different Brewers’ hurlers (the Brewers used six pitchers).  Fittingly, Thompson made the final out of the game (in the bottom of the twenty-second inning, facing Jim Lonborg.)

Thompson entered the game hitting .333 over 18 games. At the end of the 22 innings, his average was .294.  For the season, Thompson hit .276-4-48 over 144 games.  In a seven-season MLB career (1970-76 … Twins, Rangers), Thompson hit .248-15-194 in 694 games.  Thompson passed away on December 10, 1976, at the age of 29, from complications related to leukemia.

For those who like to know such things – the losing pitcher in the May 12 game was the Twins’ Bert Blyleven, who came in (after the suspension) to pitch the top of the twenty-second inning. After that one inning of work, Blyleven started the regularly scheduled May 13 game and pitched nine innings (three runs) in a 5-4, 15-inning Twins loss.  The winner in the May 12 game was the Brewers’ Jim Colborn, who pitched the fifteenth through the twenty-first innings (six hits, no runs). Lonborg got the save in the May 12 game – coming in on May 13 to pitch the final inning of the suspended contest. Lonborg then started the regularly slated May 13 contest and went four innings (six hits, five walks, three runs).  


April 15 … A Taxing Day for This Met

On April 15, 1968.  Mets’ RF and clean-up hitter Ron Swoboda fanned five times and went zero-for-ten, as the Mets lost to the Astros 1-0 in 25 innings (in Houston).  It’s the most strikeouts by any player in a game in which he had double-digits in plate appearances and a.000 on-base percentage. Surprisingly, the clean-up hitter ending up leading off an inning in six of his ten plate appearances. Swoboda’s game:

Second inning – Lead off fly out to RF of Don Wilson;

Fourth inning – Lead off pop out to first base off Wilson;

Sixth inning – One out (no one on base) strikeout off Wilson;

Eighth inning – Two out (no one on) strikeout off Wilson;

Eleventh inning – Lead off strikeout off John Buzhardt;

Thirteenth inning – Lead off fly out to CF off Danny Coombs;

Sixteenth inning – Lead off flyout to CF off Jim Ray;

Eighteenth inning – Two out (no one on) strikeout off Ray;

Twenty-first inning – Lead off strikeout off Wade Blasingame;

Twenty-third inning – Two out (no one on) flyball to RF off Blasingame.

Sidenote:  The second most strikeouts by a player with a zero on-base percentage in a game with at least ten plate appearances is four – by Swoboda’s teammate CF Tommy Agee in the same game.

Swoboda came into the game hitting .385 on the seasons (just four games) and left the field hitting .217.  He hit .242-11-69 on the season and .242-73-344 over his nine-season MLB career (1965-73 … Mets, Expos, Yankees).

Mirror Images?  More Roundtable “#one thing leads to another.”

The April 15, 1968 Mets Astros game went longer without a run scoring than any other game in MLB history. For the game:

  • Each time had one hit in 79 at bats – so each had a .139 average for the game;
  • Each team had ten singles and one double – each team had a .152 slugging percentage;
  • Each team left 16 men on base.
  • Each team made one error.
  • Each am turned one double play.
  • Each tram used four pinch hitters.

___________________________________________

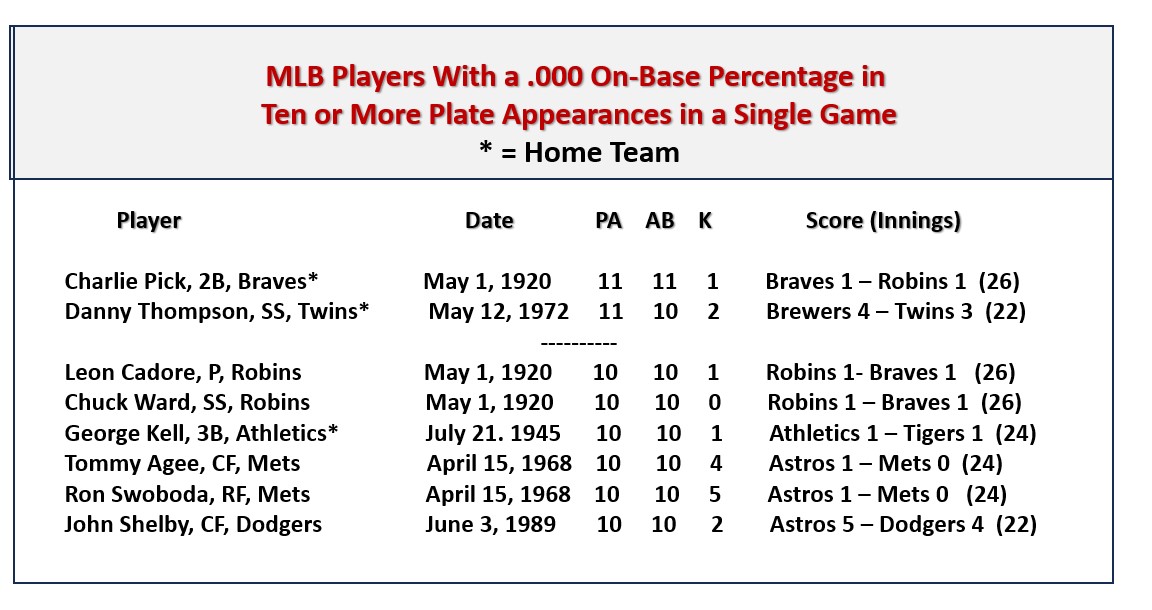
Before we move on to some strikeout marks, the chart below shows all the MLB players with a .000 on-base percentage in a game of ten or more plate appearances. A few notes:

  • As you might expect, all the games were at least 22 innings;
  • The May 1, 1920, 26-inning Braves/Robins game accounts for three of the eight qualifiers;
  • Robins’ SS Chuck Ward is the only person to not strike out a single time while qualifying for this list;
  • Five games are included on the list and two of the five ended in 1-1 ties.

——–SOME STRIKING PERFORMANCES——–

Just eight players have fanned six times in an MLB game – and each of those instances came in an extra-inning contest. Lets’ take a look at some of those performances.

A Perfect Six-for-Six … Cark Weilman and Alex Gonzalez

The 1913 St. Louis Browns’ Carl Weilman was the first player to strikeout six times in a game in which he had just six plate appearances. We can probably forgive him, though.  He was after all, a pitcher (and he wasn’t even slated to pitch that day.

On July 25, 1913, Weilman was called on in relief with one out in the first innings of the Browns-Nationals tilt (In Washington). Browns’ starter George Baumgardner had given up hits three hits (two home runs) while retiring just one batter. Weilman came in and finished the contest, which ended in an 8-8, 15-inning tie.

Unfortunately for Weilman, the Senators’ first two pitchers did not fare well and future Hall of Famer (and ultimately 12-time AL strikeout leader) Walter Johnson pitched 11 1/3 innings  in relief for the Senators. Four of Weilman’s six whiffs were against Johnson. Of course, Weilman wasn’t the only one to have trouble with Johnson’s offerings.  The Big Train fanned 15 batters in his 11 1/3-inning relief stint.

Carl Weilman, who fanned a record six times in six plate appearances on July 25, 2012 also recorded six strikeouts as a pitcher that day. 

Weilman pitched in eight MLB seasons (1912-17, 1919-20), all for the Browns.  He went 84-93, 2.67.  At the plate, he hit .170-0-25 in 560 plate appearances.  Waler Johnson?  Well, you know all about him.

Another “Six-for-Six” Strike outing.”

Among positions players, Blue Jays’ SS Alex Gonzalez matched Weilman’s six-whiffs in six plate appearances on September 9, 1998 – as the Blue Jays lost to the Indians (in Toronto) 6-3. Gonzalez, batting ninth, enjoyed this day:

Second inning – Two out (two on bae) swinging strikeout versus Dwight Gooden;

Fourth inning – Two out (one on) swinging strikeout versus Gooden;

Seventh inning – One out (none on) swinging strikeout versus Gooden;

Ninth inning – Two out (none on) swinging strikeout versus Paul Shuey;

Eleventh inning- Two out (two on) strikeout looking versus Doug Jones;

Thirteenth inning – One out (one on) swinging strikeout versus Michael Jackson.

Equal Opportunity (or more #InBaseballWeCountyEverything)

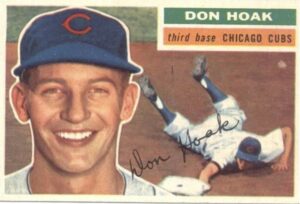
Don Hoak shares the record for strikeout in a game and holds the record for being struck out by the most different pitchers in a game.  On May 2, 1956, Hoak – playing third base and leading off for the Cubs – came to the plate nine times in a Cubs 6-5, 17-inning loss to the Giants. He collected a single, a walk, a sacrifice and six whiffs (tying the MLB record for strikeouts in a single game).

The Giants used eight pitchers in the game, and Hoak was fanned by six of them: Al Worthington; Don Liddle; Hoyt Wilhelm; Steve Ridzik; Wendy McCall; and Ruben Gomez.

Hoak, by the way, almost didn’t get that sixth whiff.  In the bottom of the final (seventeenth) inning and the Cubs down 6-5, the first two Cubs hitters were retired by Joe Margoneri. Cubs’ Pitcher Jim Brosnan was up next and the Cubs sent Clyde McCullough up to pinch hitMcCullough doubled, bringing up Hoak. Ruben Gomez was brought in to pitch and Hoak fanned to end the game.

______________________________________

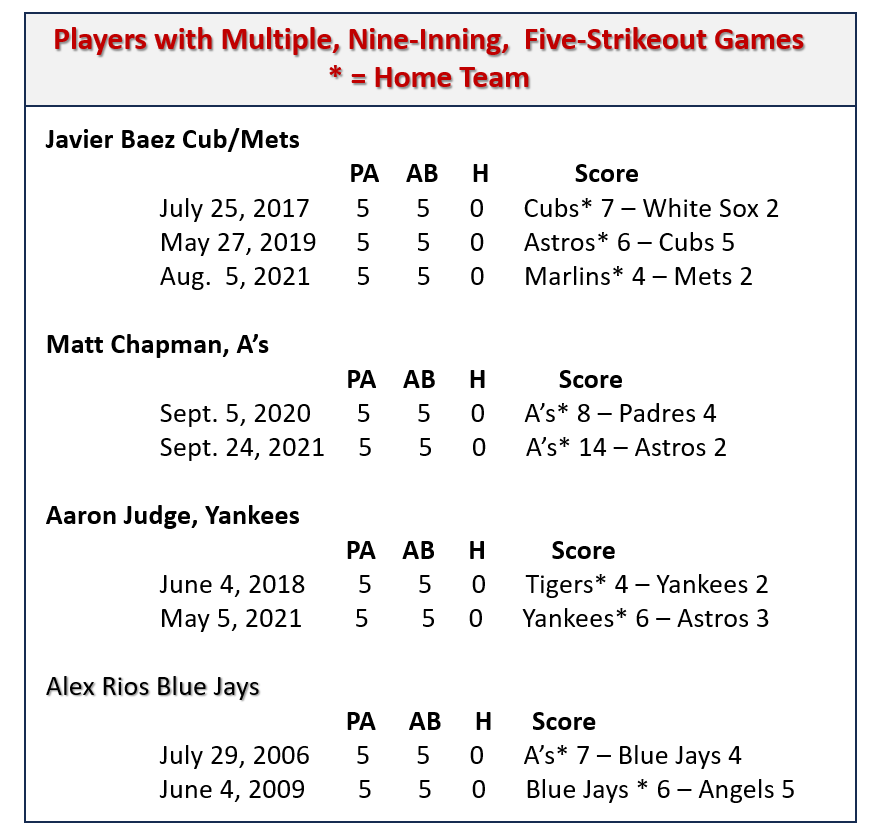
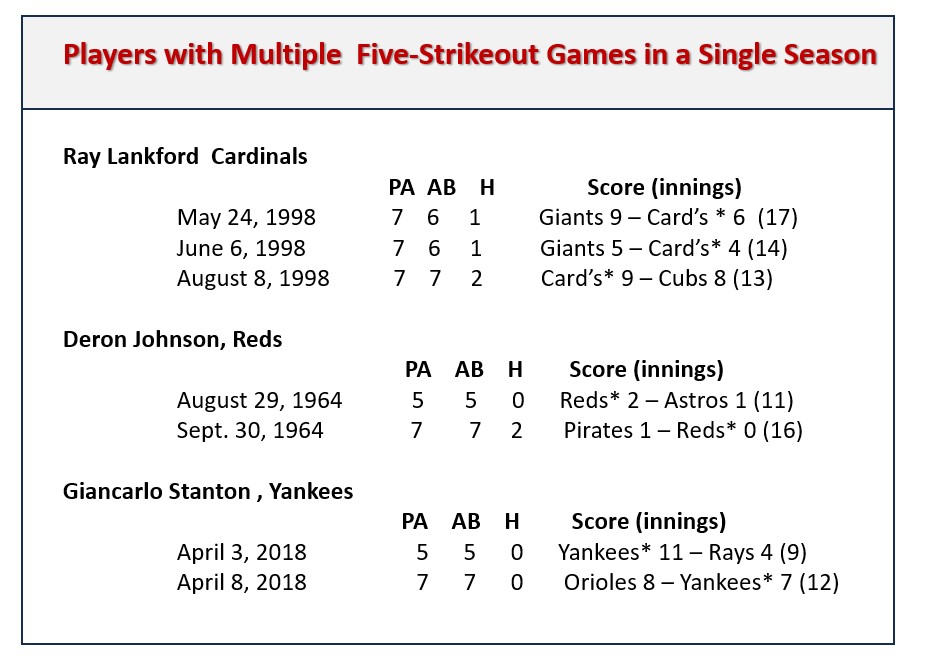
Now, Let’s move on to five-strikeout games. There have been 199 of them – nothing very rare air there. Of those 199, 89 have been nine-inning contests.  Still not very rare. There have, however, also just 20 players with multiple five strikeout games.  So, let’s go there

We’ll start with players with multiple,  five-strikeout game – all of nine innings.

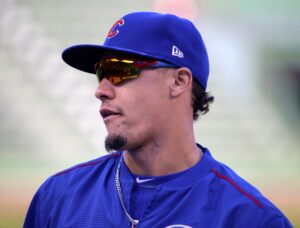
Photo: Arturo Pardavila III from Hoboken, NJ, USA, CC BY 2.0 <https://creativecommons.org/licenses/by/2.0>, via Wikimedia Commons

Javier Baez leads the way there, with three such games. One each in 2017, 2019 and 2021.  The opposing starting pitchers in those contests were: Carlos Rodon in 2017; Gerrit Cole in 2019; and Braxton Garrett in 2021.

Baez, still active, has 10 MLB seasons on his resume (2014-23 … Cubs, Mets, Tigers), His stat line is .256-175-591. Over his 1,142 MLB games, he has fanned 1,225 times – leading the league once (184 in 2021) and topping 150 whiffs in three seasons. His best season was 2018, when he hit .290, with 34 homers and a league-leading 11l RBI for the Cubs.

As the chart below show, multiple nine-inning strikeout game are a bit of a rarity.


Now, how about five strikeout games -including extra-inning tilts.

Number One in Platinum Sombreros

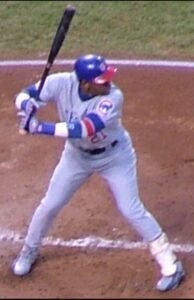
Photo: Jeffrey Hayes, CC BY 2.0 <https://creativecommons.org/licenses/by/2.0>, via Wikimedia Commons

Sammy Sosa leads the way here with four five-whiff games – one each in 1990, 1996, 2000 and 2003.  The starting pitchers in those games were Tom Gordon; Dave Burba; Kip Wells; and Roy Oswalt. Sosa, is not a total surprise on this list. In 18 MLB seasons (1989-2005, 2007 … Rangers, White Sox, Cubs, Orioles, he  fanned 3,306 times in 2,354 games. He led the league in whiffs three times and fanned 150 or more times in six seasons.  He put up a pretty good offensive stat line despite the whiffs – .273-609-1,667 for his career. Sosa was a seven-time All Star, and the 1998 National League MVP – when he went ,308-66-158 for the Cubs. Sosa the league in runs scored three times, home runs twice and RBI three times.

Three is Company … or not

Ray Lankford has no company among players with three five-strikeout games in a single season. (See the  chart  immediately above or the chart at the end of at end of post. Yes, Lankford made it to two charts.)  The Cardinals’ outfielder “accomplished” the feat in 1998 – racking up five-strikeout games on May 24, June 6 and August 8.    Still. Lankford had a solid 1998 season, hitting .298-31-105, with 26 steals (151 strikeouts, his career high).  Lankford played in 14 MLB seasons (1990-2002, 2004 … Cardinals, Padres).

Let’s Get This Over with Fast

Ray Lanford may have racked up three five-whiff games in a single season, but Giancarlo Stanton had two five-strikeout games in less than a week.   On April 3, 2018 – as the Yankees lost to the Rays 11-4 in New York, Stanton went zero-for-five with five strikeouts. Playing LF and batting third in the lineup, his day went like this:

First inning – Two-out (no one on base) swinging strikeouts versus Chris Archer.

Third inning -No out, (two on) strikeout looking versus Archer.

Fifth Inning – One out (one one) swinging strikeout versus Archer.

Seventh Inning – One out (two on) swinging strikeout versus Austin Pruitt;

Eighth inning – One out (bases loaded) swinging strikeout versus Sergio Romo.

Then, just five days later (April 8), in a 12-inning  8-7 loss to the Orioles (in Yankee Stadium), Stanton (batting third and playing RF) had another five-whiff game – wit one strikeout against five different pitchers.

First inning – No outs (two on base) strikeout looking versus Mike Wright, Jr.

Second inning – One out (none on) strikeout swinging versus Pedro Araujo;

Fourth inning – Two out (one on) strikeout looking versus Miguel Castro.

Sixth inning – Could things get worse? One on, one out, Stanton swing at the first pitch from Tanner Scott and lined into a double play.

Eighth inning – One out (one on) strikeout swinging versus Darren O’Day;

Tenth inning – Two out (two on) First-pitch swinging, Stanton grounded into a force out at second.

Twelfth inning – With one on and two out, Stanton struck out on four pitches versus Brad Bach to end the game.

The two five-whiff games were the bookends of a six-game stretch during which Stanton came to the plate 30 times (28 at bats) and fanned 16.  For the 2018 season, Stanton hit .266-38-100 and fanned 211 times in 705 plate appearances.  To date, Stanton has fanned 1,820 times in 1,535 MLB games (2010-2023 … Marlins, Yankees).  His stat line is .259-402-1,031. He has fanned more than 150 times in five seasons. Stanton is a five-time Al Star and was the AL MVP in 2017, when he hit .281, with a league-leading 59 home runs and a league-best 132 RBI in 159 games for the Marlins. He has topped 30 home runs in seven seasons.


Primary resource:  Baseball-References.com


Baseball Roundtable – Blogging Baseball Since 2012.

100Baseball Roundtable is on the Feedspot list of the Top 100 Baseball Blogs.  To see the full list, click here.

Baseball Roundtable is also on the Anytime Baseball Supply Top 66 Baseball Sites list.  For the full list, click here

I tweet (on X) baseball @DavidBaseballRT

Follow Baseball Roundtable’s Facebook Page here

Member: Society for American Baseball Research (SABR); Negro Leagues Baseball Museum; The Baseball Reliquary.

P1020

Off-Season Musings … More Rarities and Oddities … 20-Loss Seasons

The Reverse Unicorn

Since 1980, only two pitchers have “achieved” twenty or more losses in a single season. In that same span, there have been 131 pitcher seasons of twenty or more wins.

Regular readers of Baseball Roundtable know how my mind tends to wander during the off-season – leading to the exploration of a wide range of baseball topics (particularly rarities and oddities). Admittedly as “One thing seems to lead to another,” these posts can at times seem like watching a series of unrelated slides (I hope most of you remember slides).  Each post, however, can be traced to an overarching theme. Most recently, there were posts on 20-game winners (click here for that one), 100-RBI seasons (click here) and zero-home run seasons (click here).

This foundation of this post will a what I consider a reverse unicorn, the increasingly rare pitcher-seasons of 20 or more losses.

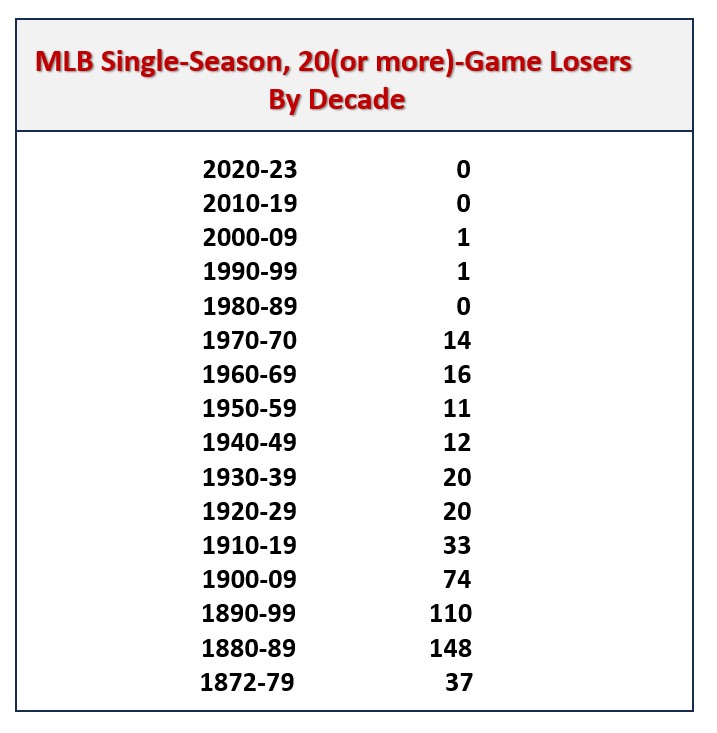
How rare have 20-loss seasons become?  As noted earlier, they have been only two 20-loss seasons since 1980.  The last 20-loss campaign belongs to the Tigers’ Mike Maroth, who went 9-21, 5.73 in 2003. (More on that later). As the chart below shows 295 of the 499 20-loss seasons (59.1%) occurred before 1900 … and the appearance of these reverse unicorns” has dwindled steadily since.

The 1884 season saw the most 20-loss campaigns, as 25 pitchers reached or exceeded twenty defeats. (The 1884 season featured 33 majo- league teams … National League, Union Association and American Association.) Notably, 12 of those pitchers also won 20 or more games and eight finished above .500.

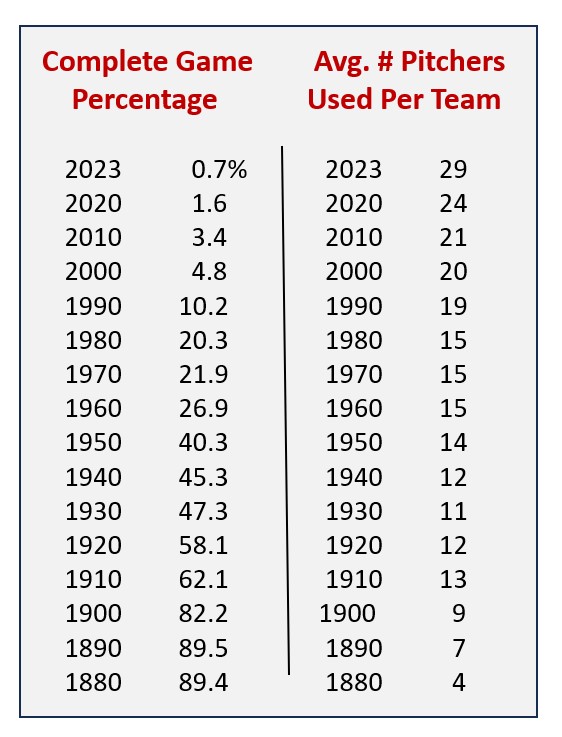
There are some pretty obvious reasons for this, centered around pitcher usage.  Over the years, such factors expanding rotations (from two-to-five or more pitcher rotations), larger pitching staffs and relief specialists (middle men, set-up men, closers), pitch counts (and fewer complete games) all have helped make it harder for a pitcher to reach 20 losses (or twenty wins, for that matter). Consider, in 1890, 37 pitchers started 35 or more games (eight of those had 50-plus starts). In 2023, only one pitcher – Mike Mikolas of the Cardinals – accrued 35 starts. We’ll get to why I picked 35 starts as a focus point in a bit.

That chart below illustrates some the change MLB has seen – as complete games have plummeted and the number of pitchers used by teams each season had risen. In sheer raw numbers, 2003 saw 35 complete games in 4,869 starts; 1960 saw 665 complete games in 2,472 starts; and 1890 saw 2,879 complete games in 3,218 starts.

Now, as to my observation of the “sweet spot” for 20 losses (or twenty wins) – historically two of every three seasons of twenty or more losses (or twenty or more wins) belong to a pitcher with 35 or more starts.

Now, this post is about 20-game losers, so I thought I better start to steer this ship back in that direction. I went back to 1974, the last season MLB saw at least five 20-game losers: Steve Rogers (Expos, 15-22, 4.47), Bill Bonham (Cubs, 11-22, 3.86), Randy Jones (Padres, 8-22, 4.45), Mickey Lolich (Tigers, 16-21, 4.15) and Clyde Wright (Brewers, 9-20, 4.42).  A few comparisons:

  • These five (the five losingest pitchers in MLB in 1974) had a cumulative 181 starts, with 67 complete games and 28 complete-game losses. MLB’s five winningest pitchers in 20023 (Spencer Strider, Zac Gallen, Chris Bassitt, Zach Elfin and Justin Steele) had 160 starts, two complete games and zero complete-game losses.
  • 1974’s five 20-game losers had 67 complete games and 28 complete-game losses, while all of MLB saw just 35 complete games and seven complete-game losses in 2023.

A Unicorn

The Kansas City Royals’ Jordan Lyles tied for the major-league lead in complete games in 2023 (with three).  All three of his complete games were losses – and I can find no other instance of the MLB leader in complete games recording not a single complete-game victory. Lyles’ final line on the season, 6-17, 6.28.

Now, let’s look at some rarities and oddities among 20-game losers.

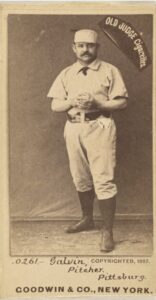
Pud Galvin – King of the 20-Game Losers

Photo: Goodwin & Company, CC0, via Wikimedia Commons

If the corps of 20-game loser had a king, his name would be James Francis “Pud” Galvin – who holds the MLB record for 20-loss seasons at ten, and who rang them up consecutively 1879-1888. Galvin, however, was clearly no loser – pitching his way into the Baseball Hall of Fame with a 365-310, 2.85 record over 15 MLB seasons (1875, 1879-1892 … St. Louis Brown Stockings, Buffalo Bisons, Allegheny City, Pittsburgh Burgers, St. Louis Browns.)

_______________________________

Pud Galvin recorded MLB seasons of twenty or more losses in the National League, American Association and Players League.

_______________________________

In his ten-year streak of season with 20 or more losses, Galvin seven times won more games than he lost. Galvin was known for pinpoint control of his fastball, fine fielding and an exceptional pickoff move that spurred many protests from opposing players, coaches and managers.

Galvin’s best seasons were 1883 and 1884, with the National League Buffalo Bisons.  In 1883, Galvin went 46-29, with a 2.72 earned run average and led the league in games (76), starts (75), complete games (72), shutouts (five) and innings pitched 656 1/3.  He followed that up with an 1884 campaign that again included 46 wins (22 losses), 71 complete games in 72 starts, 636 1/3 innings pitched and a league-leading 12 shutouts.  It truly was a different game back then. Consider Buffalo had a 116-92-5 record over those two seasons and Galvin started 148 (80%) and completed 147 of those 183 games.

Those Were The Days, My Friends

During his streak of ten consecutive 20+loss season, Galvin went 301-253, 2.71 and threw 535 complete games in 573 starts.

During his career, Galvin had ten seasons of 20 or more wins and ten seasons of 20 or more losses.  He reached both figures in nine seasons. Surprisingly, he never led his league in wins or losses.

__________________________

The Most Recent 20-Game Loser – Mike Maroth

Photo: Wknight94, CC BY-SA 3.0 <http://creativecommons.org/licenses/by-sa/3.0/>, via Wikimedia Commons

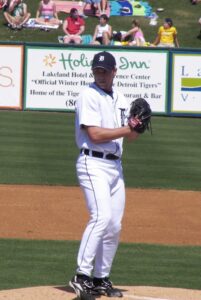
Southpaw Mike Maroth is the most recent 20-game loser.  Maroth went 9-21, 5.73 for the 2003 Tigers, a team that went 43-119 and finished in last place (47 games off the pace) in the AL Central Division. Maroth may have been the “ace” of the Tiger staff (he was the Opening Day starter). Maroth led the Tigers in wins, and starts – no other Tiger hurler won more than six games that season.

Consistency

After ten starts, Maroth was 0-9, 5.73 (right where his season-ending ERA stood).

Maroth had a six-season MLB career (2002-07 … Tigers, Cardinals), going 50-67, 5.05.

______________________________

Searching for a Won-Lost Rarity

Looking through records, I found that 126 of the 499 seasons (25.3%) of 20 or more losses saw the pitcher lead the league in losses. No rare air there.  Twenty of those 499 seasons (four percent) saw a pitcher with 20 or more losses lead the league in wins. Rarer, but hardly unicorn status.  Ah, but wait, how about 20-game losers who led their league in both wins and losses?  Bingo, just two!

Jim Whitney, 1881 Boston (National League)

Jim Whitney, as a hard-throwing 23-year-old rookie, went 31-33 for the 1881 Boston NL squad, leading the National League in both wins and losses. He put up a 2.48 earned run average (the league average was 3.13) and led the NL in games (66), starts (63) and complete games (57). Whitney went on to a 10-season MLB career (1881-1890 … Boston, Kansas City Cowboys, Washington Nationals, and Indianapolis Hoosiers and the American Association Philadelphia Athletics).  He had five seasons of 20 or more wins and seven seasons of 20+ losses – producing a career stat line of 191-204, 2.97.

Phil Niekro, 1979 Atlanta Braves

Photo: Texas Rangers via tradingcarddb.com, Public domain, via Wikimedia Commons

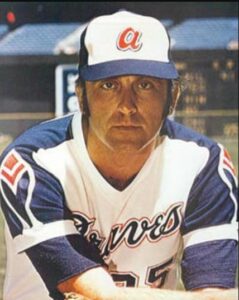
In 1979, knuckleballer – and future Hall of famer – Phil Niekro became just the second pitcher to lose 20 or more games and lead his league in wins and losses in the same season. Pitching for a Braves’ squad that went 66-94, Niekro went 21-20, 3.39, leading the NL in starts (44), complete games (23), innings pitched (342) – as well as in home runs allowed (41), walks (113) and hit batsmen (11).  Adding to the oddity, Niekro tied for the NL lead in wins … with his brother Joe, who went 21-11 for the Astros. Phil Niekro hovered around .500 all season He was 3-4 as of May 1; 5-8 as of June 1; 10-10 as of July 1; 14-13 on August 1. He went into the season’s final month at 17-17 and went 4-3, 2.65 in September to close out a 21-20.

A Recent Rarity

Phil Niekro is the last MLB pitcher to lose 20 games in a season and still have a .500+ winning percentage.  Before Niekro, that distinction belonged to Walter Johnson, who went 25-20 for the 1916 Washington Nationals.   

Niekro pitched in 24 MLB seasons (1964-87 … Braves, Yankees, Indians, Blue Jays).  He went 318-274, 3.35 and recorded 245 complete games in 716 starts. He was a five-time All Star and three-time 20-game winner (leading the NL in wins twice).  He also led the NL in winning percentage once, starts four times, complete games four times, innings pitched four times and strikeouts once. On the flip side, he led the league in losses four times (twice losing 20 games in a season), home runs allowed four times, walks three times, hit batsmen three times and wild pitches three times.

________________________________

Fewest Starts in a 20-loss Season …. 20 – Les German

In 1896, Les German split his season between the NL New York Giants and Washington Senators – going 2-20, 6.43.  He started 20 games and relieved in eight. German pitched six MLB seasons (1890, 1893-97), going 34-63, 5.45.

Fewest Wins in a 20-loss Season1 – John Cassidy & Jack Nabors

John Cassidy went 1-21. 3.03 in 1875, for the National Association Brooklyn Atlantics. It was the 20-year-old’s rookie season. He forged an 11-season MLB career (1875-1885 … Brooklyn Atlantics, New Haven Elm Citys, Hartford Dark Blues, Chicago White Stockings, Troy Trojans, Providence Grays, Brooklyn), but only pitched in two seasons 1875 and 1877 (two games). As an outfielder/first baseman, he hit .246-5-191 over his career.,

John Cassidy’s .045 winning percentage in 1875 is the lowest ever for a pitcher who lost 20 or more games in a season.

Jack Nabors went 1-20, 3.47 for the 1916 Philadelphia Athletics. It was the righthander’s only full MLB season, (He pitched in ten games for the Athletics as a 27-year-old rookie in 1915 and in two games in 1917.)  In that 1916 season, he pitched in 40 games (30 starts) and had 11 complete games.

A Good Start – The Finish, Not So Much

Jack Nabors’ only win in 1816 came in his first start of the season (April 22), when he beat the Red Sox 6-2.  He threw a nine-inning complete game: eight hits, two runs (unearned), two walks and four whiffs. Little did he know it would be the only “W” he would see by his name in his MLB career.  Nabors’ career record was 1-25, 3.87 (52 games, 37 starts, 13 complete games). 

_____________________________

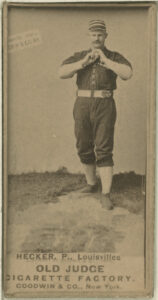
Most Wins By A Pitcher ins a Season of Twenty or More Losses – 52, Guy Hecker, 1885 Louisville Colonels, American Association

Photo: Goodwin & Co., sponsor, Public domain, via Wikimedia Commons

First, a look into the search for a rarity that led to this portion of the post. (This is also a “one thing leads to another” example of Baseball Roundtable and the statistical rabbit hole.)   As I scoured through stats, I saw that, in 107 (21.4%) of MLB’s 499 20-loss seasons, the pitcher put up a winning percentage of .500 or better. I also noted that the 1884 season saw the most 20-loss campaigns, as 25 pitchers reached or exceeded twenty defeats and that nine of those pitchers (36 %) finished at .500 or better.   (The 1884 season featured 33 major-league teams … National League, Union Association and American Association.) No rarities here.  But 1884, did turn up some 20-game loser rarities.

The most wins by a pitcher in a season with 20 or more losses is 52 by the 1884 Louisville Colonels’ (American Association) Guy Hecker (52-20, with a 1.80 earned run average).  That season, Hecker led the AA in wins, earned run average, games (75), starts (73), complete games (72), innings pitched (670 2/3), hits allowed (526) and strikeouts (385). As you would expect, his  .722 winning percentage is the best ever in a season of 20 or more losses.

Hecker finished his nine-season MLB career at 175-46, 2.93, with a .282 batting average (he pitched in 336 games, played first base in 322 and outfield in 75).

A Bit of an Oddity

Guy Hecker won the American Association ERA title in 1884 (1.80) and the league’s batting title in 1886 (.341).

The most wins in a 20-loss season since 1900 belong to Joe McGinnity, who went 31-20, 2.43 for the 1903 Giants. He led the league in wins games (55), starts (48), complete games (44) and innings pitched (434).  His .608 winning percentage is also the best in a 20 or more-loss season since 1900. In 19 MLB seasons (1899-1908 … Orioles, Superbas, Giants), McGinnity went 246-142, 2.66. He won 20 or more games in eight seasons (leading the league five times) and lost 20 or more in two seasons.

An Oddity of the One Thing Leads to Another Variety

This one is from one of Hall of Famer Iron Joe McGinnity’s 20-loss seasons. In August of 1903, the Giants’ McGinnity started both games of a doubleheader three times (August 1, 8 and 31) and won all six games. That same month, he pitched just one game on six occasions – and went 1-5. On the season, he went 31-20, 2.43.

 ____________________________________

Here’s the Ball, Go Get’ Em Rook

A total of 77 rookies have lost 20 or more games – 56 pre-1900, 21 since 1900 and just two since 1960.
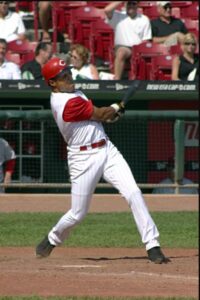
The last rookie to rack up a 20-loss season was the Padres’ Clay Kirby – in 1969, when he went 7-20, 3.80.  He went on to an eight-season MLB career (1969-76 … Padres, Reds. Expos), going 75-104, 3.84.  His best season was 1971, when he went 15-13, 2.93, with 13 complete games in 36 starts for the Padres.

One and Out

Twenty-six pitchers have lost 20 or more games in their final MLB season. For ten of those players, it was their ONLY MLB season. Nine of those ten played before 1900.  The unicorn, in this case, was Henry Keupper, who went 8-20, 4.27 for the 1914 Federal League St. Louis TerriersThe most losses for any of these one season-and-out pitchers goes to George Cobb of the 1892 National League Baltimore Orioles, who went 10-37, 4.86 in his lone MLB season. 

________________________________________

The Win-Loss Yo-Yo

Photo: Chicago White Sox, Public domain, via Wikimedia Commons

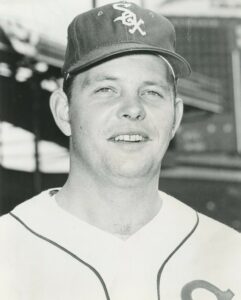
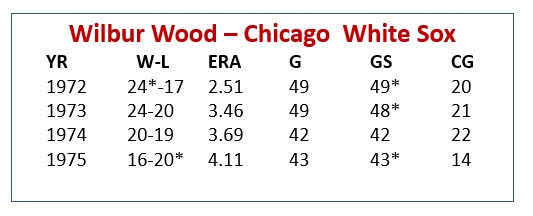
Since 1900, only one pitcher has TWICE put up a season of twenty losses immediately after a season of twenty wins.  That unicorn would be the White Sox’ Wilbur Wood, who accomplished the feat between 1972 and 1975.

Wood was an All Star in 1972, going 24-17 for the White Sox (leading the league in wins). In 1973, he lost 20 games (but again led the AL with 24 wins). Then, in 1974, he went 20-198, 3.60, before losing 20 games (16 wins) in 1975.

Woos

Wood – a southpaw knuckleball pitcher – started his MLB career primarily as a reliever, just 21 starts in 365 appearances between 1961 and 1970. He was converted to a starter by the White Sox in 1971 and won 20 or more games in each of the next four seasons.  He played in 17 MLB seasons, going 164-156, 3.13, with 57 saves. He made a total of 651 appearances (297 starts).  Wood was a three-time All Star and led his league in wins twice (losses once), games pitched three times, games started four times, and innings pitched twice.

____________________________________________

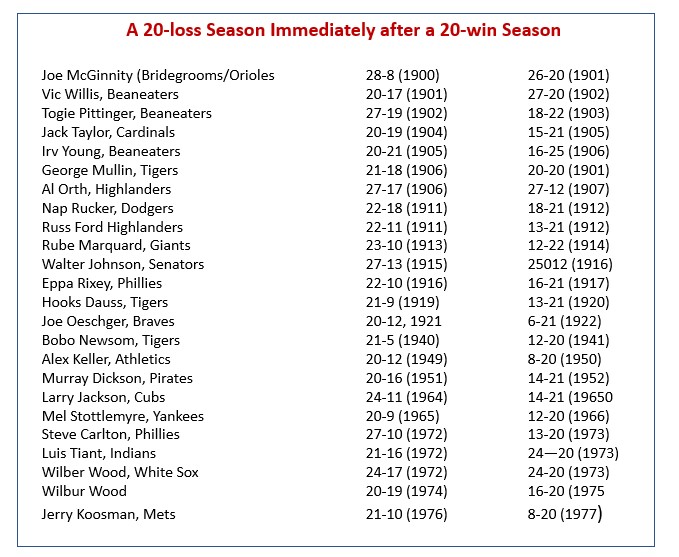
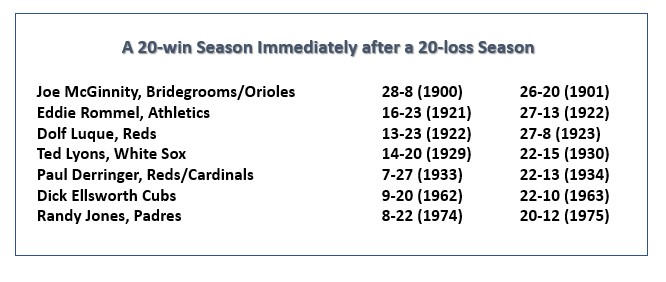
Here’s a look at pitchers, since 1900, who have either followed up a 20-win season with 20 losses in the next campaign, or followed a 20-loss season immediately with a 20-win season.

20 loss after 20 win

20-20

We’re closing in on the end. (Still with me?)

My Three favorite 20-game Losers — Two Youngs and a Larsen

  1.  Don Larsen … In 1954, just two years before he would pitch a World Series Perfect Game for the Yankees, Larsen went 3021, 4.37 for the Orioles (The Orioles were 54-100 that season.) Larsen went 81-91, 3.78 in 14 MLB seasons.
  2. Cy Young …  MLB’s winningest pitcher (511 victories) also lost the most career games (315). His record included three seasons of 20 or more losses (in two of those he had more wins than losses). In 1909, his age-39 seasons, Young went 13-21, 3.19 for the Boston Americans of the  AL. In is 22-season  MLB career, 16 seasons of 20 or more wins (five of those of 30 or more).
  3. Irv Young … There have been only two MLB teams to “boast” four twenty-game loser in the same season and Irv Young was one of the 20-game losers on both of them.  The 1905 Boston Beaneaters featured a rotation that included Vic Willis (12-29), Chick Fraser (14-21), Irvin Wilhelm (3-23) and the “ace” of the staff, Irv Young (20-21). Boston finished 51-103-2. The very next season, Boston Young again led the Boston staff with a 16-25 record, followed up by Vive Lindaman (12-23), Jeff Pfeffer (13-22) and Gus Dorner (8-25).  That season, Boston finished 49-102-1.

Special thanks to Bill Nowlin and Emmet R. Nowlin, editors of “20-Game Losers” (Society for American Baseball Research Inc., 2017) for including a chapter on “A Staff With Four Twenty Game Losers” in that publication.

Baseball Balance: As noted above only two MLB teams have completed a season with four twenty-game losses.  On the other end of the scales, only two teams have finished a season with four twenty-game winners: the 1920 White sox, with Red Faber (23-13), Lefty Williams (22-14), Dickey Kerr (21-9) and Eddie Cicotte (21-10) & the 1971 Orioles, with Dave McNally (21-5), Pat Dobson (20-8), Jim Palmer (20-9) and Mike Cueller (20-9).

Deep breath, here’s the finish line.

The name game.  Some pitchers (whose names stuck out for me) with 20-loss seasons under their belts: Steve Carlton; Walter Johnson; Jerry Koosman; Mickey Lolich; Rube Marquard; Denny McLain; Old Hoss Radbourn; Eppa Rixey; Robin Roberts; Red Ruffing; Amos Rusie; Mel Stottlemyre; Luis Tiant.

Nicknames. Ah, those were the days.  Here are some 20-game losers with nicknames that grabbed me: Ice Box Chamberlain; Egyptian Healy; Phenomenal Smith; Tricky Nichols; The Only Nolan; Brickyard Kennedy; Bullet Joe Bush; Boom-Boom Beck; Pretzels Getzien; Cherokee Fisher; Pink Hawley; Sad Sam Jones; Bobo Newsom.

Primary Resource: Baseball Reference.com.

Baseball Roundtable – Blogging Baseball Since 2012.

100Baseball Roundtable is on the Feedspot list of the Top 100 Baseball Blogs.  To see the full list, click here.

Baseball Roundtable is also on the Anytime Baseball Supply Top 66 Baseball Sites list.  For the full list, click here

I tweet (on X) baseball @DavidBaseballRT

Follow Baseball Roundtable’s Facebook Page here

Member: Society for American Baseball Research (SABR); Negro Leagues Baseball Museum; The Baseball Reliquary.

P1019


“Who’s Your Daddy?” … Episode 19 … Tom Glavine

Welcome to the 19th post in the Baseball Roundtable’s “Who’s Your Daddy?” series, where we take a look at Roundtable-selected lineups that performed exceptionally well against some of MLB’s greatest pitchers.

As always, I would stress that the pitchers included in the Who’s Your Daddy? series are among the “best in the business.”  They are selected not because of the players who performed well against them, but rather because success among hitters when they were on the mound was the exception rather than the rule.  We’ve looked at pitchers from a wide range of eras – from Carl Hubbell to Bob Feller to Nolan Ryan to Justin Verlander. Note:  For those unfamiliar with the series, its origins are explained at the end of this post.

This chapter of Who’s You Daddy? Focuses on Tom Glavine – one of just six left-handed pitchers to attain 300 or more major-league victories. In case it should come up in a trivia quiz, here they are (in order of total wins): Warren Spahn (363): Steve Carlton (329); Eddie Plank (326); Tom Glavine (305); Randy Johnson (303); and  Lefty Grove (300).  

___________________________

Before we get started on this edition, here are links to the previous editions of this series.

Please note: For still active pitchers, the stats are as they stood on the date of the post.

  • Nolan Ryan, click here.
  • Sandy Koufax, click here.
  • Pedro Martinez, click here.
  • Bob Gibson, click here.
  • Randy Johnson, click here.
  • Greg Maddux, click here.
  • Justin Verlander, click here.
  • Bob Feller, click here.
  • Roger Clemens, click here.
  • Max Scherzer, click here.
  • Tom Seaver, click here.
  • Mariano Rivera, click here.
  • Warren Spahn, click here.
  • Lefty Grove, click here.
  • Steve Carlton, click here.
  • Robin Roberts, click here.
  • Carl Hubbell, click here. 
  • For Hoyt Wilhelm, click here.

If you go back through past editions of “Who’s Your Daddy?”, you may find a few surprises – like how Will Clark owned Nolan Ryan; Jerry Lynch‘s .714 average versus Sandy Koufax; pitcher Hal Jeffcoat’s .545 average versus Hoyt Wilhelm; the fact that Brian Harper faced Roger Clemens 23 times and never struck out; or how Ival Goodman (who averaged one home run each 47 at bats over his 10-season MLB career) poked six home runs in just 64 at bats against Carl Hubbell.

____________________________

Photo: jimmyack205, CC BY 2.0 <https://creativecommons.org/licenses/by/2.0>, via Wikimedia Commons

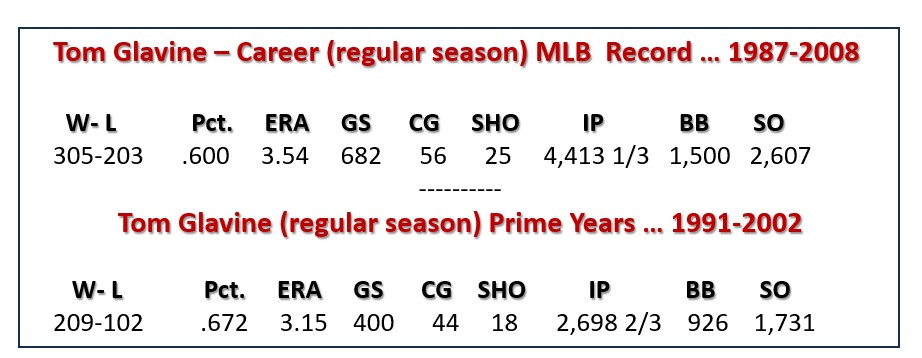
Before we get into the lineup of players who fared especially well against Tom Glavine, let’s take a look at the southpaw’s Hall of Fame career.  Glavine pitched in 22 MLB seasons (1987-2008, his age-21 through age-42 seasons). He spent 17 seasons with the Braves and five with the Mets.  Glavine’s 305 wins (versus 203 losses) are 21st all-time and fourth among lefthanders. His .600 wining percentage is 14th among the 24 MLB 300-game winners.

One-Two Punch … Left Jab-Right Hook

The leaders in pitching victories for the decade of the 1990s spent seven of the ten years of the decade together  in the Braves’ rotation. Righty Greg Maddux, whose decade saw him spend 1990-92 with the Cubs and 1993-99 with the Braves, led all MLB pitchers with 176 wins in the decade.  Southpaw Tom Glavine, who spend the entire decade with the Braves, was second with 164.  Maddux and Glavine both won 300+ games in their MLB careers and were both 2014 first-ballot electees to the Baseball Hall of Fame.

Glavine – a ten-time All Star and two-time Cy Young Award winner – was primarily a fastball-changeup pitcher for most of his career (although he could mix in an effective curve, slider and cutter). He was known for pinpoint control, avoiding the middle of the plate and expanding the strike zone, particularly low-and-away. He won 20 or more games in five seasons (four in the 1990s) – leading the NL in wins each time. He led the National League in starts six times, complete games once and shutouts once.  A workhorse, Glavine started 32 or more games in 17 seasons, including every season from 1996 through 2007.

Baseball Roundtable Likes a Good Coincidence

In his first MLB season (at age 21), Tom Glavine went 2-4, with a 5.54 earned run average for the Braves.  In his final MLB season (age 42), Glavine went 2-4, with a 5.54 earned run average for the Braves.  Maybe a good trivia question:  What 300-game winner went 2-4, 5.54 in both his first and last seasons in the major leagues?

In his prime 12-season stretch from 1991 through 2002, Glavine averaged 17 wins, eight losses, a 3.15 ERA, 225 innings pitched, 77 walks and 144 strikeouts per campaign.

A Brief Break From Our Regularly Scheduled Topic

Mike Glavine (Tom Glavine’s younger brother) had a brief MLB career:   six games (PH/1B), seven plate appearances with the Mets in September of 2003. So, why is he here?  Mike made his MLB debut on September 14, 2003 in a pinch-hitting role.  Who did he hit for?  His big brother Tom. (He grounded out second-to-first).  Another fact that caught my eye.  Mike got his only MLB hit in his final MLB plate appearances (September 28, 2003 versus the Marlin’ Braden Looper.) 


Now, let’s look at a lineup of players, who performed pretty well against Glavine.

Keep in mind, while these selections are statistically based, there is plenty of room for debate. (Isn’t that part of what is great about the national pastime?) For example, they are weighted in favor of larger sample sizes. I also considered whether the numbers were generated in Glavine’s prime years and balanced the stats against the player’s career statistics (for example, if I was looking at two players who each hit .305 versus Glavine, I would be more impressed by the player with a .266 overall career average than one with a .308 career average).   I’ll provide some examples of how these criteria were applied as you go through the lineup

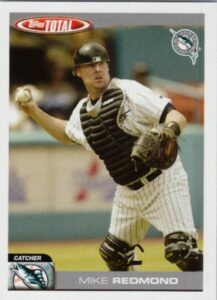
Catcher – Mike Redmond … .438 average, unexpected power

Mike Redmond, a career .287 hitter over 13 seasons (1998-2010 … Marlins, Twins, Indians) hit Tom Glavine for a .438 average over 20  games. Glavine was also one of only two pitchers that Redmond (who hit a total of 13 career homers) reached for two career home runs.  As an unexpected side note: Redmond hit .500 (21-for-42 versus Glavine from 1998-2002), then went zero-for-nine in the final two seasons in which he faced him (2003-04).

In 1999, when Glavine went 14-8, 3.68, Redmond faced him seven times and collected five hits and a walk (.833 average).

A Nice Little Run

From July 12, 1998 through his second at bat against Glavine on July 6. 1999, Mike Redmond faced Glavine nine times and collected seven singles, one double and a walk. Over those two seasons, Glavine went 34-17, 3.30.

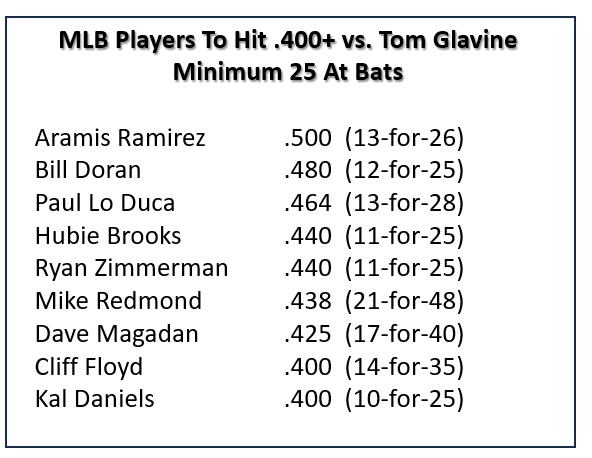
Honorable Mention at Catcher: I fully expected this spot to go to someone like Hall of Famer Mike Piazza, who went .343-6-13 in 27 games against Glavine. Piazza’s six home runs tie for the most against Glavine and his 13 RBI tie for fifth.  Piazza did have 84 plate appearances versus Glavine, compared to Redmond’s 51 – but I could not resist Redmond’s .400+ average. Either would be a fine choice at catcher in this lineup.

Worth the Wait

Mike Piazza, who played his way into the Baseball Hall of Fame (with a  career .308-427, 1,335 stat line and ten All Star selections) was the 1,390th pick in the 1988 MLB draft.   

____________________________________

First Base – Jeff Bagwell … .339, with three home runs

Photo: Michael Glasgow, CC BY 2.0 <https://creativecommons.org/licenses/by/2.0>, via Wikimedia Commons

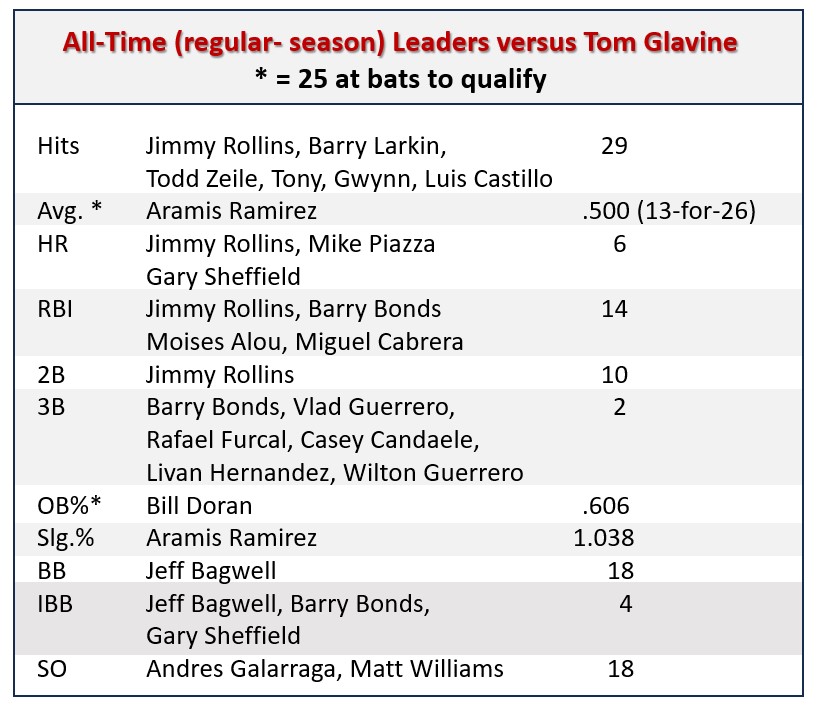
Hall of Famer Jeff Bagwell hit .339, with three homers and ten RBI in 23 games against Glavine. His 21 career hits against the lefty tie for the 18th.  Bagwell also drew 18 walks versus Glavine (11 strikeouts) and put up a .488 on-base percentage. Those 18 walks were the most Glavine issued to any player. Four of those were intentional, tying for the most IBB Glavine issued to any player.  (Others to receive four career IBB from Glavine were Gary Sheffield and Barry Bonds.) Bagwell was a career .297 hitter over 15 seasons (1991-2005, all Astros). He was a four-time All Star, 1991 NL Rookie of the year and 1994 NL MVP (.368-39-116, with 104 runs scored and 15 steals. ).  His career stat line was .297-449-1,529, with 1.517 run scored and 202 stolen bases.

________________________________

An Even Dozen

In his first dozen games facing Tom Glavine, Jeff Bagwell got on base versus Glavine via hit or walk in all twelve, hitting safety in 11.

______________________________________

Deserves a Shoutout at 1B: First baseman Mo Vaughn doesn’t make this lineup due to a small sample size (just 10 at bats in four games versus Glavine), but he deserves a shoutout. In those three games, he delivered five hits (two doubles and three home runs) for a 1.600 slugging percentage.

Now, it’s always nice when selecting these lineups to come across a player you are not familiar with. Expos’  1B Fernando Seguignol faced Tom Glavine in five games (1999-2001) and went seven-for-fourteen (.500), with two doubles, two home runs and five RBI. It was Seguignol’s most at bats, most hits, most doubles (tie), most home runs and most RBI against any pitcher. In five MLB seasons (1998-2001, 2003 … Expos, Yankees), Seguignol hit .249-17-40 (178 games).

___________________________

Second Base – Tie:  Robby Thompson and Bill Doran

I could find good arguments for both Robby Thompson and Bill Doran in this spot.

If I had to pick one, I’d lean toward Thompson for his larger sample size.  However, since this is my post, I can declare a tie.

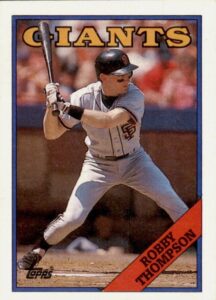
Robby Thompson – .393 and four long balls

Robby Thompson hit .393 (22-for-56) in 20 games against Tom Glavine. Perhaps as important is the fact that 13 of his 22 hits went for extra bases (eight doubles, one triple and four home runs). This gives him a .786 slugging percentage versus Glavine – second highest among players with at least 25 at bat versus Glavine. Thompson hit .500 or better versus Glavine in five of the nine seasons in which he faced him.

_______________

Catching Him in His Prime

In 1992 & 1993, when Tom Glavine went a combined 42-15 (and led the NL in wins both times), Robby Thompson 11-for-18 (.611) against him, with two homers and three RBI in six games.

______________

Thompson played 11 MLB seasons (1986-96), all for the Giants.  He was a two-time All Star and one-time Gold Glover, who put up a .257-119-458 stat line. His four home runs off Glavine` tied for the most he hit against any MLB pitcher (he also had four versus Jose Rijo) and his 22 hits versus Glavine were the second most he had against any MLB pitcher (he hit .424 with 23 hits versus Fernando Valenzuela).  By contrast, Thompson hit .118, with nine hits in 48 at bats versus Greg Maddux, with three walks and 15 whiffs.

Bill Doran – .480 average, .606 on-base percentage.

Photo: Indiana Blue Sox, Public domain, via Wikimedia Commons

Bill Doran was a .266 career MLB hitter (1982-93 … Astros, Reds, Brewers). He did, however, tag Tom Glavine for a .480 average (12-for-25) and drew eight walks versus Glavine, fanning just once (.606 on-base percentage – highest among batters with at least 25 at bats versus Glavine).  Side note: If you use 25 plate appearances instead of at bats, Doran’s OBP versus Glavine is second to Carlos Delgado’s  .640.

____________________________

Bookends

In his first seven career plate appearances versus Tom Glavine (August 17 & September 30, 1987), Bill Doran was on base six times (three singles and three walks). In his final eight plate appearance versus Glavine (October 2, 1991 and August 4 & September 9, 1992), Doran collected four walks and a pair of singles.

_________________________________  

Doran’s career stat line was .266-84-497, with 727 runs scored and 209 steals in 1,453 games. His best season was 1987, when he hit .283-16-79, with 82 runs scored and 31 steals for the Astros (and played in all 162 games).

Possible Trivia Question: Which member of the Astros’ Hall of Fame matriculated in Oxford? (No, not that Oxford.)  Bill Doran studied and played base ball for Miami University in Oxford, Ohio – where he hit .407-4-27 (45 games) in his final college season (1979). He was selected in sixth round of the 1979 MLB Draft.

Honorable Mention: Luis Castillo hit .382-2-5 in 24 games versus Glavine (1996, 1999-2005, 2008). His 29 hits tied for the most career safeties against Glavine and he recorded them in the fewest at bats among the five players with 29 hits against Glavine. There was just a lot of competition at second base – and a three-way tie was too much to ask.

__________________________________

_________________________________

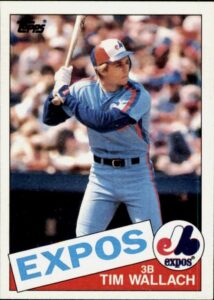
Third Base: Tim Wallach … .367, five homers, 12 RBI

Tim Wallach hit .367, with five home runs and 12 RBI against Glavine – and he gets extra credit because those numbers came between 1988-94 and included three of the five seasons in which Glavine led the league in wins. (1991-93). Over those three seasons, Wallach went 12-for-29 (.414) against Glavine, with three doubles, a triple, one home run and five RBI.

Going Deep Can Be Habit-Forming

Between May 30, 1990 and June 9, 1991, Tim Wallach faced Tom Glavine in four games and homered in each of them:

May 30, 1990 … one-for-two, solo homer;

June 29, 1990 … one-for-three, solo home run, walk;

July 12, 1990 … one-for-three, three-run homer;

June 9, 1991 … two-for-two, single, three-run homer, single, walk.

As an aside, those three 1990 homers were the only hits Wallach had in 11 at bats versus Glavine that season.

Wallach played in 17 MLB seasons (1980-96 … Expos, Dodgers, Angels), going .257-260-1,125, with 908 runs scored. He was a five-time All Star and three-time Gold Glover. His best season was 1987, when he hit .298-26-123 – reaching career highs in all three categories, as well as in doubles (a league-leading 42), runs scored (89), stolen bases (9) and total bases (305).


Honorable Mentions. Aramis Ramirez.  It’s hard to limit Ramirez to an honorable mention here.  After all, he hit .500 (13-for-26), with four home runs and ten RBI in just 12 games versus Glavine.  However, five of his hits, two of his homers and eight of his RBI came in Glavine’s final three (age 40-42) seasons. Digging deeper, Ramirez had a .421 on-base percentage versus Glavine from 2001-2005 and a .721 OBP in 2006-08. Still, there are some nice numbers here.  Ramirez drew eight walks and fanned just once (in 35 plate appearances) versus Glavine (six of the walks in those final three seasons). He also hit .400 or better in six of the seven seasons he faced Glavine.  Ramirez played 18 MLB seasons (1998-2015 … Pirates, Cubs, Brewers), going .283-386-1,417, with 1,098 runs scored.  He was a three-time All Star, hit 25 or more home runs in ten seasons, drove in 100+ runs in seven and hit .300 or better in seven.

During his 16-season MLB career, Todd Zeile started more than 100 games each at 3B (1,468), 1B (417) and catcher (121).  As a hitter, over 2,158 games, he went .265-253-1,110.  Zeile faced Glavine in 34 games and collected 29 hits (.326 average), with four  home runs, 12 RBI (13 walks  and 13 strikeouts). Competition was tough at the hot corner.

__________________________________

Shortstop:  Tie- Jimmy Rollins & Barry Larkin

I know, another cop out (tie), but Barry Larkin and Jimmy Rollins each offer a notable body of work against Glavine – and were both were among the players tied for the most hits against Glavine at 29. Rollins showed a bit more power, Larkin a bit more patience.  And, more of Larkin’s numbers were delivered when Glavine was in his prime.

Jimmy Rollins – .372 average, 29 hits, ten doubles, 14 RBI.

Photo: Keith Allison from Hanover, MD, USA, CC BY-SA 2.0 <https://creativecommons.org/licenses/by-sa/2.0>, via Wikimedia Commons

Jimmy Rollins holds or is tied for the career lead in hits (29), home runs (6), doubles (10) and RBI (14) against Glavine. Overall, 17 of Rollins 29 hits went for extra bases.  Admittedly, a significant portion this damage was done toward the end of Glavine’s career, but those leadership positions are impossible to ignore.  (As a bit of explanation, eight of Rollins’ hits, two of his homers and three of his RBI against Glavine came in 2007 (Glavine’s age-41 season).

Rollins was a three-time All Star, four-time Gold Glover and the 2007 NL Most Valuable player. He played 17 seasons (2000-2016 … Phillies. Dodgers White Sox) and hit .264-231-936, with 1,421 runs scored and 470 stolen bases. He led the NL in triples four times, runs scored once  (topping 100 runs scored in six seasons) and stolen bases once (topping 40 steals in four seasons).

Barry Larkin … .309, 29 hits, three homers, 12 RBI, 14 walks

Photo: Rdikeman at the English Wikipedia, CC BY-SA 3.0 <http://creativecommons.org/licenses/by-sa/3.0/>, via Wikimedia Commons

Hall of famer Barry Larkin faced Glavine in 34 games (1987-96, 1998-99, 2002,2004). He hit .309 (29 hits), with eight doubles, one triple, three homers and 12 RBI. He also walked 14 times versus Glavine versus just three whiffs.

Larkin’s numbers against Glavine were closer to his career norm than Rollins’ were to his. Larkin played 19 MLB seasons (1986-2004), all for the Reds.  He hit .295-198-960, with 1,329 runs scored and 379 steals. He was a 12-time All-Star, three-time Gold Glover and the 1995 NL Most Valuable Player. Larkin hit over .350 against Glavine in seven of the 14 seasons in which he faced the southpaw Hall of Famer.


Small Sample Shoutout at Short:  Luis Rivera faced Tom Glavine in just three games (1988 & 1994) and went six-for-eight, with a double, two home runs and four RBI.

__________________________________

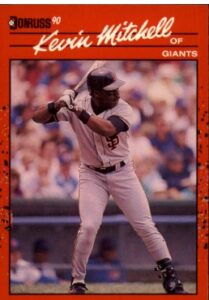
Left Field – Kevin Mitchell … .356, with five home runs and 12 RBI

Kevin Mitchell faced Glavine in 16 games (1987-91, 1993-94, 1996), putting up a .356-5-12 line.  Half of Mitchell’s hits against Glavine went for extra bases (three doubles and five home runs) – giving him a .756 career slugging percentage the lefty.

Closing Strong

In his first three games against Glavine, Mitchel went two-for-seven (.286), with zero extra-base hits, just one walk and four strikeouts.  Over his final 13 games against Glavine, he went 14-for-68 (.368), with eight extra-base hits, nine walks and three strikeouts.

In the same vein, in his first career plate appearance against Glavine (September 25. 1987), Mitchell struck out.  In his last plate appearance against Glavine September 4, 1996, he homered.


Kevin Mitchell played in 13 MLB seasons (1984, 1986-94, 1996-98 … Mets, Padres, Giants, Reds, Red Sox, Indians, Athletics), going .284-234-760 in 1,223 games. He was a two-time All Star and the NL MVP in 1989, when he hit .291-47-125 for the Giants – leading the league in HRs, RBI, slugging percentage and total bases.

__________________________________________

Center Field – Andruw Jones … .372 average, four home runs

Photo: User Chrisjnelson on en.wikipedia, Public domain, via Wikimedia Commons

Needed a leather and lumber guy in CF and Andruw Jones fit the bill.  In 18 games versus Glavine (2003-07), Jones hit .372, with four home runs and 11 RBI, Eight of his 16 hits versus Glavine went for extra bases (four doubles, four home runs) and he drew 11 walks to just four strikeouts, putting up a nice even .500 on-base percentage.

First Time’s the Charm

Andruw Jones homered on the second pitch he ever saw from Tom Glavine (May 24, 2003). The Braves defeated Glavine’s Mets 10-3 in that game.

Andruw Jones played in 17 MLB seasons (1996-2012 … Braves, Dodgers, Rangers, White Sox, Yankees), going .254-434-1,289, with 1,204 runs scored and 152 stolen bases.  He hit 30 or more home runs in seven seasons (a league-leading and career-high 51 in 2005). He was a five time All Star and ten-time Gold Glover in center field.

Andruw Jones and Tom Glavine were teammates on the Braves from 1996 through 2002.

_________________________________

Right Field, Gary Sheffield – .293, five home runs, 13 RBI, 17 walks versus three whiffs, .461 OBP

Oh, I’d like to have seen those Gary Sheffield versus Tom Glavine at bats. Glavine working to expand the strike zone, Sheffield refusing to bite on the low-and -away pitch (17 walks versus three whiffs). Sheffield faced Glavine in 1992, 1994-2001, 2003, 2005 & 2007). He tied for the most career home runs off Glavine with six and had the fifth most RBI (13 – one off the lead). But what really put him in the LF spot (against some tough competition), was those 17 walks versus only three strikeouts.

In 1996, Gary Sheffield faced Tom Glavine 12 times in four games and got on base nine – seven walks and two home runs.  He did not strikeout against Glavine that season. Over his career, Sheffield never fanned more than once versus Glavine in any season and had just three whiffs in 76 plate appearances.

Some Bookends

On April 18, 1996, the Marlins’ Gary Sheffield rapped a home run off Tom Glavine in the first inning of a 5-3 Florida win over Atlanta. In his next seven plate appearances versus Glavine, Sheffield walked seven times (three intentional). He ended the streak of walks with another home run off Glavine on July 12 of that season.

Outfield Honorable Mentions: Barry Bonds went .329-4-14 in 33 games versus Glavine. Moises Alou also did well against Glavine at .351-3-14 in 25 games.

Apologies

Tony Gwynn tied for the most career hits versus Glavine, but did not make this lineup. One main reason, his .312 average versus Glavine was 26 points below his career average.

______________________________________

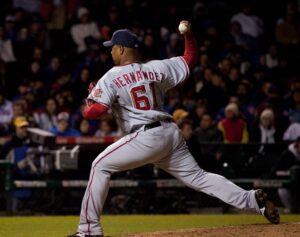
Pitcher – Livan Hernandez … .412 average

Livan Hernandez faced Tom Glavine 20 times in eight games (1999, 2002-06) and delivered seven hits in 17 at bats (.412 average). Those hits included two triples (tied for the most against Glavine by any batter), one home run and three RBI.

On The Money

 In his very first game against Glavine (April 23, 1999), the Marlin’s Livan Hernandez got his money’s worth on the mound and at the plate. On the mound, he got the win (over the Braves) with a nine-hit, one-run, two-walk, nine-strikeout complete game.  At the plate, he flied out to deep right on the first pitch he saw from Tom Glavine (second inning); had an RBI sacrifice fly on an 0-2 pitch from Glavine in the fourth; hit a two-run homer on the first pitch he saw from Glavine in the sixth; and had an RBI single off reliever John Hudek in the seventh.

In their eight head-to-head pitching matchups, Glavine went 5-3, 2.56, while Hernandez went 3-5, 2.88. Hernandez was a solid hitter as a pitcher – .221-10-85 over 973 at bats over 17 seasons.

Honorable Mention: Gil Heredia faced Tom Glavine just three times (1994-95), but he delivered three hits. (all singles).  Heredia, by the way, was a good hitting pitcher. Over 10 MLB seasons, he put up a .213 average (19-0for-104), struck out just 11 times in 131 plate appearances.  The right hander went 57-51, 4.46 on the mound (1991-96, 1998-2001 … Athletics, Expos, Giants, Rangers.)


______________________________________

Who’s Your Daddy?  The Inspiration.

On September 24, 2004, in the middle of a tight pennant race, the Yankees handed future Hall of Famer Pedro Martinez and the Boston Red Sox a tough 6-4 loss.  Martinez went 7 1/3 innings giving up nine hits and five earned runs.  The game came just five days after (in his previous start) Martinez had lasted just five frames against the Bronx Bombers (eight hits, eight earned runs) in a 16-7 loss.

After that second loss, Martinez candidly commented, “What can I say? I just tip my hat and call the Yankees my daddy.”  Little did he know that his comment – and a Yankee fans’ chant of “Who’s your daddy?” would follow him into future starts in New York (all the way to his final MLB start – against the Yankees for the Phillies – in Game Six of the 2009 World Series).

The concept of “Who’s your daddy?” became the inspiration for Baseball Roundtable to take a look at the players who “had the number” of some of MLB’s premier pitchers.  Again, you can find links to the previous “editions” of “Who’s Your Daddy?” near the top of this post. 

______________________________________

Primary Resource: Baseball-References.com.


Baseball Roundtable – Blogging Baseball Since 2012.

100Baseball Roundtable is on the Feedspot list of the Top 100 Baseball Blogs.  To see the full list, click here.

Baseball Roundtable is also on the Anytime Baseball Supply Top 66 Baseball Sites list.  For the full list, click here

I tweet baseball @DavidBaseballRT

Follow/Like Baseball Roundtable’s Facebook Page here.  Find More baseball commentary; blog post notifications; PRIZES.

Member: Society for American Baseball Research (SABR); Negro Leagues Baseball Museum; The Baseball Reliquary.

P1018