Archives for September 2022

These Pitchers Took Control of the Situation

This post is another of those Baseball Roundtable “one thing leads to another” random musings.  With the Twins having faded from post-season contention, I found myself looking at some past Twins players. One thing led to another and I noted that a pair of Twins’ pitchers hold the MLB single-season records for fewest walks per nine innings and best strikeouts-to-walks ratio (post 1888).  This led me to look at the all-time leaders in those “very controlling” categories.

Note:  I used post-1888 numbers to reflect rules changes over time. In the late 1870s, it took nine balls outside the striking zone to earn a walk. In 1880, the figure was dropped to eight balls. It slid down to six in 1884; five in 1887; and the current four-ball rule came into play in 1889.

Let’s start with walks per nine-innings  (among qualifying pitchers).

Carlos Silva – Single-Season Fewest Walks Per Nine Innings

The single-season MLB record holder for fewest walks per nine innings (among qualifiers) is righty Carlos Silva, who walked just 0.43 batters per nine frames for the 2005 Twins.
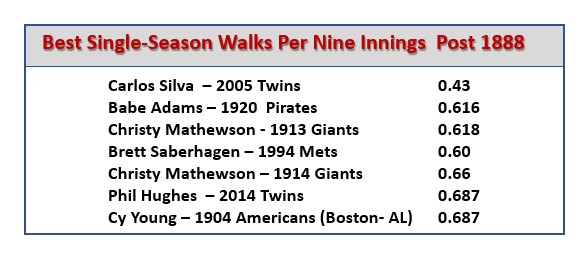
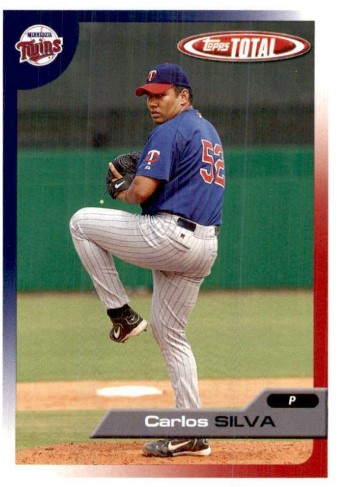
In 2005, Silva went 9-8, 3.44. He walked just nine batters in 188 1/3 innings (fanning 71) and two of those free passes were intentional. If you are looking for an obscure trivia questions, you might ask “How many right-handed batters did Silva walk in 2005? “ The answer would be one:   Tigers’ outfielder  Craig Monroe – and that walk, by the way,  was an intentional pass. In his 27 2005 starts, Silva averaged seven innings per start and never walked more than one batter in any contest.

Carlos Silva is the only pitcher – among  the top 25 in fewest walks per nine innings – whose record season came after the four-ball walk rule was introduced.

Silva pitched in nine MLB seasons (2002-2010 … Phillies, Twins, Mariners, Cubs), going 70-70, 4.68 in 180 starts and 136 relief appearances. He finished in his league’s top five  in fewest walks per nine innings four times.

Side note: Silva is seventh on the all-time single-season list, but all those ahead of him recorded their “controlling” seasons between 1876 and 1880, when it took either eight or nine balls to complete a free pass. The ultimate leader is George Zettlein of the 1876 Philadelphia Athletics at 0.23 walks per nine.  

______________________________________

Cy Young led the league in fewest walks per nine innings in 14 seasons

and in strikeout-to-walk ratio in 11. 

______________________________________

Deacon Phillippe – Fewest Career Walks Per Nine Innings (minimum 1,000 innings)

Righty Deacon Phillippe played in 13 MLB seasons (1899-1911 … Louisville Colonels, Pittsburgh Pirates). He waked just 363 batters over 2,607 1/3 innings pitched (1.25 walks per nine innings).

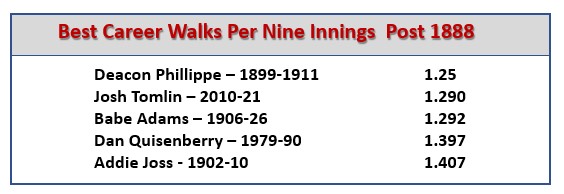
Phillippe’s career mark was 189-109, 2.59. He won 20 or more games in six seasons. He led is league in fewest walks per nine innings five times (finishing in the top five eight  times) and strikeout-per-walk ratio four times (top five seven times). His best season was 1903, when he went 25-9, 2.43 and completed 31 of 33 starts.

Side Note: Phillippe is 16th all-time in fewest walks per nine frames, but all those ahead of him spent all or the bulk of their careers pitching before the four-ball rule was put in place.  In first place on the full list is righty Candy Cummings, who pitched in six MLB  seasons (1872-77) and walked just 113 batters in 2,149 innings. Cummings, a Hall of Famer, went 145-94, 2.42 over those six campaigns. From 1872 through 1875, he went 124-72 (averaging 31 wins per season), 2.35, with 193 complete games in 198 starts.  

__________________________________________

In the “ stream of  “one thing leads to another” thought, I also look a look at pitches who appeared to best combine control with swing-and-miss stuff.  They weren’t the stingiest with walks, but had the combination of stuff and command to help themselves a lot more with strikeouts than they hurt themselves with free passes. Here, I found a few more recent moundsmen.

Phil Hughes – Best Single-Season Strikeout -to-Walk Ratio (among qualifiers)

Right-hander Phil Hughes is number-one all time in single-season strikeout-to-walk ratio – at 11.63 for the 2014 Twins. That season, Hughes went 16-10, 3.52, fanning 186 batters and walking just 16 (one intentionally) in 209 2/3 innings. Surprisingly, Hughes’ next best season in strikeout-to-walk ratio was only about half his 2014 ratio – 5.88 in 2015.

*Marco Gonzalez is still active. His stats are through September 25, 2022.

Hughes pitched in 12 MLB seasons (2007-2018 … Yankees, Twins, Padres). He went 88-79, 4.52. He was an All Star in 2010, when he went 18-8, 4.19 for the Yankees. He recorded three seasons of 16 or more victories. The 2014 season is the only one in which he finished in his league’s top five for fewest walks per nine innings, as well as his only top-five season in strikeout-to-walk ratio.

A Quick Turnaround

In the year Phil Hughes set the single-season strikeout-to-walk ratio record, he walked four batters in his first ten  innings pitched. He then went on to walk just 12 more batters over his next 199 2/3 innings. He did not walk a batter in 19 of 32 appearances and only twice walked more than one in a game.

_____________________________________

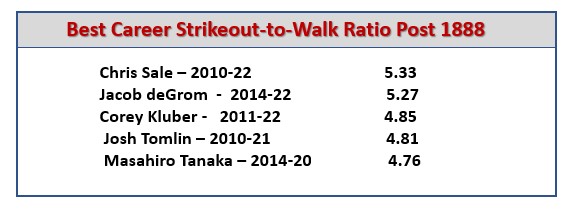
Chris Sale – Career Strikeout-to-Walk Ratio (minimum 1,000 innings pitched)

Southpaw Chris Sale (still active) leads the pack in career strikeout-to-walk ratio at 5.33.  In 1,678 1/3 innings pitched, he has fanned 2,064 batters and walked 387.

*Chris Sale, Jacob deGrom and Corey Kluber are active in the major leagues this season.

Their stats are through September 25.

Sale has pitched in 12 MLB seasons (2010-19, 2021-22 … White Sox, Red Sox). The seven-time All Star  and has led his league in strikeouts twice (top five five times), strikeouts per nine innings three times (four times in the top five) and strikeout-to-walk ratio once (five times in the top five). Sale has a 114-74, 3.03 record.

________________________________________

Another possible trivia question to fool your friends. Ask them to rank these pitchers in order of career walks per nine innings – fewest to most: Josh Tomlin, Brad Radke, Bret Saberhagen, Rick Reed, Greg Maddux. The ranking is in the order they are presented: Tomlin (1.29); Radke (1.63); Saberhagen (1.65); Reed (1.66); Maddux (1.80).

Primary Resource:  Baseball-Refeence.com.


Baseball Roundtable … blogging baseball since 2012. 

100Baseball Roundtable is on the Feedspot list of the Top 100 Baseball Blogs.  To see the full list, click here.

I tweet (on X) baseball @DavidBaseballRT

Follow Baseball Roundtable’s Facebook Page here.  More baseball commentary; blog post notifications.

Member: Society for American Baseball Research (SABR); The Baseball Reliquary; The Negro Leagues Baseball Museum.

Robin Roberts – 1950’s King of the Hill

By way of introduction to this post, I was born in 1947 – which means my formative years, as a baseball fan, were the 1950’s. I went to my first minor-league game in 1951, my first major-league game in 1953 (when the Braves moved to my home town of Milwaukee) and my first World Series game in 1957.  I played my first Little League game in 1955.

It wasn’t a bad time to start a life of fandom. There were players who debuted early in the decade and made their mark quickly – like Whitey Ford (MLB debut in 1950); Willie Mays (1951); Mickey Mantle and Eddie Mathews (1952); Ernie Banks (1953); Hank Aaron and Harmon Killebrew (1954); and Roberto Clemente (1955).  There also were more established stars like Stan Musial, Warren Spahn, Ted Williams, Duke Snider and Ralph Kiner.  (Not to mention the underrated Richie AshburnOh, I guess I did mention him. ) And, for a kid whose last name ended in “ski,” the likes of Ted Kluszewski and Bill Mazeroski.

Ralph Kiner won the NL home run crown as a rookie in 1946 and went on to lead the league in homers for each of the next six seasons.

I would like to dedicate this post to one of the hardball heroes of my youth – Robin Roberts, who was clearly one of the  (if not the) Kings of the Hill in the 1950’s.

Multi-Sport Athlete

Robin Roberts not only starred on the Michigan State University baseball team (tossing six shutouts in 1946), he was also a basketball standout was captain and leading scorer for the Michigan State basketball squad.

Photo: Bowman, Public domain via WikiCommons

While attending Michigan State, Roberts also pitched for the Twin City Trojans (Montpelier, Vermont) in the summer semi-pro Northern League. His performance at MSU and in the Northern League (he was 18-3 for the semi-pro squad in 1947) led to a contract with the Philllies’ organization and – after putting up a 9-1 record in 11 games for the  B-Level  Wilmington Blue Rocks – Roberts made his MLB debut, as a 21-year-old, on June 18, 1948.  In that game, he went eight strong innings (five hits and two earned runs) in a 2-0 loss to the Pirates. Over the 1948-49 seasons, he went 22-24, 3.50 (with 20 complete games in 51 starts).  Then, in 1950, it all fell into place, as Roberts put up a 20-11, 3.02 season, with 21 complete games in 39 starts and a league-leading five shutouts. It would start a string of six straight seasons of 20 or more wins – during which he would lead the league in wins four times, starts six times, complete games four times, innings pitched five times and strikeouts twice.

A Working Man’s Game

From 1950 through 1955, Robin Roberts recorded six consecutive seasons of more than 300 innings pitched.

How good was Robin Roberts in the 1950’s?  In the ten seasons from 1950 through 1959, Roberts:

  • Averaged just over 300 innings pitched per season (3011 2/3 innings pitched with six seasons over 300); (check)
  • Pitched 1,013 1/3 innings in the three seasons from 1952 through 1954;
  • Was second only to Warren Spahn in victories – 199 to Spahn’s 202;
  • Was second only to Early Wynn in strikeouts (1,516 to Wynn’s 1,544);
  • Led all MLB pitchers in complete games (237);
  • Had the lowest Walk + Hits Per Innings Pitched (WHIP) of all pitchers with at least 1,000 innings pitched (1.129);
  • Was a six-time 20-game winner and a seven-time All Star;
  • Led the league in wins four straight season (1952-55);
  • Led the league in games started six straight seasons (1950-55);
  • Led the league in complete games five straight seasons (1952-56);
  • Over the ten seasons, averaged 7.96 innings per start;
  • Over the ten seasons, had a .571 winning percentage, while the Phillies had a .496 winning percentage;
  • In 1952, averaged 8.8 innings per start.

In 1952, Robing\ Roberts went 28-7, with a 2.59 earned run average. In 37 starts he threw 30 complete games and threw less than eight innings in just four contests.

  • In 370 starts over the 1950’s, went at least seven innings in 301;
  • Completed 28 consecutive starts from August 28, 1952 through July 5, 1953 (with one relief appearance interrupting the string);
  • For those into the new stats, had the highest Win Above Replacement (WAR) among pitchers (for the decade) at 60.5.

Pitch Count.  We don’t Need NO Stinkin’ Pitch Count

On September 6, 1952, Robin Roberts threw a 17-inning complete game in a 7-6 win over the Boston Braves in Philadelphia (holding the Braves scoreless over the final nine frames). How did all that work affect his arm?  Five days later, he threw a complete game in a 3-2 win over the Cardinals.  In fact, in the 22 days after that 17-inning outing, Roberts threw five complete-games (all wins); giving up 12 earned runs over the 54 innings (2.40 earned run average).

Hall of Famer Roberts pitched 19 seasons in the major leagues (1948-66 … Phillies, Orioles, Astros, Cubs), going 286-245, 3.41. He threw 305 complete games in 609 starts. (50.8%). Over his career he averaged 7.5 innings per start.

Side note:  An argument can be made that the heavy workload in the first half of the 1950s eventually took a toll on Robert’s right arm. But you can also look at the fact that from 1956-66, he still pitched to a 3.78 earned run average.

How the Game Has Changed

The AL and NL 2012 Cy Young Award Winners (Robbie Ray and Corbin Burnes) made a combined 60 starts, with zero complete games.

Now to close, here’s a look at some of the category leaders from the years during which I formed my attachment to the National pastime.

Primary Resources: Baseball-Reference.com; The Baseball Maniac’s Almanac, Edited by Bert Randolph Sugar, with Ken Samuelson (Skyhorse Publishing); Spartan Legend Robin Roberts Passes Away, May 6, 2010, MSUSpartans.com.


Baseball Roundtable … blogging baseball since 2012. 

100Baseball Roundtable is on the Feedspot list of the Top 100 Baseball Blogs.  To see the full list, click here.

I tweet (on X) baseball @DavidBaseballRT

Follow Baseball Roundtable’s Facebook Page here.  More baseball commentary; blog post notifications.

Member: Society for American Baseball Research (SABR); The Baseball Reliquary; The Negro Leagues Baseball Museum.

The Sandy Alcantara/Babe Ruth Connection

In 1920, Babe Ruth dominated the home run category when it came to MLB statistics. Ruth launched 54 home runs that season, nearly three times the next highest t0tal (19 for the Saint Louis Browns’ George Sisler) and more than all but one of the remaining MLB teams (the Phillies hit 64 home runs as a team).

Yesterday (September 18), Marlins’ right-hander Sandy Alcantara tossed his fifth complete game of the 2022 season – running his record to 13-8, 2.37 and his league-leading innings pitched to 212 2/3.

The Babe Ruth connection? Alcantara’s dominance of the statistical category.  (Keep in mind, Baseball Roundtable “connections” reflect how I look at baseball statistics and may be stretched at times.) Alcantara’s five complete games are more than any other MLB team (the Red Sox, Astros, Phillies and Cardinals have three each … and half of MLB’s 30 teams have yet to record a complete game this season).  The only pitchers with more than one complete game so far this season are Alcantara, the Astros’ Framber Valdez (3) and the  Phillies’ Aaron Nola (2).

A few observations:

  • In addition to his five 2022 complete games, Alcantara completed nine shutout innings in a Marlins’ 10-inning, 2-1 loss to the Nationals on June 8.
  • The last time we saw an MLB pitcher log as many as five complete games in a season was 2017 (Corey Kluber, Indians).
  • Alcantara’s 212 2/3 innings pitched lead MLB by a notable margin (The Cardinals’ Miles Mikolas is second at 187 1/3).
  • Alcantara has averaged 7+ inning in his 30 2022 starts.
  • Alcantara tied for the 2019 NL complete-game lead with two complete games.
  • Thus far in the 2022 season, only 0.6 percent of starts have resulted in a complete game (as opposed to 16.7 percent of Alcantara’s starts.

Here’s a historic perspective on complete games (I chose not to use the shortened 2020 season). Note: This chart, previously published in Baseball Roundtable has been updated to include Negro League records from 1920-48, which have been added to the MLB record book.,

As you might expect, the chart shows a steady decline in complete games.

Now, a few Baseball Roundtable musings on complete games.  (Note: This is not presented as criticism, just a look at how the game has changed.)

It wasn’t until 1955 that we saw an AL/NL leader in complete games with less than 20 finished starts (Whitey Ford, Yankees, 18 CGs).  And, 1980 was the first year that a league leader notched less than 14 complete games.  The last time we saw 20 complete games in a season?  Fernando Valenzuela in 1986.  James Shields, in 2011, became the first pitcher to reach double-digits (11) in complete games in a dozen years – and earned a reputation as an iron man.

Jack Taylor and Will White – Finishing What They Started.

Between 1901 and 1906 (Cubs and Cardinals),  Jack Taylor threw a record 187 consecutive complete games (with 15 relief appearances interspersed).  Then there’s Will White (Cincinnati), who, in 1879, completed a single-season record 75 complete games (in 75 starts).  White went 43-31 that year, with a 1.99 ERA and 680 innings pitched.  For his career, White completed 394 of 401 starts. 

How different is today’s game?  In 2021, the MLB co-leaders in complete games (Adam Wainwright, German Marquez, and Zach Wheeler) each threw three complete games.   In September of 1908, Walter Johnson threw three complete-game shutouts in four days – and might have done it in three days, except for baseball’s sabbath laws.

Cy Young – Library of Congress photo.

The record for career complete games belongs to Cy Young at 749.  Young completed 91.9 percent of his starts. The active leader in career games is Adam Wainwright, with 28 in 387 starts (7.2%) over 17 seasons.   Babe Ruth, by the way (to continue the Babe Ruth connection), tossed 107 complete games in 147 career starts. 

As complete games have dropped, the numbers of pitchers used in each game have risen.  In the 1950’s, when I started watching major-league baseball, you were likely to see four pitchers per game (the average in 1950 was 2.01 pitchers per team/per game).  In 2021, you were more likely to see between eight and nine players take the mound in a game (the average was 4.44 pitcher per team/per game). Through September 18 of this season, the average is 4.29 pitchers per team/per game.  Note: Starting pitchers are included in the count.

Jim Devlin, A Complete-Game Machine

In 1877, Jim Devlin of the National League’s Louisville Grays started and completed all 61 of the team’s games– the only pitcher ever to pitch all of a team’s innings in a season.  This, by the way, came one season after he started all but the final game of the Grays’ season (a record 68 consecutive games pitched in) and finished 66 of them.  Devin logged a total of 1,181 innings. Side Note: Sadly, Devlin’s career was cut short when he was banned after the 1877 season, as the result of a game-fixing scandal. 

—–Baseball Roundtable’s Take on the Decline in Complete Games—–

So, why the dramatic decline in complete games?

Five-man Rotations … and. more recently “openers” and “bullpen games.”

In baseball’s early days, teams got by with two or three primary starters. Even in the 1960’s a four-man rotation was pretty common. As we moved into the 1970s, teams started moving to five-man pitching rotations.  Fewer starts, fewer opportunities for wins, complete games, innings pitched.   (Notably, swifter travel  – trains not planes – contributed somewhat to this.  In the days of train travel, more travel time meant more days between series and fewer pitchers were needed. )

In 1968, when Bob Gibson went 22-9, 1.12 for the Cardinals, he tossed 28 complete games (13 shutouts) in 34 starts. 

 More recently, in a strategy first led by the Rays, teams are going to the use of relief pitchers as “openers,” sometimes followed by a primary pitcher and late-inning relievers – or even entire “bullpen” games, with a series of reliever each taking on one or two innings.

The “Quality” Start

In today’s game, six innings and three or fewer runs is a “Quality Start.”   Starting pitchers, as recently as the 1980’s, would have considered six innings pitched a day off.  The quality start has helped change the way fans (as well as managers and pitchers) look at starting pitchers’ performances. Pitchers simply are no longer  expected to finish what they start.  Consider this statistic. (Note: Negro League stats not yet incorporated.)

Average Innings Pitched Per Start

1920              7.4

1940             6.9

1960              6.4

1980              6.3

2000             5.9

2021              5.0

Through September 18 of this season, starters are averaging 5.2 innings pitched per start.

Brief Baseball Roundtable Rant

A quality start is defined as six innings pitched and three or fewer earned runs allowed. Through September 18, MLB’s average earned run average was 3.98. So, you can pitch below the league ERA average and earn a quality start.  

The Advent of the Save

Years ago, relief pitchers were mostly starters past their prime brought in to “mop up.”   In fact, the “save” was not even established as a statistic until 1969 (saves were awarded retroactively for seasons prior to 1969).  Today, relievers are more valued and respected then ever – which leads us to the next point – the rise of relief specialists.

The Rise of Relief Specialists

Today, not only does the manager look to the closer (primarily for the ninth inning), the bullpen also features key “set up” men, earmarked for the seventh or eighth innings.  And, not only do most teams have their seventh- and eighth-inning specialists, we also see “arms” in the bullpen ready for long- and middle-relief.  Recently, until the recent  change (requiring a pitcher to faced at least three batters or finish an inning), even one-batter (lefty or righty), specialists were stalwarts in MLB bullpens. No wonder managers are so quick with the hook.  They’ve got to keep that well-paid dollar bullpen happy.

The Dreaded Pitch Count

And, of course, there is the “pitch count,” considering the financial investment teams have in pitchers, the thinness of pitching staffs (we do, after all, now have thirty teams), pitchers are treated with great care, often held to pitch counts in the neighborhood of 100 – no matter how well they are throwing.  Pitchers simply are throwing less these days.

Phil Humber threw only one complete game in his eight-season MLB career – and it was a perfect game.  Why is it included in this pitch count section? He needed just 95 pitches to complete the outing. 

Strikeouts

The growing emphasis on strikeouts has also contributed to the decline in complete games (particularly when combined with pitch counts).  The fact is, it most often takes more pitches to rack up strikeouts than to pitch to weak contact.  (In most cases, it also requires an increased focus on velocity, also tougher on the arm.) Consider the record of Warren Spahn, who led the National League in complete games an MLB-record nine times, won 20 or more games in 13 seasons and led the league in strikeouts four times – yet averaged just 4.4 strikeouts per nine innings, never struck out 200 batters nor six batters per nine innings in a season.

Strikeouts Per Nine Innings

1900           2.4

1920            2.9

1940             3.7

1960             5.2

1980            4.8

2000             6.5

2021             8.9

Through September 18, the 2022 average is 8.5 whiffs per nine innings.

Sidebar – Innings Pitched Leaders

From 1950-59, Robin Roberts AVERAGED 301 innings pitched (and 23.7 complete games) per season.  And, if you pick any decade from 1900 through 1979, the average innings pitched for the league leaders was over or very near 300.  However, innings pitched have dropped significantly since Steve Carlton became the most recent pitcher to hurl 300 innings in (1980).  For the last decade, the average for league leaders has been shy of 250.  In 2021, Robbie Ray led the National League with 193.1 innings pitched.  

Here’s the chart of average innings pitched by league leaders (by decade) with major strike-shortened seasons deleted:

Decade                 Average Innings Pitched by League Leaders*

1909-09                                                350

1910-19                                                348

1920-29                                                318

1930-39                                                304

1940-49                                                305

1950-59                                                294

1960-69                                                303

1970-79                                                327

1980-89                                                279

1990-99                                                261

2000-09                                                244

2010-19                                                 231

*Negro Leagues with their short seasons not included.

______________________________

One final complete-game tidbit. Between My 14 and June 4, 1969, the Dodgers’ Don Drysdale pitched an MLB-record six consecutive complete-game shutouts,

________________________________

So, there are BBRT’s random musings about complete games.   I do kind of miss them, but that’s the way today’s game is played. Guess, I’ll have to take in a Sandy Alcantara start,

Primary Resources:  Baseball-Reference.com; MLB.com; Baseball-Almanac.com.

Baseball Roundtable … blogging baseball since 2012. 

100Baseball Roundtable is on the Feedspot list of the Top 100 Baseball Blogs.  To see the full list, click here.

I tweet (on X) baseball @DavidBaseballRT

Follow Baseball Roundtable’s Facebook Page here.  More baseball commentary; blog post notifications.

Member: Society for American Baseball Research (SABR); The Baseball Reliquary; The Negro Leagues Baseball Museum.


From Mackey to Mickey and Much More … A Look at MLB’s Switch-hitting Leaders

Who was the first switch-hitter not named Mickey Mantle to reach 40 home runs in a single MLB season?


On August 11, 1956, in the seventh inning of a Yankees’ 10-5 loss to the Orioles (in New York), Yankees’ CF Mickey Mantle took the Orioles’ Hal Brown deep to RF for a three-run home run – becoming the first MLB switch-hitter to reach 40 home runs in a season. Just over one month later (September 18, 1956), Mantle popped his fiftieth long ball of the campaign (off Billy Pierce in the eleventh inning of a 3-2 Yankees’ win in Chicago) – becoming the first switch- hitter to reach 50 home runs in a single season. (Mantle finished the year at .353-52-130; winning the Triple Crown.)

Mantle is still the only switch hitter to hit 50 home runs in a season. (He did it once again with 54 long balls in 1961). Mantle remained the only switch-hitter to reach 40 homers in a season for (appropriately) 40 years.  Since 1996, six switch-hitters have joined Mantle in the 40-home run club.

As noted above, the question leading into this post is “Who was the first switch-hitter not named Mickey Mantle to reach 40 home runs in a season?”

The answer is Mets’ catcher Todd Hundley, who hit his 40th round tripper of the 1996 season in the seventh inning of a Mets’ September 8 win over the Braves in Atlanta. (Side note: Another switch-hitter, the Braves’ Chipper Jones, in just his  second full MLB season, hit his 30th home run of the campaign in the same game. Jones, by the way, was at shortstop for that contest.)  It didn’t take long for a third switch-hitter to join the 40-homer club. Nineteen days after Hundley’s blast, the Padres’ switch-hitting 3B Ken Caminiti, hit his 40th long ball of the 1996 season.  Hundley finished the 1996 season at .259-41-112, achieving  would be his career high in home runs, RBI, runs scored (85), hits (149) and doubles (32).

Before we go on to look at some additional switch-hitting record holders, a little more about Todd Hundley. Hundley had some good baseball genes. He was the son of Randy Hundley, who played catcher  in 14 MLB seasons (1964-77) – and was a one-time All Star (1969 Cubs). The younger Hundley also played in 14 MLB seasons (1990-2003) and outdid his father with two All Star selections and a .234-202-599 stat line to his father’s .236-82-281.

Todd Hundley was a second-round draft pick (Mets) in 1987 (out of William Fremd High School). He made his major-league debut (as a 20-year-old) on May 18, 1990. Over his 14-season MLB career (1990-2003 … Mets, Dodgers, Cubs), he topped 20 home runs in four seasons and 100 RBI once. Hundley’s best MLB seasons were clearly 1996 and 1997. He followed his 1996 .259-41-112 stat line with .273-30-98 in 1997.

One – or 41 – for the Record Books

In 1996, when Todd Hundley hit 41 home runs, they were the most home runs in a season by a player in the catching position. Johnny Bench (who hit right-handed) had hit 45 in 1970, but six of those came when he was in the lineup as an outfielder and one as a first baseman.  Right-handed hitting Javy Lopez broke Hundley’s record in 2003 with 42 long balls as a catcher (43 overall), still the most home runs in a season while in the lineup as a catcher.  Right-handed hitting Salvador Perez hit 48 home runs in 2012 (the most for a player playing primarily as a catcher), but 15 of those came as a DH.

Now let’s get back to a look at switch-hitting leaders.

Note: Batting average leaders in 100+ game seasons: Tuck Turner, 1894 Philadelphia Phillies (National League), .418 (Turner played 82 of 132 games);  Tommy Tucker, 1889 Baltimore Orioles (American Association), .372; Roger Connor, 1885 New York Giants (National League), .371.  Mickey Mantle‘s .365 average for the 1957 Yankees is the highest average for a switch-hitter in a post-1900 season in which his team played 100 or more games.  

Biz Mackey – Career and Single-Season Batting Average

Photo: 1924_Negro_League_World_Series.jpg: J.E. Mille[r], K.C.derivative work: Delaywaves talk • contribs, Public domain, via Wikimedia Commons

Hall of Famer Biz Mackey was not only a great defensive catcher, but also a versatile fielder and  an offensive force. You’ll find his average at the top of the list for switch-hitters in both the single-season and career categories. Thank you, MLB for adding Negro League stats from 1920-1948 to the MLB  record books. Mackey played in 22 seasons (all in the Negro Leagues), suiting up at every defensive position (617 at C; 60 at 1B; 33 at 2B; 60 at 3B; 70 at SS; 145 in LF; 2 in CF; 22 in RF). He even took the mound seven times (three starts), albeit to a 7.52 ERA.  From 1920 through 1929, Mackey hit .348-45-454 in 582 games – never averaging below .312 in any season. He played in five East-West All Star Games and in 26 Negro Leagues post-season games (hitting .327).

Just Ask Another Hall of Fame Catcher How He Measured Up

“In my opinion, Biz Mackey was the mater of defense of all catchers,”

                         Hall of Famer Roy Campanella

                          (From Biz Mackey’s Baseball Hall of Fame Bio)

________________________________________

Mickey Mantle – Career and Single and Season Home Runs

Mickey Mantle is the power leader among MLB switch hitters. There have been just two seasons of 50 or more home runs by switch-hitters in MLB history and both belong to Mantle. There also have been just  11 seasons of 40 or more homers by switch-hitters in MLB history (including Mantle’s two 50-HR seasons) and Mantle has four of those.

He is, as expected, also at the top of the switch-knitting career home runs list.  Mantle played in 18 MLB seasons (1951-68), going .298-536-1,509. The Hall of Famer was an All Star in sixteen seasons, a three-time AL MVP and  a one-time Gold Glover. He led the league in home runs four times, runs scored five times, total bases three times; RBI once and batting average once. Over his career, Mantle hit 30 or more home runs in nine campaigns.

A Career Saved

When Mickey Mantle was 14-years-old, osteomyelitis (aggravated by a football injury) led doctors to recommend amputation of Mantle’s leg. His parents sought a second opinion and the condition was treated with heavy doses of penicillin – saving the leg and Mantle’s future in sports.

Mantle holds the World Series records for home runs (18), RBI (40); runs scored (42), total bases (123) and walks (43).

____________________________________

Mark Teixeira and Eddie Murray – Single-Season and Career RBI Leaders

Photo: Keith Allison, CC BY-SA 2.0 <https://creativecommons.org/licenses/by-sa/2.0>, via Wikimedia Commons

Mark Teixeira sent the mark for single-season RBI among switch hitters in 2005 – a season in which the Rangers’ first baseman played all 162 games and hit .301-43-144. Teixeira played in 14 MLB seasons (2003-2016 … Rangers, Braves, Angels, Yankees). He was a three-time All Star, hit 30+ home runs in nine season and drove in 100+ runs in eight. He finished with a.268-409-1,298 stat line. He also won five Gold Gloves.

Those Were the (College) Days My Friends

In three seasons at Georgia Tech (1999-2011), Mark Teixeira played in 140 games, hitting .409, with 36 home runs and 165 RBI. He was the fifth player chosen in the June 2001 MLB draft.

Teixeira and Nick Swisher share the record for the most times hitting a home run from both sides of the plate in a single game at 14.


Hall of Famer Eddie Murray tops all switch hitters in career RBI at 1,917 (in 21 MLB seasons – 1977-97 … Orioles, Dodgers, Mets, Indians, Angels). While he drove in 100 or more runs in six seasons, he only led the league in RBI once, with 78 in the strike-shortened 1981 season. The Hall of Famer and eight-time All Star is also one of just two switch-hitters to reach 500 career home runs. He hit 30 or more home runs in five seasons and 20 or more in another 11.  Murray was the 1977 AL Rookie of the Year, an All Star in eight seasons and a three-time Gold Glover at first base. Over his career, Murray hit 19 Grand Slam home runs, the most by any switch-hitter.

Eddie Murray holds the MLB career record for career sacrifice flies with 128.


Pete Rose and Willie Wilson – Single-Season and Career Base Hits

Pete Rose can be fond atop the switch-hitter leaderboard in single-season and career base hits. In fact, he leads all batters in MLB history in career safeties. Rose played 24 MLB seasons (1963-86 … Reds, Phillies). He is the MLB leader in games played (3,562); plate appearances (15,890); at bats (14,053); and hits (4,256).

Pete Rose was an All Star Game starter at five different positions: 1B, 2B, 3B, LF, RF.

Rose’s  final career line was .303-160-1,314, with 2,165 runs scored. He was a 17-time All Star and led the league in hits seven times (ten seasons of 200+ hits); runs four times; doubles five times; and batting average three times.

For the Love of the Game

“I’d walk through hell in a gasoline suit to play baseball.

                                                 Pete Rose

Tied with Rose atop the single-season leader in base hits in season (among switch-hitters) is Willie Wilson, who collected 230 safeties in 1980 (for the Royals), while putting up a .326-3-49 line with a league-topping 133 runs scored. Wilson played in 19 MLB seasons (1976-1994 … Royals, Cubs, A’s). The two-time All Star won one batting title, led the league in hits once, triples four times and stolen bases once. He retired with a .285-41-585 stat line, with 1,169 runs scored and 668 stolen bases. He stole 30 or more bases in 11 seasons (forty or more in seven of those seasons), with a high of 83 (in 95 attempts) in 1979.

A Surprise on the “Hit List”

Omar Vizquel recorded the fourth-most MLB base hits among switch hitters (44th All Time), with 2,807 safeties over 24 seasons (1989-2012 … Indians, Mariners, Giants, White Sox, Rangers, Blue Jays).  He hit .272 over 2,968 games – hitting .300 or better in just one season.

__________________________________________________

Other Switch-Hitter Leaders:

Runs Scored:  Season:  Max Carey, 1922 Pirates (140).    Career: Pete Rose (2,165)

Doubles: Season: Jose Ramirez, 2017 Indians (56). Career: Pete Rose (746)

Triples: Season: George Davis, 1893 Giants (27). Career: Roger Connor (293)

Total Bases: Jimmy Rollins, 2007 Phillies (380). Career: Pete Rose (5,752)

Primary Resources: Baseball-Reference.com; Baseball Almanac.com; The BaseballCube.com; Mickey Mantle SABR bio by James Lincoln Ray.


Baseball Roundtable – Blogging Baseball Since 2012. 

BASEBALL ROUNDTABLE ON THE TOP 100 BASEBALL BLOG LIST

100Baseball Roundtable is on the Feedspot list of the Top 100 Baseball Blogs.  To see the full list, click here.

I tweet (on X) baseball @DavidBaseballRT

Follow Baseball Roundtable’s Facebook Page here.  More baseball commentary; blog post notifications.

Member: Society for American Baseball Research (SABR); The Baseball Reliquary; The Negro Leagues Baseball Museum.

Mike Trout’s Seven Straight Games with a Long Ball – and Those Who Did Him One Better

The Thirteenth unlucky for Mike Trout … and Cleveland fans

Mike Trout .. . Hit long ball, round bases, high five repeat.
Photo by Keith Allison

Yesterday (September 13, 2022), Mike Trout went zero-for-three (one walk) as his Angels lost to the Guardians 3-1 in Cleveland. While I’m sure the Cleveland fans enjoyed the win, they did miss the chance to see a bit of MLB history. Trout’s zero-for-three ended a streak of seven straight games in which he had gone yard – leaving him one shy of the record consecutive games with a home  run. Surprisingly, during his hot streak, the Angels went 3-4 (outscoring their opponents just 33-28, with Trout driving home one-third of the Angels’ tallies).

Trout’s offensive outburst should not be too much of a surprise.  A first-round (25th overall) 2009 draft pick out of Millville (NJ) Senior High, Trout made his MLB debut July 8, 2011 (at the age of 19).  In three minor-league seasons, the teenager had risen from rookie ball to Double-A, hitting a combined .338, with 22 home runs and 102 stolen bases in 266 games.

As high school senior,  Mike Trout hit .531 (81 at bats), with 18 home runs and 21 steals.

While he hit just .220 in 40 2011 games for the Angels, Trout became a regular in the Angels’ outfield in 2012, hitting .326-30-83, leading the league in runs scored (129) and steals (49) – and winning Rookie of the Year honors. To date, he has been a 10-time All Star (missing just 2020) and three-time AL MVP.  He had topped hit 30 or more home runs in seven seasons (35 so far this year), driven in 100+ runs three times, scored 100+ runs in seven campaigns, hit over .300 in six seasons and stolen 30 ore more bases three times. Even without the eighth consecutive games with a home run, he is building quite a Hall of Fame Legacy.

With that on the books, let’s take a look at the players who are on the short list of those with homers in eight consecutive games.  Dale Long, Don Mattingly and Ken Griffey, Jr. (Side note:  All thee began their professional careers as teenagers. Not really that important, but the kind of coincidence The Roundtable notices.)

______________________________________________________

A brief interruption before we return to our regular programming.

Time here for a short rant about #HowTheGameHasChanged. Yesterday, I was at a Twins game and Twins’ rookie starter Joe Ryan coasted through the first seven innings with a no-hitter (versus the Royals). After seven frames, he had given up two walks, fanned nine, tossed 106 pitches and was enjoying a 6-0 lead.

My very clean scorecard during Kershaw’s outing and a very clean scoreboard during Ryan’s.

As the eighth opened, Twins’ Rocco Baldelli brought in rookie reliever Jovani Moran (to significant booing from the crowd). Now, I didn’t join in the chorus of displeasure, but (as a fan) I was not really happy with the decision. Still, we could at least hope for the Twins’ first-ever combined no-hitter (and by two rookies no less). Alas, it was not to be, as Moran lost the no-no with one out in the ninth – giving up two walks, followed by an RBI double to Bobby Witt, Jr. (Moran eventually gave up a another hit and a total of three runs in the inning.)

All of this took me back to a game I attended on April 13 – with the Twins facing the Dodgers at Target Field. Despite the fact that the Twins were down 3-0, there was plenty of drama on the field and plenty of excitement in the crowd – as many of us anticipated a chance to see Dodgers’ starter Clayton Kershaw try for MLB’s 24th-ever Perfect Game.  After seven innings (Does this timing sound familiar?), Kershaw had thrown just 80 pitches (53 strikes) and had fanned 13 batters – with only three balls had been hit out of the infield. He was cruising and it was a masterful performance to watch.

Like Ryan, Kershaw did not come out to pitch the eighth. Dodgers’ manager Dave Roberts instead put in Alex Vesia. The change was met with a chorus of boos, from Twins’ fans and a large contingent of Dodger Faithful seated behind the third base dugout.

Now, there’s never been a combined Perfect Game, so I had a bit of hope. One out and five pitches after Vesia took the mound, Twins’ catcher Gary Sanchez lined a single to right and the Perfect Game and even the no-hitter were gone. (The Twins, ultimately, lost 7-0 and Sanchez’ single was their only safety.)

Side note:  I later learned, via the Elias Sports Bureau, that only once before ( since 1900) has an MLB pitcher been pulled after the seventh inning with a Perfect Game intact.  Both times, Roberts was the manager.  (The first was on September 10, 2016, when he pulled Rich Hill – a reported finger issue –  after seven innings with Perfect Game intact against the Marlins (and the Dodgers up 5-0). Hill had thrown 89 pitches (62 strikes) and fanned nine. Hill was replaced by Joe Blanton and ten pitches and two outs later, Marlins’ LF Jeff Francoeur collected the first of two Miami hits in the game.

In both the Ryan and Kershaw  games, I found myself trying to imagine what would have happened in the same situation with the likes of  Jack Morris, Bob Gibson or Don Drysdale on the bump.  I understand managers looking ahead and trying to protect their pitchers, so I can’t be too critical.  But, as a fan, I can be disappointed when a pitcher is pulled with a late-inning no-hitter or perfect game intact.  I’ll resist starting the next sentence, “Back in the day ….”

_________________________________________________

Now, back to the three players who share the record for consecutive games with a home run at eight.

Dale Long … 1956 Pirates

Dale Long’s path to the big leagues was not an easy one. Signed, in 1944,  at age 18, after a stint in the Navy, Long  made his major-league debut on April 21, 1951 (after seven minor-league seasons … and 11 minor-league teams with four different franchises.). He was back in the minors by mid-season (after hitting .231-3-12 in 44 games for the Pirates and Browns).

He didn’t make its back to the MLB diamond until 1955, again with the Pirates. In his first season as a big-league regular, the lefty first basemen hit .291-16-79  and the led NL in triples with 13.

The following season – the year of his eight-game home run streak – Long made his only All Star team, hitting .263-27-91 in 148 games for Pittsburgh.  (The 27 long balls and 91 RBI would prove to be career highs.

Overall, long played ten MLB seasons (Pirates, Browns, Cubs, giants, Yankees, Senators,), hitting .267-132-467 in 1,013 games. He hit 20 or more homers in four season and .290 or better twice.

The Pirates went 7-1 during Long’s  home run streak, outscoring their opponents 44-22, with Long driving in 19 of the 44 runs.

______________________________________________

Don Mattingly, 1987 Yankees

Don Mattingly had his eight-game home run streak in 1987, in the midst of his fourth straight All Star campaign, third straight season of 30 or more home runs, fourth  straight season of 100+RBI and fourth straight season hitting .325+. He was, in fact, at the peak of his career. The previous three seasons, he had led the league in hits twice, doubles three times, RBI once, batting average once, total bases twice and slugging percentage once.

Mattingly was  19th round draft choice, out of Reitz Memorial High School. He had worked his way from Low-A to Triple-A over four seasons (1979-82), hitting .332 in 457 games. He had yet to develop his power stroke, however, with only 20 home runs on his resume.  He made his MLB debut, as a 21-year-old, for the Bronx Bombers on September 8, 1982 and earned a spot as a regular in the Yankee lineup by the following June. In 1984, his first full MLB season, the 23-year-old Mattingly was the AL batting champ – putting up a .343-23-110 line.  He went on to a 14-season MLB career (1982-95), all for the Yankees – hitting .307-222-1,099; was an All Star six straight seasons (1984-89); earned nine gold Gloves at first base; and was the 1985 AL MVP.

In 2020, Don Mattingly was the NL Manager of the Year – leading the Marlins to a 31-29 record – good for second place (NL East) in the COVID-shortened season.

Despite Mattingly’s eight-game output – 10 home runs and 21 RBI – the Yankees only went 5-3 in his streak. (They did outscore their opponents 55-36, but that included a 13-4 win over the Twins and a 12-3 victory over the Rangers.)


_____________________________________________

Ken Griffey, Jr., 1993 Mariners

Ken Griffey Jr. was signed, as a 17-year-old, in the first round (first overall) of the 1987 draft (Mariners).

Ken Griffey Jr. (Archbishop Moeller High School, Cincinnati) was the 1987 U.S. High School Baseball Player of the Year. 

As a 17-year-old, Griffey hit .313-14-40, with 13 steals at Low-A Bellingham (54 games). The following season, he hit .325-13-52, with 36 steals at A and Double-A (75 games.)

In 1989, at 19-years-old), Griffey was a regular in the Seattle outfield.  The rest is history.  He went on to a 22-season, Hall of Fame career – hitting .284-620-1,836, with 184 steals in 2,671 games. Griffey hit 40 or more home runs in seven seasons, with two seasons (1997-98) of 56 roundtrippers. He also collected 100 or more RBI eight times. He was a 13-time All Star, ten-time Gold Glover and the 1997 AL MVP (when he hit .304, and led the league with 56 home runs, 125 runs scored, 147 RBI and 398 total bases.

During Griffey’s 1993 home run streak, the Mariners won five of the eight games – outscoring their opponents by just four runs  52-48.


______________________________________________

Just a Little (Big, Really) Baseball Roundtable Long Ball Bonus

Most fans recognize 1968 as “The Year of the Pitcher.”  The overall MLB earned run average was 2.98; Bob Gibson put up a 1.12 ERA; Denny McLain won 31 games; only six qualifying MLB hitters hit .300 or better and Carl Yastrzemski won the AL batting title with a .301 average. Pitching was so dominant, MLB lowered the mound five inches for the 1969 season.

Yet, somehow – in the midst of all this pitching dominance – the Washington Senators’ big (6’8” – 260-lb.) OF/1B Frank Howard put together one of the most explosive offensive weeks in MLB history. From Sunday May 12 through Saturday May 18, in just 25 plate appearances (in six games), Howard banged out thirteen hits – including ten home runs and one double – and drew one walk (for a .542 average).  He also scored ten times and drove in 17 tallies. Side note: Surprisingly, the Senators went 3-3 over Howard’s streak.  Howard’s ten home runs remain MLB’s record for home runs in a week.  

Howard’s game lines during the streak looked like this:

  • May 12 … two-for-four, two runs scored, two RBI, two home runs.
  • May 14 … three-for-four, two runs scored, three RBI, two home runs.
  • May 15 … two-for-four, one run scored, two RBI, one double, one home run.
  • May 16 .… two-for-four, two runs scored, four RBI, two home runs.
  • May 17 … one-for-four, one run scored, two RBI, one home run.
  • May 18 … three-for-five, two runs scored, four RBI, two home runs.

Howard picked on some pretty good hurlers during his streak.  Three of the long balls came off the Tigers’ Mickey Lolich,  who went 17-9, 3.19 on the season and won three games in the 1968 World Series. Another pair of the record-setting round trippers came off “Sudden” Sam McDowell, who – while he only went 15-14 that season – put up a 1.81 earned run average and led the AL with 283 strikeouts.   Howard also showed he could “hit ‘em anywhere.” Only two of the ten long balls came at home – and his streak also included home runs in Boston, Cleveland and Detroit.

Howard came into the streak with a.300 average on the season (which he raised to .347 during the six games). Notably, he didn’t “come in hot,” he had  just three hits (.130 average) over his previous six games.

Primary Resources:  Baseball-Reference.com; MLB.com; Elias Sport Bureau.


Baseball Roundtable – Blogging Baseball Since 2012. 

BASEBALL ROUNDTABLE ON THE TOP 100 BASEBALL BLOG LIST

100Baseball Roundtable is on the Feedspot list of the Top 100 Baseball Blogs.  To see the full list, click here.

I tweet (on X) baseball @DavidBaseballRT

Follow Baseball Roundtable’s Facebook Page here.  More baseball commentary; blog post notifications.

Member: Society for American Baseball Research (SABR); The Baseball Reliquary; The Negro Leagues Baseball Museum.

A True Journeyman Officially Retires

Photo by Keith Allison

On Friday (September 9, 2022), righthander Edwin Jackson – who played for more major-league teams (14) than any other player – officially announced his retirement from the playing field.  The announcement came on his 39th birthday and on the 19th anniversary of his first appearance on a  major league-mound.

While Baseball Roundtable has written about Jackson’s travels before, this seems an appropriate to to again reflect on his career and, in The Roundtable’s “one things leads to another” tradition, also take a look at Jackson’s unexpected no-hitter, and a few other record-setting journeymen.

Jackson, who has not pitched in the major leagues since 2019, had a career record of 108-133, 4.78 in 412 MLB games (318 starts) over 17 seasons. In 1,960 innings pitched, he fanned 1,508 and walked 779.  Jackson was an All Star in 2009, when he went 13-9, 3.62 in 33 starts for the Tigers. In his MLB career, he won ten or more games in five seasons.  In six of his 17 MLB seasons, Jackson pitched for more than one major-league team.

Jackson’s record – year-by-year and team-by-team.

How did he do it?

2001

  • Drafted by the Dodgers in June.

2003

  • Debuted with the Dodgers on September 9.

2006

  • June 14 – Traded by the Dodgers to the Rays. (Jackson and Chuck Tiffany for Danys Baez and Lance Carter.)

2008

  • December 10 – Traded by the Rays to the Tigers. (Jackson for Matthew Joyce.)

2009

  • December 8 – Went from the Tigers to the Diamondbacks in a three-team trade. (The Tigers sent Curtis Granderson to the Yankees; the Yankees sent Phil Coke and Austin Jackson to the Tigers; the Yankees sent Ian Kennedy to the Diamondbacks. The Diamondbacks sent Max Scherzer and Daniel Schlereth to the Tigers. So, ultimately, the Tigers turned Jackson and Granderson into Coke, Austin Jackson, Scherzer and Schlereth.)

2010

  • July 30 – The Diamondbacks traded Jackson to the White Sox. (Jackson for David Holmberg and Daniel Hudson.)

2011

  • July 27 – Jackson was traded by the White Sox to the Blue Jays and (on the same day) from the Blue Jays to the Cardinals. (Jackson went to the Blue Jays – with Mark Teahen – for Jason Frasor and Zach Stewart. He then went to Cardinals – with Octavio Dotel, Corey Patterson and Marc Rzepczynski – for Trevor Miller, Colby Rasmus, Brian Tallet and P.J. Walters.)
  • October 30 – Granted free agency

2012

  • February 2 – Signed with the Nationals.
  • October 29 – Granted free agency.

2013

  • Signed with the Cubs.

2015

  • July 27 – Released by the Cubs.
  • August 14 – Signed with the Braves.
  • November 2 – Granted free agency.

2016

  • January 13 – Signed with the Marlins.
  • June 2 – Released by the Marlins.
  • June 29 – Signed with the Padres.
  • November 3 – Granted free agency.

2017

  • April 5 – Signed with the Orioles.
  • June 13 – Granted free agency.
  • June 16 – Signed with the Nationals.
  • November 2 – Granted free agency.

2018

  • January 11 – Signed with the Nationals.
  • June 1 – Released by the Nationals.
  • June 6 – Signed with the A’s.
  • October 29 – Granted free agency.

2019

  • April 11 – Signed with the A’s.
  • May 19 – Purchased from the A’s by the Blue Jays.
  • July 19 – Released by the Blue Jays.
  • July 0 Signed by the Tigers.
  • October 31 – Granted Free Agency.

2020

  • February 3 – Signed by the Diamondbacks.
  • May 22 – Released by the Diamondback.

While Jackson had not pitched in the major leagues since 2019, he was part of the U.S. Olympic baseball team that won the Silver Medal in 2012.

______________________________________________

Edwin Jackson’s Unlikely No-Hitter

On June 25, 2010, Edwin Jackson and his Diamondbacks were facing the Rays in Tampa Bay.  Jackson, in his eighth MLB season, was playing for his fourth MLB team. Ironically, he had been traded away from the Tigers after his only All Star campaign (2009, when he put up a 13-9, 3.62) record for the Bengals.  Jackson got off to a slow start for Arizona and came into the June 25, 2010, game with a 4-6 record and a 5.05 earned run average on the season.  That day in Tampa Bay, however, he was unhittable – and unscored upon. Still, despite the 1-0 final score, it wasn’t a classic gem of a no-no.

In his June 25, 2010 no-hitter,  Edwin Jackson threw 149 pitches (79 strikes) – acknowledged as the highest total ever in a no-hit game.

Here are just a few facts about Jackson’s no-hitter – one that no one saw coming, particularly after the first three frames.

  • Jackson started the game with an earned run average (on the season) north of 5.00.
  • Jackson went to a three-ball count on the first four batters he faced – walking two.
  • Jackson also walked two more in the second inning and walked the bases full with no one out in the third.
  • In the first three innings, Jackson threw 70 pitches.
  • For the game, Jackson walked eight and hit a batter – and the Rays left nine runners on base.
  • Over his nine innings, Jackson went to a three-ball count on 13 of the 36 batters he faced.
  • It was Jackson’s first – and, ultimately, only – complete game of the 2010 season.

Side note: Just five week after his no-hitter, Jackson was traded from the Diamondbacks to the White Sox.

________________________________________________

Now, now about a look at a few other MLB journeymen.

—–Most Teams Played for in a Season—–

In 2018, 32-year-old right-hander Oliver Drake set a new major-league mark by playing for five MLB teams in a single season (previously more than dozen players shared the record at four).

Drake began the season with the Brewers (where he finished the previous campaign).  After going 1-0, 6.39 in eleven appearances,  he was designated for assignment on May 2 and, on May 5, purchased from the Brewers by the Indians.

He was with the Tribe until the final week in May – going 0-0,with a 12.46 ERA in just four appearances – before again being designated for assignment.

May 31, he was selected off waivers by the Angels. Sixteen days (and 0-1, 10.13 record) later, he was again designated for assignment.  He went unclaimed and reported to the Angels’ Salt Lake City Triple-A affiliate – where he was pretty much lights out.  That earned him a trip back to Anaheim, where he added four more appearances, with an 0-0, 3.00 record – and was again designated for assignment.

He was picked up (off waivers) by the Blue Jays on July 26 and was there for just two appearances (giving up three runs in 1 2/3 innings) before again being designated for assignment.

On August 3, he was selected off waivers by the Twins – his fifth MLB team of the season – where he found a bit more success and stability. Pitching for his fifth MLB team of the year, Drake finished the season with Minnesota, getting in 19 games and posting a 2.21 ERA an fanning 22 batters in in 20 1/3 innings pitched.What did that get him?  In the off-season, he was again designate for assignment.

Oliver Drake finished the 2018 season with an 1-1 record, a 5.29 ERA and 51 strikeouts in 47 2/3 innings.

For his career, Drake has pitched in six MLB seasons (2015-20 … Orioles, Brewers, Indians, Twins, Angels, Blue Jays, Rays). Over those six campaigns, he has gone 10-10, 4.27, with five saves in 196 appearances.

__________________________________________________

—-Most MLB Teams Player for In a Single Day—–

Taking the Field for Two Teams in a Single Day

Three players share the record for the most MLB teams played for in a single day at two. The first two to accomplish this feat were Max Flack and Cliff Heathcote, who were traded for each other between games of a Memorial Day 1922 Cubs/Cardinals doubleheader. (Flack going from the Cubs to the Cardinals and Heathcote vice versa.) The two outfielders each suited up against their previous team for Game Two. Both went hitless in game one of the doubleheader and both collected hits for their new teams in the second game (Flack a single in four at bats, Heathcote a pair of singles in four trips to the plate).

Joel Youngblood tied the record for teams played for in a single day in 1982, adding a twist – he played for and recorded hits for two different teams in two different cities on the same day.  Let’s look at Youngblood’s unique achievement.

On August 4, 1982, Youngblood started his day as a member of the New York Mets, who were playing an afternoon game against the Cubs at Wrigley Field. Youngblood opened the game in center field, batting third.   After striking out in the first inning, Youngblood drove in two runs with a single in the top of the third. Youngblood was unexpectedly replaced in center field by Mookie Wilson in the bottom of the fourth – and told by Mets’ manager George Bamberger that he had been traded to the Expos (for a player to be named later).

The Expos were scheduled to play in Philadelphia that night, and Youngblood immediately set out to join his new team. He managed to catch a 6:05 p.m. flight to Philadelphia – eventually arriving at Veterans Stadium with the game in progress. To his surprise, there was an Expos uniform, with his name already sewn on the back, waiting for him.  The Expos wasted no time getting their newest player into the game. Manager Jim Fanning sent Youngblood into right field and the number-two spot in the batting order (replacing Jerry White) in the sixth inning. In the top of the seventh, Youngblood singled in his first Expos’ at bat.  Thus, Youngblood collected base hits for two different teams in two different cities in one day.

Youngblood’s feat is even more startling when you consider the pitchers he touched for his two safeties. In Chicago, it was future Hall of Famer Fergie Jenkins; while in Philadelphia, it was future Hall of Famer Steve Carlton.

—-Most MLB Teams Played for  by a Position  Player —–

Matt Stairs moved around the diamond in his MLB career, primarily as an outfielder, first baseman, DH and pinch hitter.  He also moved from team to team, suiting up for position-player record 12 MLB teams (Expos, Red Sox, A’s, Cubs, Pirates, Royals, Rangers, Tigers, Blue Jays, Phillies, Padres and Nationals) in 19 MLB seasons (1992-93, 1995-2011).  In 2006, he suited up for the Royals, Rangers and Tigers – going a combined .247-13-51 in 117 games). His career stat line was .262-265-899 in 1,895 games.  His best season was either 1998, when he went .294-26-106 in 149 games for the A’s; or 1999, when he went .258-38-102 in 146 games for the Oakland squad.  Stairs hit 20 or more home runs in six seasons.

Matt Stairs holds the MLB record for career pinch-hit homers with 23. 

Primary Resources: Baseball-Reference.com; MLB.com; Baseball-Almanac.com

Baseball Roundtable – Blogging Baseball Since 2012. 

BASEBALL ROUNDTABLE ON THE TOP 100 BASEBALL BLOG LIST

100Baseball Roundtable is on the Feedspot list of the Top 100 Baseball Blogs.  To see the full list, click here.

I tweet (on X) baseball @DavidBaseballRT

Follow Baseball Roundtable’s Facebook Page here.  More baseball commentary; blog post notifications.

Member: Society for American Baseball Research (SABR); The Baseball Reliquary; The Negro Leagues Baseball Museum.

Some Doubleheader Musings … I do miss those Sunday Twin Bills

Yesterday (September 4) marked the anniversary of the day in 1928 when the Boston Braves began an MLB-record streak of  nine consecutive doubleheaders (over as 12-day span). Pretty sure we’ll never see that again.  I was going to commemorate that anniversary with a post on doubleheaders, but I had to delay that for a day because I was taking part (as a spectator) in a doubleheader of my own yesterday – taking in the number-four ranked University of Minnesota (volleyball) Gophers’ victory over number-13 Florida and the Triple-A Saint Paul Saints loss to Omaha.  So, I’ll revisit some doubleheader trivia a day late.

Note: Some of these records/lists may change as the Negro League records from  1920-48 are further documented and incorporated into MLB records. 

18 Games in 12 Days

The 1928 Boston Braves played a record nine consecutive doubleheaders over a 12-day span (September 4-15). During the streak, they swept one doubleheader, were swept six times and split two – for a four win-fourteen loss record.  Notably,  six players played every inning of those games (RF  Lance Richbourg; LF Eddie Brown; 1B George Sisler; 2B Rogers Hornsby; 3B Les Bell; SS Doc Farrell). The team used eight different starting pitchers during the 18-game stretch – none more often than Bob Smith, who started four contests (including both ends of one doubleheader).

The stretch of twin bills may have been taxing on the hurlers’ arms. The Braves got just five complete games during the span (27.8 percent of the starts) – well below the MLB average for the year of 50.7 percent and short of the Braves’ average for the rest of the season  (36.2 percent). Smith’s record may be indicative of that wear and tear. In his first start of the stretch (September 5), he tossed a complete-game two-hitter as Boston topped Brooklyn 7-1. On September 10, he tossed a second complete game, a seven-hitter, as Boston lost to the Giants 4-1.  Then on September 14, he failed to make it out of the first inning of the first game against the Giants, giving up four runs without recording an out.  Undeterred, the Braves sent him back out to start the second game of the twin bill – in which he gave up  five runs (three earned) in 6 1/3 innings – taking his second loss of the day.  Side note:  Smith recovered from that tough two-loss day. He had three more starts that season, pitching 31 1/3 innings in those games (1-2, 2.87). He finished the season 13-17, 3.87 for a Braves team that went 50-103.

Nearly 60 percent doubleheaders … Now, that’s a Tough Schedule

The 1945 Boston Braves played an MLB-record 46 doubleheaders. Let’s put that in perspective – 59.7 percent of the games they played that season were part of doubleheaders. How did they do?  They won 42 of those games, lost 48 and tied two.  Basically, they played .466 ball in twin bills, a bit better than their .403 winning percentage on days when they played just one game.  By the way, just so you don’t think those 46 doubleheaders were a one-off event, the 1943 White Sox hold the AL record for doubleheaders in a season at 44.

Let’s Play …. Three?

While, there have been three occasions in which major-league teams have played three games in a single day, research by Society for American Baseball Research (SABR) member Bill Nowlin indicates there has been only one “true”  (read single-admission) triple header.  That came on October 2, 1920, with the 80-69 Reds facing the 77-73 Pirates at Pittsburgh’s Forbes Field.  With four contests left in the season, the previous two Pirates-Reds games cancelled due to weather and third place (and a World Series’ share) at stake, the teams faced off in a one-day, three-game  series starting at noon. Long story short, the Reds won the first two games (13-4 and 7-3), while the Pirates took the final game 6-0 (called – darkness – after six innings).

Only five players played in all three games (making them all, of course, single-day MLB record holders). They were the Reds’ Morrie Rath (2B-RF) and Pat Duncan (LF) and the Pirates’ Cotton Tierney (2B-SS), Clyde Barnhart (3B) and Fred Nicholson (PH-RF-LF).

The two other instances of three-games-in-a-day matchups have occurred – on September 1, 1890 (Brooklyn Bridegrooms versus Pittsburgh Innocents) and September 7, 1896 (Baltimore Orioles versus Louisville Colonels). In both of those, the first contest was a separate-admission morning game, with a second admission required for the afternoon doubleheader.

Putting Up Crooked Numbers

The record for runs scored in a doubleheader – both teams – is 54.  It has been done twice.  On August 21, 1894,the National League Boston Beaneaters swept a doubleheader from the Cincinnati Reds by score of 18-3 and 25-8. Then, on Independence Day in 1939, there were lots of fireworks on the field in Philadelphia, as the Red Sox topped the Athletics 17-7 and 18-12.

Well, That Didn’t Take Long

The fewest runs scored in a doubleheader? It may surprise you (because it’s not two.)   The answer is one.  On September 4, 1902, the Pittsburgh Pirates and Boston Beaneaters matched up in a doubleheader in Boston. Game One went to Boston 1-0 (in one hour and twenty minutes). Game Two ended in a nine-inning 0-0 tie (one hour and 30 minutes).

A Hero’s Performance

Ted Williams, the fighter pilot, was a true hero – earning the Presidential Medal of Freedom and  three Air Medals, among other decorations. Teddy Ballgame demonstrated a different kind of bravery in a doubleheader on September 28, 1941.  It was the final day of the season and William was hitting .3995 – which, when rounded, would make him the first Al or NL .400 hitter since 1930. Offered the chance to sit it out and sit on the .400 average, Williams declined. Williams went four-for five in Game One of the twin bill, helping Boston top the Athletics in Philadelphia 12-11, (He had three singles, a home run, two runs scored and two RBI. ) He now had a .404 average and another chance to rest on his laurels, Instead, he went out and produce  a two-for-three second games (in a 7-1 Red Sox loss) finishing the season at .406.

A Good Day’s Work

On September 26, 1908, Cubs’ righty Ed Reulbach started both games of a doubleheader against Brooklyn (Superbas).  He went the distance in both contests, giving up just nine hits – and no runs –  over the 18 innings.  Reulbach is the only MLB pitcher ever to record two complete-game shutouts in a single day. The final scores were 3-0 and 6-0.

Another Good Day’s Work – and Baseball Roundtable’s Favorite “Coincidence”

On May 2, 1954, Cardinals’ right fielder Stan Musial hit five home runs in doubleheader (versus the Giants in Saint Louis). Sitting in the stands that day was eight-year-old Nate Colbert who – On August 1, 1972 – would become just the second player ever to hit five home runs in a twin bill. Colbert was playing first base for the Padres, who were taking on the Braves in Atlanta. In his five-homer twin bill, Colbert set the record for RBI in a doubleheader (13). The Cardinals, by the way, split their doubleheader on Musial’s big day, beating the Giants 10-6 in Game One and losing the second game 9-7. The Padres swept the Braves (9-0 and 11-7) on Colbert’s record-tying day.

I Call Trade-Zees

On May 30, 1922, the Cardinals and Cubs matched up in a Memorial Day doubleheader in Chicago. The Cubs took Game One by a 4-1 score – with one of the four tallies driven in by RF Max Flack. Playing CF for the Cardinals was Cliff Heathcote, who went zero-for-three.  In Game Two,  Heathcote and Flack were both starting in the garden – but for the teams they had opposed in Game One.  Traded between games, Flack started in RF, leading off, for the  Cardinals, while Heathcote started in RF, batting fifth for the Cubs. The Cubs won this one 3-1, with Heathcote going two-for-four.  Flack went one-for-four for his new team.

Don’t Worry – I Got This

In August of 1903, the Giants’ Joe McGinnity started  both games of a doubleheader three times – August 1, Augusts 8 and August 31.  In those starts, he picked up six complete-game victories – giving up a total of 10 runs in the six contests. By the way, the Giants played 11 doubleheaders that month. Surprisingly, on the August days when he pitched only one game (another six starts), McGinnity went 1-5 and gave up 28 runs. For the season, he was 31-20, 2.43, with 44 complete games in 48 starts.  No wonder his nickname was “Iron Joe.”

Way Too Much Overtime

On May 31, 1964, Mets fans faced a long day of suffering.  Not only did the New Yorkers lose both ends of a doubleheader to the San Francisco Giants – it took them a doubleheader-record 32 innings (9 hours and 52 minutes) to do it. The Giants won game one 5-3 in a brisk 2:29.  The second game, however, went 23 innings (7:23), with the Giants winning 8-6.   This is the longest doubleheader by innings and the longest in time –  without a weather delay.

On July 2, 1993, the Padres and Phillies split a twin bill in Philadelphia that kept the fans (who stayed on) in the park for more than 12 hours. Consider the patience needed.  The first game was delayed one hour and ten minutes before the first pitch; another one hour and 56 minutes in the fourth inning; and two hours and 48 minutes in the sixth. The teams began play at 4:35 p.m. on Friday, July 2 and wrapped up at 4:40 a.m. Saturday – a doubleheader record 12 hours and five minutes.

Nine-for-Nine

Nine players have a record collected nine hits in a doubleheader. Here’s the list.

Lee Thomas, Angels …. September 5, 1961

Lee Thomas collected his nine hits as the Angels were swept  in a doubleheader by the Athletics  (in Kansas City) – losing Game One by 7-3 score and Game Two 13-12.  Thomas (playing right field  and batting second) went five-for-five in the first game (four singles and a double) without scoring or driving in a run. He had half of the Angels’ ten hits. Thomas was more productive in Game Two, going  four-for-six – with three home runs, three runs scored and eight RBI. He took the field in right field batting second in that contest. The Athletics won the game on a two-run walk-off home runs by CF Bobby Del Greco with two outs in the bottom of the ninth.

Thomas played eight MLB seasons (1961-68 … Yankees, Angels, Red Sox, Braves, Cubs, Astros). He went .255-106-428 in 1,027 games., His best season was as an Angel in 1962, when he was an AL All Star and hit .290-26-104 (all career highs).

Pete Runnels, Red Sox …. August 30, 1960

Pete Runnels was on his way to the 1960 AL batting championship when he had his nine-hit doubleheader on August 30 – as the Red Sox swept the Tigers (in Boston), winning the first game 5-4 (15  innings) and taking  the night cap 3-2 (10 innings). Runnels, started Game One batting seventh and playing 2B (he later moved to first base). He went six-for-seven, with one double, one RBI and one run scored. Three of his hits came in extra innings and his RBI double with one out in the fifteenth frame was a walk-off game winner. Runnels was at 2B batting sixth in Game Two and went 3-4 with two doubles and one run scored.

Runnels finished the 1960 season with a .320-2-35 stat line (80 runs scored) – winning the first of two career batting titles. (He won again with a .326 average for the Red Sox in 1962), The three-time All Star played 14 MLB seasons (1951-64), hitting .291-49-630 in 1,799 games.

Roundtable Extra – More #OneThingLeadsToAnother”

I interrupt this list to once again show how, when Baseball Roundtable begins looking at one thing, it often lead to another. As I was looking at players who had a record nine hits in a doubleheader, I (of course) came across the record for hits in a nine-inning game (seven) shared by Wilbert Robinson (who is on this list) and Rennie Stennett.  I also came across another nine-hit record. On July, 10, 1932, as the Athletics topped the Indians in 18 innings, Indians’ SS Johnny Burnett set a record with nine hits in a game (of any length). Ironically, the 18 innings played match up with the innings in most doubleheaders. Burnett went 9-for-11, with two doubles, four runs scored and two RBI. 

Burnett, a utility player, played nine MLB seasons (1927-35) – eight for the Indians and one for the Browns. His final stat line was .284-9-213 in 588 games. He played 100 or more games at 2B, SS and 3B; but only twice topped 100 games in a season. 

George Case, Senators … July 4, 1940

George Case had a big day for the Senators on Independence Day 1940 – lashing out nine hits as the Senators swept a doubleheader from the Philadelphia Athletics 5-1 and 9-5. Case went four-for-five in Game One, with a triple and a run scored. He did even better in Game Two – five-for-five, with a double, two runs scored  and two RBI. Surprisingly, despite all those times on base, Case (a CF known for his speed) did not steal a  base in the twin bill. (He would lead the AL with 35 steals that seasons, one of six stolen base titles he would earn.)

Case was a three-time All Star who played 11 MLB seasons (1937-47 … all but his 1946 season with the Senators). He hit .282-21-377 (785 runs scored and 349 steals) in 1,226 games.

Bill Terry, Giants…. June 18, 1929

Bill Terry’s Giants managed to lose both ends of a double header to the Robins (Dodgers) in Brooklyn – despite a nine-for-ten day by Terry. The Giants lost Game One 8-7 and dropped Game Two 7-6. In Game One, Terry – playing first base and batting fifth – went five-for-five, with a home run, run scored and three RBI. In Game Two, he went four-for-five (all singles) with two RBI.

Hall of Famer Terry should be no surprise on this list. He was a career .341 hitter over 14 MLB seasons (1923-36), all with the Giants. He had 154 career home runs, 1,078 RBI and 1,120 runs scored. He hit over .300 in 11 seasons, hitting .350 or better four times (a high of .401 when he won the 1930 batting title).

Freddie Lindstrom, Giants …  June 25, 1928

Freddie Lindstrom’s nine-hit twin bill came as the Giants topped the Athletics 12-4 and 8-2 in Philadelphia. Lindstrom, batting third and playing third base, went five-for-six (all singles), with three runs scored and three RBI in Game One and four-for-five (three singles and a double), with one run and one RBI in Game Two.

A Hall of Famer, Lindstrom hit .358 and led the league with 231 hits in 1928. He played in 13 MLB seasons (1924-36 … Giants, Pirates, Cubs, Dodgers) and hit .311-103-779 in 1,438 games.

Ray Morehart, White Sox … August 31, 1926

Ray Morehart may be the least known player on this list. He picked up nine hits as his White Sox played  a doubleheader with the Tigers (in Detroit), winning Game One 19-2 and losing Game Two 7-6. Morehart, batting second and playing second base, went five-for-six with a double, a stolen base, a hit-by-pitch , two runs scored and six RBI in Game One. He came back to go four-for-four, with a double, a walk, one run and two RBI in Game Two.  So, for the day, he reached bases 11 times in 12 plate appearances. Why is he a surprise?  Morehart played in just three MLB seasons (1924, 1926-27 … White Sox, Yankees), going .269-1-47 in-177 games.  His claim to fame may be playing in 73 games for the 1927 Yankees (considered by many to be the best team of all time). Then, of course, there was the 1926 doubleheader.

Joe Kelly, Baltimore Orioles … September 3, 1894

Joe  Kelly celebrated Labor Day 1894 with nine hits in a doubleheader – as his  Baltimore Orioles topped the Cleveland Spiders 13-2 and 16-3. In the second game of that twin bill, he laced four doubles off none other than Cy Young. In that 1894 season, the 22-year-old outfielder hit  .393-6-11, with 46 steals. Kelly, a Hall of Famer, played 17 MLB seasons (1891-1906, 1908) and hit .317-65-1,194.

Wilbert Robinson, Baltimore Orioles… June 10, 1892

Wilbert Robinson collected nine hits in a doubleheader, as his Orioles topped the St. Louis Browns 25-4 and 9-3.  While Robinson still shares the record for hits in a doubleheader, he is better known for a record he set in the first game of the twin bill – seven hits in a nine-inning game. That record has been matched just once in MLB history, by the Pirates’ Rennie Stennett in a 22-0 Pittsburgh win over the Cubs (in Chicago) on September 16, 1975. Robinson also drove in a then-record 11 runs in the first game of his nine-hit doubleheader – a record that stood until September 16, 1924, when Jim Bottomley drove in 12 runs in a Cardinals’ 17-3 win over the Brooklyn Robins in Brooklyn. (Another Cardinal, Mark Whiten, matched Bottomley’s 12 RBI on September 7, 1993, in a 15-2 Cards win over the Reds in Cincinnati.)

Robinson, who went on to become a Hall of Fame Manger, played 17 MLB seasons (1886-1902), hitting .273-18-722 in 1,371 games.

Fred Carroll, Pittsburgh Alleghenies … July 5, 1886

Fred Carroll collected nine hits in a doubleheader as his Alleghenies swept the Baltimore Orioles 15-1 and 13-2 in Pittsburgh. The 21-year-old Carroll hit .288-5-64 for the American Association (major league ) that season. He enjoyed an eight season MLB career – going .284-26-366 in 754 games (C-OF-1B).

Primary Resources:  Baseball-Reference.com; Baseball-Almanac.com; MLB.com; Joe Kelly, SABR Biography by Jimmy Keenan; Seven Hits in Seven Tries for Wilbert Robinson, SABR, by Jimmy Keenan; This Week in Pittsburgh Sports History, July 5, 2017, by Charles Dietch; The Last Triple Header, by A.D. Suehsdorf, SABR Research Journals Archive.

BASEBALL ROUNDTABLE

BLOGGING BASEBALL SINCE 2012


BASEBALL ROUNDTABLE ON THE TOP 100 BASEBALL BLOG LIST

100Baseball Roundtable is on the Feedspot list of the Top 100 Baseball Blogs.  To see the full list, click here.

I tweet (on X) baseball @DavidBaseballRT

Follow Baseball Roundtable’s Facebook Page here.  More baseball commentary; blog post notifications.

Member: Society for American Baseball Research (SABR); The Baseball Reliquary; The Negro Leagues Baseball Museum.


Baseball Roundtable August Wrap – An Ultimate Slam, A Triple Play, A “Maddux” and More

It’s September 1, and regular readers of this blog know it’s time for Baseball Roundtable’s look at the standings, stats and stories that captured The Roundtable’s attention over the previous month, as well Baseball Roundtable’s Players and Pitchers of the Month (August) and the ongoing Trot Index.

Here’s just a teaser of the things that caught Baseball Roundtable’s eye in August:

  • The Nationals got their first win from a starting pitcher since July 6;
  • The Twins turned their second triple play of the season;
  • The Rangers’ Adolis Garcia had a 21-game hitting streak;
  • Mariners’ rookie pitcher George Kirby started a game and didn’t throw a called ball until his 25th pitch;
  • The Yankees’ Josh Donaldson hit an”Ultimate Grand Slam;”
  • The Angels’ Pablo Sandoval channeled “The Professor” and threw a “Maddux;”
  • Shohei Ohtani became the first MLB player to hit at least 30 home runs and collect at least ten pitching victories in the same season;
  • 42-year-old Albert Pujols put up a .361-8-17 stat line in 23 games;
  • The Phillies had a game in which they put up 18 runs on 22 hits – without a single home run;
  • The Cardinals hit the most home runs in August and gave up the fewest round trippers;
  • The Angels, who hit the AL’s fewest home runs in July, led the AL in August round trippers.

You’ll find more on all this – and more – as you read through this post. Not into stats? Skip ahead to the Highlights Section. 

That Makes Sense

The Dodgers Guardians and Rays all put up earned run averages under 3.00 for August – and went a combined 56-26.  The Rockies, Red Sox and Nationals all put up earned run averages 0f 5.00+ – and went 31-52 for the month. 

_______________________________________

—-August Players and Pitchers of the Month—-

National League

Player of the Month – (Tie) Paul Goldschmidt, 1B, Cardinals & Nolan Arenado, 3B, Cardinals. Let’s look at these two Redbirds.

It’s no wonder the Cardinals went 22-7 in August (and moved to the top of the NL Central). The team boasted three solid candidates for NL Player of the Month:  Nolan Arenado; Paul Goldschmidt; and Albert Pujols.  Baseball Roundtable thinks it’s appropriate that Arenado and Goldschmidt share the recognition. Let’s look at the August offensive contributions of this this pair of corner infielders, who both also have multiple Gold Gloves on their resumes.

  • Arenado had the edge in August average – .364 to Goldschmidt’s .343. They were, respectively, second and fifth in the NL among players with at least 60 August at bats. (Pujols, by the way, was third at .361)
  • Goldschmidt and Arenado each hit nine August home runs – tying for the major-league lead. (Pujols had eight.)
  • Arenado led MLB with 29 August RBI, Goldschmidt was third with 27.
  • Goldschmidt’s 25 August runs were second in the NL; Arenado scored 19 times.
  • Arenado’s 39 hits were third in the NL, while Goldschmidt’s 35 August safeties were seventh
  • Goldschmidt’s .448 on-base percentage topped NL hitters with at least 60 August at bats. Arenado was at .410. On the other hand, Arenado’s slugging percentage for August was .729 (second only to Pujols’ .803 among NL players with at least 60 August at bats), while Goldschmidt was fourth at .667.

Goldschmidt had nine multi-hit games (five three-hit contests) and eight multi-RBI games (including a five-RBI contest in an 8-3 win over the Cubs on August 25. In a four-game stretch from August 17-20, he went 11 -for-17 (plus two walks), with two home runs and eight RBI.

Arenado had ten multi-hit games. He had eight multi-RBI contests – and only once went two consecutive games without a hit.

Honorable Mentions: The Cardinals’ 1B/DH Albert Pujols – at age 42 – had a tremendous month (as he climbed up the All-Time offensive charts. He put up a .361-8-17 line in 23 games. Mets’ 2B Jeff McNeil also deserves mention. His .385 average was the highest among NL players with at least 60 August at bats (he had 109) and  his 42 hits tied for the MLB August lead. McNeil had two home runs, 11 RBI and 14 runs scored for the month,  Finally, a shout out to Mookie Betts of the Dodgers for his .330-9-17 month, which include an MLB-best 30 runs scored and five steals in five attempts.

Pitcher of the month – Zac Gallen, RHP Phillies

Zac Gallen went 5-0 (the only National Leaguer with five August wins), with a minuscule 0.68 earned run average in six starts (the lowest ERA among MLB pitchers with at least 25 August innings). His 40  innings pitched were second in MLB and his 44 strikeouts third . In four of his five wins, he went at least seven innings without surrendering a run. He put up a 0.75 WHIP and held hitters to a .154 average.

Zac Gallen ended August with an active steak of 34 1/3 consecutive scoreless innings.


Honorable Mentions: The Mets’ Jacob deGrom, who was also in the running, led MLB in August strikeouts with 55 (in 36 1/3 innings) putting up a 4-1, 1.98 record.  I also considered Tony Gonsolin, RHP, Dodgers. He put up a 4-0, 0.76 line in four August starts.The fact that he threw just 23 2/3 innings (20 strikeouts) was the difference maker.   And, I looked at  Dodgers’ southpaw Julio Urias, who went 4-1, 0.90 in five starts.

Baseball Roundtable Extra – August’s Mr. No-Decision

Cubs’ southpaw Justine Steele put up a nifty 0.96 ERA in five August starts – with 39 strikeouts (eight walks) in 28 innings. And, while the Cubs eventually won four of those five games, Steele did not pick up a single win. (All five were no-decisions).  

____________________________________

American League

Player of the Month – Alex Bregman, 3B, Astros

Photo: D. Benjamin Miller, Public domain, via Wikimedia Commons

Alex Bregman hit .362 for the month (fourth in the AL among players with at least 60 at bats) with seven homers (tied for fourth in the AL) and 22 RBI (tied for third.) He also scored a league-leading 27 August runs and drew 17 walks to just ten whiffs (giving him a .452 on-base percentage (third among AL players with 60 or more August at bats).  Bergman’s month included ten multi-hit games – including a four-hit, two-home run, six-RBI game (against the White Sox) on August 21.

Honorable Mentions: Rangers’ 1B Nathaniel Lowe’s .389 average led all MLB hitters (with at least 60 August at bats), his seven August home runs tied for fourth in the AL, and his 21 RBI were seventh. He led the league with 42 August hits. For Baseball Roundtable, the difference (that gave Bregman the edge) was that Lowe walked  ten times times and fanned 21; versus Bregman’s 17 walks and ten whiffs.  (Bregman also had the edge in both on-base percentage and slugging percentage.)


Pitcher of the Month – Framber Valdez, LHP, Astros

Framber Valdez was just the only AL pitcher to win five games this August (and one of just two in MLB). Valdez went 5-0 2.04 in five starts. He went at least seven innings in four of his five starts and fanned 33 batters in 35 1/3 innings. Valdez ended August with a 14-4, 2.63 record on the season.

Honorable Mentions: The Guardians’  Shane Bieber went 3-1, 1.62 in five starts, fanning 35 and walking just four in 33 1/3 innings. He put up a 0.90 WHIP, fifth among AL pitches with at least 25 August innings. He pitched  at least seven innings in three of his five starts and, in his one loss, he gave up just one earned run in 6 1/3 frames.  Drew Rasmussen of the Rays had the best August WHIP (0.67) among AL pitchers with at least 25 innings pitched, while going 3-1, 1.59, walking just four and fanning 29 in 28 1/3 innings.

Baseball Roundtable Extra – Life Is Just Not Fair

The White Sox’ Lucas Giolito went 4-2 in six August starts – despite a 5.68 earned run average.  The Yankees’ Gerrit Cole went 1-4, despite a 3.20 ERA. 

_____________________________________________

Surprise Player of the Month – Mariners RHP George Kirby

Mariners’ 24-years-old rookie righty George Kirby – who made his MLB debut in May – came into August with an MLB career record of  2-3, 3.56 (but with just 11 walks, versus 73 strikeouts in 73 1/3 innings pitched).  In August, he turned it up a notch. In four starts, he went 4-0, 2.15, with just three walks and 34 strikeouts in 29 1/3 innings. (You’ll find more on this 2022 surprise in the Highlights section.)


______________________________________________________

TROT INDEX … A REGULAR BBRT FEATURE

Through August, 34.4 percent of the MLB season’s 146,364 plate appearances ended in a trot (back to the dugout, around the bases, to first base). We’re talking about strikeouts, home runs, walks, hit by pitch and catcher’s interference – all outcomes that are, basically, devoid of action on the base paths or in the field. Here’s the breakout: strikeouts (22.3%); walks (8.2%); home runs (2.8%); HBP (1.1%); catcher’s interference (less than 1%). Personally, I’d like more action in the field of play.

The 34.4 percent figure is down slightly from 2021’s full season 36.3 percent.  2020’s 37.3 percent;  2019’s 36.2 percent and 2018’s 34.8 percent.  By further comparison, in 1990, the Trot Index was 26.1 percent.  

_________________________________________________

The Dodgers went 21-7 and  were hitting on all cylinders.  Their 2.29 earned run average for the month was easily the best in MLB and they were second in runs scored (to the Cardinals).  A few tidbits:

  • They didn’t loses their first August game until the 14th;
  • In August,  they held opponents to two or fewer runs 13 times and scored eight or more runs 12 times;
  • They had eight players with 12 or more August RBI and  six with 13 or more runs scored;
  • Key starters Julio Urias and Tony Gonsolin went a combined  8-1, 0.83.

Now, we hear a lot about the Dodgers’ (22-game winners in August) potent lineup (Mookie Betts, Freddie Freeman, Trea Turner and more) and their lights-out starting rotation.  But what caught Baseball Roundtable’s attention was the work of a group of lessor-known (except for one) relievers, who each appeared in a dozen August games.  Together they pitched 46 innings and went a combined 3-0, with two saves and a 0.78 ERA, Their names and August records? Evan Phillips (0-0, 0.00 ERA and one save in 11 2/3 innings); Alex Vesia (0-0, 0.00 in 11 innings); Chris Martin (3-0, one save, 1.59 in 11 1/3 innings); and the better-known David Price (2-0, 1.50 in 12 innings.)

The Cardinals also won 22 August games. Despite the NL’s fifth-best earned run average, their hitting is what stood out. They led MLB in August  runs scored, home runs, average, RBI, total bases, on-base percentage and slugging percentage. The Cardinals had five players with at least 50 at bats hit over .335 in August; three players among the top four NL August home run hitters; and two of the top three in RBI (three Cardinals drove in 20 or more runs in August). For more on the Cardinals’ offense, check the August NL Players of the Month section.  Jordan M0ntgomery may have been the Redbirds’ mound surprise of the month – going 4-0, 1.76 in five starts. Closer Ryan Helsley picked up four wins and three saves (2.45 ERA in nine appearances). The other 14 wins were split among nine pitchers.

——Team  Statistical Leaders for August  2022 ———-

RUNS SCORED

National League – Cardinals (173); Dodgers (165); Braves (160)

American League – Astros (132); Rays (130);  Rangers (124); Mariners (124)

The fewest August  runs were scored by the Marlins – 62. The A’s tallied the fewest runs in the AL at 89.

AVERAGE

National League – Cardinals (.281); Dodgers (.273); Phillies (.273)

American League –White Sox (.270); Red Sox (.268); Astros (.265);

The lowest team average for August  belonged to the Marlins   at .196.

Notably, the top seven MLB teams in August run production were from the National League. 

HOME RUNS

National League – Cardinals (51); Brewers (41); Dodgers (40)

American League –  Angels (40); Mariners (39); Rangers (33)

Bonus Stats

  • The Angels had the fewest home runs for July  at 15 – then led the AL in long balls in August with 40.
  • The fewest August home runs belonged to the Tigers, just 13.  
  • The Cardinals led MLB in August slugging percentage at .503 – the only team over .500. The Astros  led the AL at .411. 

STOLEN BASES

National League – Marlins (25); Phillies (24); Diamondbacks (22)

American League – Royals (23); Guardians (21); Rangers (21)

The White Sox  stole the fewest sacks in August  – two (in six attempts).

WALKS DRAWN

National League –   Padres (120); Cardinals (109); Brewers (106)

American League – Twins (96);  Mariners (95); Rays (94)

The Cardinals  led MLB  in on-base percentage for August at .361. The White Sox led the AL at .334.

BATTER’S STRIKEOUTS

National League – Cubs (263); Reds (261); Braves (257)

American League – Angels (279); Tigers (270); Red Sox (252)

Bonus Stats

  • The Cardinals  led MLB in total bases in August with 504. By contrast, the Marlins were 30th, with 287 total bases for the month.
  • The Red Sox grounded into an MLB-high 33 double plays in August; the Marlins hit into an MLB-low 11.
  • Five of the thirty teams did not put down a single successful sacrifice bunt in August. The Diamondbacks led in successful sacrifice bunts with ten.

Earned Run Average

National League – Dodgers (2.29); Braves (3.27); Mets (3.41)

American League – Guardians (2.80); Rays (2.85); Astros (3.00)

Three  teams had August ERAs of 5.00  or higher– Rockies (5.70); Red Sox (5.36); Nationals (5.00). 

STRIKEOUTS

National League – Mets (275); Braves (262): Dodgers (254)

American League – Twins (265); Astros (262); Guardians (256)

Bonus Stats

  • The Astros averaged an MLB-best 9.47 strikeouts per nine innings in August.  The Braves had the highest ratio in the AL at 9.42.
  • The Rays walked a stringiest 1.96 batters per nine frames in August. The Padres were best in the NL at 2.27.
  • The Pirates walked an MLB-highest 3.99 per nine innings for the month.
  • The Rays has MLB’s best strikeouts-to-walks ratio in August at 4.70. The Padres led the NL at 3.94.

SAVES

National League – Cubs (10); Phillies (9); three with 8

American League – White Sox (10); Astros (10); Orioles (9); Red Sox (9)

The Pirates recorded just three saves in seven August opportunities. The Cubs,  despite leading MLB in August saves, also flubbed the most save opportunities (10 saves in 20 save opportunities). 

WALKS AND HITS PER INNING PITCHED (WHIP)

National League – Dodgers (0.94); Braves (1.18); Mets (1.20);  Brewers (1.20)

American League –  Guardians (0.99); Rays (1.06); Yankees (1.10)

Bonus Stats

  • The Dodgers held opposing batters to an MLB-lowest .183 average (the only team to hold opposing hitters under .200)
  • The Nationals  and Cubs gave up an MLB-high 45 home runs in August; the Cardinals gave up an MLB-low 19 dingers. (Notably, the Cardinals hit the most August homers at 51.)
  • There were only nine complete games pitched in August: three by the Phillies (two for Aaron Nola, Noah Syndergaard) and one each by the White Sox (Johnny Cueto), Angels (Patrick Sandoval), Marlins (Sandy Alcantara), Cardinals (Jordan Montgomery) and Nationals (Paolo Espino).  
  • The Marlins staff shutout their opponents an MLB-high five times in August.

______________________________________

—-August 2022 Highlights—-

Lucky Seven? Maybe Not So Much.

On August 4, the Angels became just the sixth team to homer seven times in a loss – as they hammered seven solo home runs in an 8-7 loss to the A’s.  It was also reported that it was the first time (at least since 1900) that a team hit seven solo home runs – without scoring any other runs in the game. The dingers belonged to:

  • First Inning – DH Shohei Ohtani
  • Second Inning – C Kurt Suzuki
  • Third Inning – RF Taylor Ward
  • Fourth Inning – LF Jo Adell
  • Sixth Inning – 1B Jared Walsh
  • Seventh Inning – Ohtani
  • Ninth Inning – CF Mickey Moniak

More of the Shohei Show

Photo: hj_west from USA, CC BY-SA 2.0 <https://creativecommons.org/licenses/by-sa/2.0>, via Wikimedia Commons

As usual, the Baseball Roundtable monthly update includes a tidbit about Shohei Ohtani – the Angels’ two-way star. In the Angels’ August 9 game against the A’s in Oakland, Ohtani started on the mound and in the lineup (batting second) at designated hitter.

Ohtani pitched six scoreless innings (four hits, three walks, five strikeouts) for his tenth win of the season.  He also went two-for-three, with his 25th home run.  That pitching victory made Ohtani just the fourth  MLB player to hit at least ten home runs and record at least ten pitching victories in the same season. The only others?  Babe Ruth, for the Red Sox,  back in 1918  (13-7, with 11 long balls)  and two Negro League stars – Ed Riles (11-6, with 11 home runs) for the 1927 Detroit Stars and Bullet Rogan (14-8, with 15 home runs) for the Kansas City Monarchs in 1922.  Ohtani ended August at 11-8, 2.67, with 176 strikeouts in 128 innings on the mound and .260-30-82 on 469 at bats.

Shohei Ohtani hit his 30th home run of the 2022 season in an August 31 Angels’ 3-2 win over the Yankees. Coupled with his 11  pitching wins (thus far this season) that made him the first MLB player ever to earn at least ten pitching victories and hit at least 30 home runs in a season, 

Field of Dreams

On August 11, the Cubs and Reds played the second annual MLB at Field of Dreams Game in the MLB-built ballpark, in a cornfield outside of Dyersville, Iowa.  The Cubs prevailed 4-2, but this one (although it counted) was more about nostalgia and atmosphere than the outcome. The highlights – other than the locale – were probably Ken Griffey, Sr. and Ken Griffey Jr. walking out of the cornfield to “have a catch” and  the pregame ceremonies that included Hall of Famers Billy Williams, Andre Dawson, Fergie Jenkins, Ryne Sandberg, Lee Smith, Johnny Bench, Ken Griffey, Jr. and Barry Larkin.

Nelson Cruz Putting Up a Nice Round Number

On August 13, as the Nationals  topped the Padres 4-3 in Washington, 42-year-old Nelson Cruz went two-for-three, with a walk and a run scored.  His second hit of the night, an eighth-inning single, marked his 2,000th MLB safety.

Pete Alonso also Putting Up Some Round Numbers

Photo by slgckgc

On August 19, as the Mets topped the Philllies 7-2 in Philadelphia, Pete Alonso drove in the first run of the game on a fielder’s choice in the first inning– notching his 100th RBI of the season. Then, in his next at bat (third inning), he added another round number hitting a two run home run for his 30th round tripper of the year. The 2019 home run leader as a rookie (with a rookie-record 53 home runs) finished August with a .271-31-105 line on the season.


So Close and Yet …

On August 14, the Drew Rasmussen pitched a gem – taking a perfect game into the ninth inning in just his 30th major-league start (67th MLB appearance in three seasons).  Rasmussen reached the ninth inning (against the Orioles in Tampa) having retired the first  24 Orioles to come to the plate on a total of 79 pitches (56 strikes). Six Orioles had gone down on strikes.

In the top of the eighth, Rasmussen retired the Orioles on two ground outs and a strikeout, but needed 16 pitches to record the three outs (the most pitches he had thrown in any inning of the game).  Over the first seven innings, he needed more than ten pitches to the retire the Birds in just one frame (12 in the second). Despite striking out, Orioles’ 2B Rougned Odor made Rasmussen work – with an eight-pitch at bat in the eighth (the longest Orioles’ at bat of the contest).

Orioles’ SS Jorge Mateo, who came into the game hitting .231, put an end t0 the suspense by hitting Rasmussen’s first pitch in the ninth for a double to left. Rasmussen, still working toward his first MLB complete game and first MLB shutout, then got PH Terrin Vavra on a ground out (second-to-first), with Mateo moving to third. Next up was CF Brett Phillips. With the count 1-2, Rasmussen tossed a wild pitch for ball two, with Mateo scoring from third.  Two pitches later, Phillips swung and missed (for strike three) on another wild pitch, but gained first base. That ended Rasmussen’s day.  After eight perfect frames, no perfecto, no no-hitter, no shutout, no complete game – but his seventh win (four losses) on the season. For more on perfect games lost late (with two outs in the ninth or later), click here.

Rasmussen, by the way, went 3-1, 1.57 in six August starts – running his 2022 record to 9-4, 2.70. It looks like a solid future ahead.

Baseball Roundtable Extra – Space Cowboys Launch a Big Inning

On August 19, the Triple-A Sugar Land Space Cowboys faced off against the Oklahoma City Dodgers. The game was tied 4-4 in the bottom of the sixth  inning, when the Space Cowboys scored 17 runs on  ten hits, nine walks and one hit-by-pitch.  Eight of the nine Space Cowboy hitters reached base two or more times in the frame. The inning lasted just two minutes shy of an hour. 

Note: The MLB record for runs scored in an inning is 18, set by the Chicago White Stockings in the seventh inning of 26-6 win  against the Detroit Wolverines on September 6, 1883. In the seventh inning of that game, the White Stockings launched 18 hits and had three players get an MLB-record three hits in an inning –  Tom Burns (two doubles and a home run); Fred Pfeffer (a double and two singles); and Ned Williamson (a double and two singles). For more on players with three-hit innings, click here.

Patrick Sandoval Channels the Master

On August 19, Angels’ southpaw Patrick Sandoval channeled Professor Greg Maddux – tossing what MLB has come to term “A Maddux” – a complete-game shutout in less than 100 pitches. It was Sandoval’s first career complete-game (four seasons, 50 starts).   After the game, Sandoval joked that  “Usually, I’m like through four innings on 97.” In the 1-0 win, over the Tigers in Detroit, Sandoval gave up just four hits and no walks, while fanning nine. Of his 97 pitches, 73 were strikes. Notably, nine of those pitches came in a single at bat – Tigers’ CF Riley Greene grounded out  second-to-first to end a nine-pitch at bat for then final out in the sixth inning. It as the only three-ball count in Sandoval’s outing. Sandoval closed August with  5-9, 3.02 record on the season.

Donaldson Posts Ultimate Grand Slam

On August 17, Yankees’ DH Josh Donaldson joined the ranks of the MLB players who have launched an “Ultimate Grand Slam” – a Grand Slam, Walk-Off Home Run with their team down by three runs. Note: This list may change as the Negro League records from 1920-48 are fully documented and incorporated into the MLB records.

Donaldson’s blast came in the bottom of the  tenth inning, with his Yankees trailing the division-rival Rays 7-4. The Rays had plated three runs in the top of the inning (placed runner, two walks and a double) off New York closer Aroldis Chapman to set up the need for the four-run shot.  The Yankees opened the bottom of the inning with RF Aaron Judge placed at second base and Jalen Beeks on the mound for the Rays.   New York 2B Gleyber Torres greeted Beeks (on an 0-1 pitch) with a single to right, with Judge moving to third. 1B Anthony Rizzo then walked on four pitches, loading the sacks  for Donaldson, who hit a Grand Slam, Walk-off home run down the right field line.

Donaldson is no surprise on this list.  He’s a long-standing legitimate power threat.  The dinger was the four-time All Star’s 12th home run of the season and 263rd regular season long ball of his career. It was also his seventh career Grand slam and eighth career walk-off home run.

Below is a list of the AL/NL players who have poked an Ultimate Grand Slam since 1900. There are some expected names (like Donaldson, Travis Hafner, Adam Dunn, Babe Ruth and Roberto Clemente), and some surprises (like David Bote, Brian Bogusevic and Danny Kravitz). Note: Baseball-Almanac.c0m also credits Roger Connor of the 1881 Troy Trojans with a UGS.

Prince Albert Passes Stan the Man

Photo by Dirk DBQ

Albert Pujols, in  what he has announced will be his final season as a player, proved he can still handle the dog days of August– putting up a .361-8-17 line in 23 August  games for the Cardinals. During August, Pujols passed Stan Musial for second all-time in total bases. As the month ended, he stood among the top-five all time in games played (fifth); total bases (second); doubles (fifth); home runs (fifth); RBI (third); extra-base hits (third), and intentional walks (second). His career stat line was 296-694-2,191 at the close of August.

Another Notch in Pujols’ Belt

On August 29, in the third inning of a Cardinals 13-4 win over the Reds (in Cincinatti), Redbirds’ 1B Albert Pujols hit his 15th home run of the season – a two-run shot off he Reds’ Ross Detwiler.  In another of those #InBaseballWeCountEverything moments, it marked the MLB-record 450th pitcher Pujols has taken deep in his 22-season MLB career. 

Not a Path to the Majors You Could Bank On

In 2019, southpaw Nate Fisher had his best college season (7-3, 3.27) – in his senior year with the University of Nebraska. Surely, the scouts would come calling.  Fisher, however, went undrafted and signed a minor-league deal with the Mariners. In 2019, he went 0-2, 4.10 in 12 games (six starts) at Low-A.  Then, when COVID resulted in cancellation of the 2020 season and Fisher was released by the Mariners in May, the 24-year-old took a position as a commercial lending analyst at a bank in Omaha. But his baseball dream was not  yet over.

In June of 2021, he signed another minor-league deal with the Mariners and put up a 3-0, 2.89 line  in 21 games –  working his way from rookie ball to High-A to Double-A to Triple-A. .   He became a free agent that November  and signed another minor-league deal (Mets) that same month.  He went 1-3, 3.38 at Double- and Triple-A before an August call up to the Mets – who were facing an injury-depleted pitching staff and a heavy schedule.

On August 21, Fisher came on in the fifth inning of a game in which the Mets trailed the Phillies 7-4. He  pitched three scoreless (one hit, two walks, one whiff) innings and left with the game tied 7-7. (The Mets eventually own 10-9). Just as a stint in banking interrupted his baseball career, his MLB debut was also interrupted 45-minute rain delay after his first inning of work.  What lies ahead for the pitcher/banker? Hard to say, the day after his MLB debut, he was designated for assignment. Somehow, I expect he will persevere and Baseball Roundtable opes (and expects) to see him back in an MLB uniform.

Little League Classic – Big Success

On August 21, the Red Sox and Orioles traveled to Williamsport, Pennsylvania to play in the fifth Little League Classic – a game played (in the minor-league home of the Williamsport Crosscutters) in conjunction with the Little League World Series. This year’s game was won by the Orioles 5-3, but the real  highlight was the interaction between the Little Leaguers and their big-league counterparts – autographs, selfies, high-fives, fist bumps, impromptu games of catch between major leaguers and little leaguers, the sharing of big and little baseball stories and, of course, the cardboard sliding down the hill beyond the center field fence of Lamade (Little League) Field.  As is usual for this great event – a good time was had by all.  Of all the “events” MLB has created recently to boost the game (think Field of Dreams Game and Players Weekend), the Little League Classic is by far my favorite.

Three IS a Crowd

On August 22, the Twins turned their second triple play of 2022. (There have been four triple-killings this season). It came in the top of the fourth inning of a Twins 2-1 loss to the Rangers.  At the time, the game was scoreless and Twins’ starter Sonny Gray had given up a single to 2B Marcus Semien, followed by a four-pitch walk to SS Corey Seager. The next batter, 1B Nathaniel Lowe, lined the first pitch he saw from Gray to Twins’ 1B Jose Miranda. The runners were moving on the hot smash and Miranda tagged first to double off Seager) and tossed to shortstop Carlos Correa, who stepped on the second base bag to retire Semien.

Three for Two

The Twins remain the only team to turn two triple plays in one game. They  came on July 17, 1990, in a 1-0 Twins’ loss to the Red Sox in Boston. Both triple plays (in the fourth and eighth innings) were the most  traditional of triple plays – ground ball  third base (Gary Gaetti, steps on bag); relay to  second (Al Newman); relay to  to first (Kent Hrbek).

More #InBaseballWeCountEverything

On August 24, Mariners’ 24-year-old rookie right-hander George Kirby started against the Nationals in Seattle.  And, he got off to  quite a “start.”  Kirby opened the game by throwing 24 straight strikes (before his first called ball). According to STATS, that represents a record number of strikes to start off a game (at least since the initiation of pitch tracking in 1988). Kirby did not throw a called ball until he was facing his eleventh batter – with two out in the bottom of the third.  Over that span, he fanned three batters, and gave up five singles and one run. While the Mariners eventually lost the game 3-1, Kirby had a solid outing – seven innings (eight hits, one run, no walks and nine strikeouts). He threw 85 pitches (69 for strikes).

Kirby, a first round pick in the 2019 MLB draft (out of  Elon University), has a well-earned reputation as a strike thrower. In 30 minor-league outings, he went 7-4, 2.26 and walked just 21 batters in 117 1/3 innings (139 strikeouts). Thus far in 2022, his MLB record is 5-3, 3.32, with just 13 walks (102 whiffs) in 97 2/3 innings.

Baseball Roundtable Extra … Bartolo Colon Goes on the Record on Strike(s)

On April 18, 2012, the Oakland A’s Bartolo Colon started on the mound against Ervin Santana and the Angels.  During one stretch of that game, won by A’s 6-0, Colon threw 38 consecutive strikes.  (The longest such streak since pitch-by-pitch data began being accurately tracked in 1988.) Were all 38 offerings in the strike zone? Perhaps not, but all those pitches that were outside the zone were close enough that the batters offered at them.

Overall, the streak lasted from the second pitch of the fifth inning until the seventh pitch of the eight frame.  Surprisingly, Colon struck out just two batters during the streak.  He also gave up two hits during the streak of strikes. A few notes:

  • 35 of the 38 pitches were fastballs (two change ups and one slider).
  • There was only one swing and miss (17 strikes looking).
  • There were ten foul fouls and ten balls put in play.

Another Mariners’ Shining Rookie

On August 24, Mariners’ 21-year-old rookie CF Julio Rodriguez popped his 20th home run of the season (the only Seattle score in a 3-1 loss to the Nationals). Matched up with his 23 stolen bases, Rodriguez became just the fourth AL/NL rookie to notch a 20-20 season. The others are: Mitchell Page, 1977 A’s (21 home runs/42 steals); Marty Cordova, 1985 Twins (24 HR/20 SB); Ellis Burks, 1987 Red Sox (20 HR/27 SB).  Rodriguez ended August with a .266-21-65, 23 stolen bases stat line.

More Old Guys Rule

Being and “old guy” myself, I always enjoy it when some of MLB’s most veteran players make the highlights (like Nelson Cruz, Justin Verlander, Albert Pujols and Adam Wainwright). Well, you can add Rich Hill to that list. On August 27, the 42-year-old southpaw – in his 18th MLB season – picked up his sixth win of 2022 (6-5, 4.32) – going seven scoreless innings (three hits, one walk and 11 strikeouts) in a Rays 5-1 win over the Red Sox at Fenway Park.  In the process, he became the first Red Sox pitcher in his 40’s to record at least 11 whiffs in a game.

They Call Him the Streak

From August 3 through August 27, Rangers’ outfielder Adolis Garcia put up a 21- game hitting streak – going 30-for-95 (.316), with three home runs and 16 RBI.

Decisions… Decisions

On August 27, Nationals’ starting pitcher Patrick Corbin pitched six solid innings (four hits, two runs – one earned – one walk and five strikeouts) and picked up the win as the Nationals topped the Reds in Washington D.C. It was Corbin’s fifth win against 17 losses. Why does it make the Highlights? It was the first win by a Nationals’starting pitcher since July 6;  an MLB-record 43 consecutive games without a win from a starter. Over that time, the Nationals’ starters went 0-26.  Here’s a breakdown. (Note: decisions and earned run averages are only as starters, an asterisk indicates the pitcher also had relief appearances during the streak.

  • Patrick Corbin … 0-7, 9.82 in eight starts
  • Anibel Sanchez – 0-5, 5.72 in eight starts
  • Paolo Espino … 0-4, 5.53 in nine starts
  • Erik Fedde … 0-3, 7.50 in four starts
  • Josiah Gray … 0-3, 6.94 in seven starts
  • Cory Abbott* … 0-2, 5.78 in four starts
  • Joan Adon* … 0-1, 9.00 in one start
  • Cade Cavalli… 0-1, 14.54 in one start

Who got that July 6 win?  That was Josiah Gray, who fanned 11 batters in six innings (four hits, two earned runs, one walk) in a 3-2 win over the Phillies.

Soon to Join the 60’s Club

On August 29, the Yankees’ Aaron Judge, in a 4-3 New York loss to the Angels, rapped his 50th home run of the 2022 season – making him one of just two Yankees to have multiple 50-homer seasons (the others – Babe Ruth and Mickey Mantle are fairly well known) – and putting him in good position to join Ruth and Roger Maris as the only Yankees with 60-homer campaigns.  Here are your players with at least one 60 or more homer seasons: Barry Bonds (73 in 2001); Mark McGwire (70 in 1998, 65 in 1999); Sammy Sosa (66 in 1998, 64 in 2001, 63 in 1999); Roger Maris (61 in 1961); Babe Ruth 60 in 1927). Note: Judge ended August with 51 home runs on the season.

Jhoan Duran – On Fire

On August 29, Twins 24-year-old rookie reliever  Jhoan Duran – known for his 103 mph+ fastball – unleashed  100.8 MPH “splinker” (his combination of a splitter/sinker) – reported by STATCAST to be the first documented 100-MPH+  “offspeed” pitch of the pitch-tracking era.  Duran, by the way, pitched the seventh inning of the game – a Twins 4-2 win over the Red Sox – retiring the heart of the Boston batting order on two strikeouts and a ground out. On the season, the rookie is 2-3, 1.91 with six saves and 73 strikeouts in 56 2/3 innings.

Probably Won’t See That Again

On August 31, the Phillies closed out the month with a bang – collecting 22 hits and scoring 18 runs – in an  18-2 win over the Diamondbacks,.  We may see 18 runs again, but these 18 tallies came without the benefit of a single home run. A few other notes:

  • Nine Phillies had multi-hit games;
  • Ten Phillies drove in at least one run;
  • Ten Phillies scored at least one run;

_______________________________________

——-Individual Statistical Leaders for August 2022——

AVERAGE (60 August  at bats minimum)

National League – Jeff McNeil, Mets (.385); Nolan Arenado, Cardinals (.364); Albert Pujols, Cardinals (.361)

American League –  Nathaniel Lowe, Rangers (.389); Eloy Jimenez, White Sox (.371);  Alex Bregman Astros (.362)

The lowest August  average (among players with at least 60 at bats in the month)  belonged to the Guardians’ Myles Straw at .093 (7-for-75).

HOME RUNS

National League – Paul Goldschmidt, Cardinals (9); Nolan Arenado, Cardinals (8); Mookie Betts, Dodgers (9)

American League – Aaron Judge, Yankees (9); Eugenio Saurez, Mariners (9); Shohei Ohtani (8)

The Cardinals’ Albert Pujols had the highest August  slugging percentage (among players with at least 60  at bats) at .803.  The AL  leader was the Astros’ Alex Bregman at .681.

RUNS BATTED IN

National League – Nolan Arenado, Cardinals (29);  Manny Machado, Padres (28); Paul Goldschmidt, Cardinals (27)

American League –  Randy Arozarena, Rays (23); Eugenio Suarez (23); four with 22

HITS

National League – Jeff McNeil, Mets (42); Manny Machado, Padres (40); Nolan Arenado, Cardinals (39)

American League –  Nathaniel Lowe, Rangers (42); Jose Abreu, White Sox (37); Eloy Jimenez, White Sox (36)

The White Sox’ Eloy Jimenez led MLB (players (with at least 60 August at bats) in on-base percentage at .461. The NL leader was the  Cardinals’ Paul Goldschmidt at  at .448.

DOUBLES

National League –  Manny Machado, Padres (14); Jeff McNeil, Mets (13);  Nolan Arenado, Cardinals (12); Michael Harris, Braves (12)

American League –  Alex Verdugo, Red Sox (12); Jose Altuve, Astros (12); Yandy Diaz, Rays (10)

TRIPLES

National League – Lars Nootbaar, Cardinals (3); J.T. Realmuto, Phillies (3); six with two

American League – Shohei Ohtani, Angels (3); Magneuris Sierra, Angels (3); six with two

The Dodgers’ Mookie Betts and Cardinals’ Nolan Arenado tied for the MLB lead in August extra-base hits with 21 each.  

STOLEN BASES

National League –  Jake McCarthy, Diamondbacks (8); Starling Marte, Mets (6); Josh Rojas, Diamondbacks (6)

American League –Bubba Thompson, Rangers (8); Andres Gimenez, Guardians (7); Adolis Garcia, Rangers (7); Cedric Mullins, Orioles (7); Randy Arozarena, Rays (7)

The Diamondbacks’ Jake McCarthy and Rangers’ Bubba Thompson was eight-for-eight in August steal attempts.

WALKS

National League – Juan Soto, Padres (25); Lars Nootbaar, Cardinals, (23); Paul Goldschmidt, Cardinals  (19)

American League – Aaron Judge, Yankees (25); Adley Rutschman, Orioles (22); Carlos Correa, Twins (18)

The Padres’ Juan Soto led in walks/strikeouts ratio (among batters with at least 60 August  at bats)  at 1.92 … 25  walks versus 13 whiffs in 24 games.

BATTER’S STRIKEOUTS

National League – Jose Barrero, Reds (41); Oneil Cruz, Pirates (41); Dansby Swanson, Braves (35); Kyle Schwarber, Phillies (35)

American League – Riley Greene, Tigers (41); Matt Chapman, Blue Jays (35); Adolis Garcia, Rangers (35)

PITCHING VICTORIES

National League – Zac Gallen, Diamondbacks (5-0); Chris Bassitt, Mets (4-0); Tony Gonsolin, Dodgers (4-0): Ryan Hensley, Cardinals (4-0); Jordan Montgomery , Cardinals (4-0); Julio Urias, Dodgers (4-1); Kyle Wright, Braves (4-10; Jacob deGrom, Mets (4-1)

American League – Framber Valdez, Astros (5-0); George Kirby, Mariners (4-0); Cal Quantrill, Guardians (4-0); Michael Wacha, Red Sox (4-0);  Lucas Giolito, White Sox (4-2); Marco Gonzalez Mariners (4-2)

 EARNED RUN AVERAGE (at least 25 innings pitched)

National League –  Zac Gallen, Diamondbacks (0.61); Drew Smyly, Cubs (0.90); Julio Urias, Dodgers (0.90)

American League – Patrick Sandoval, Angels (1.39); Drew Rasmussen, Rays (1.57); Shane Bieber, Guardians (1.62)

Among pitchers with at least four August starts or 20 August innings, the Diamondback s’ Madison Bumgarner  had the highest ERA at 9.23 (27 earned runs in 26 1/3 innings in five starts).

STRIKEOUTS

National League – Jacob deGrom, Mets (55 / 36 1/3 innings); Blake Snell, Padres (46 / 32 innings); Zac Gallen, Diamondbacks (44 / 40 innings); Max Scherzer, Mets (44 / 40 2/3 innings)

American League – Triston McKenzie, Guardians (43 / 38 2.3 IP); Lance Lynn, White Sox (42 / 36 2/3 IP); Kevin Gausman, Blue Jays (42 / 36 2/3 innings); Gerrit Cole, Yankees (42 / 39 1/3 IP)

SAVES

National League – Daniel Bard, Rockies (6); Edwin Diaz, Mets (6); Kenley Jansen, Braves (6)

American League – Lam Hendriks, White Sox (9); Felix Bautista,Orioles (7); Emmanuel Clase, Guardians (7)

WHIP (Walks +  Hits per Inning Pitched – 25 innings minimum)

National League – Jacob deGrom, Mets (0.55); Zac Gallen, Diamondbacks (0.75); Freddy Peralta, Brewers (0.81)

American League – Drew Rasmussen, Rays (0.67); Cal Quantrill, Guardians (0.76); Justin Verlander, Astros (0.79)

__________________________________

If the season ended August 31, the post-season teams would be:

National League: Dodgers, Mets, Cardinals   Wild Cards: Braves, Phillies, Padres

American League: Astros, Yankees, Guardians   Wild Cards: Rays, Mariners, Blue Jays

—–Statistical Leaders Through August 2022 ———-

RUNS SCORED … Average 561

National League – Dodgers (691); Braves (646); Cardinals (644)

American League – Yankees (652); Blue Jays (600); Astros (593)

The fewest  runs (through August) were scored by the Tigers – 431. The Pirates tallied the fewest runs in the NL at 463.

AVERAGE  …  Average .243

National League – Dodgers (.261); Rockies (.261); Cardinals (.258)

American League – Blue Jays (.260); White Sox (.260); Red Sox (.258)

The lowest team average through August  belonged to the A’s at .215. The Pirates  were at the bottom of the NL at .220.

HOME RUNS …  Average 139

National League – Braves (194); Brewers (181); Dodgers (170)

American League –  Yankees (205); Astros (172); Rangers  (159)

The Tigers  had the fewest home runs through August  at 76 … the only team under 100 dingers.

The Dodgers led MLB in slugging percentage through July at .449.  The Blue Jays led the AL at .426.  The average tam sluggiung percentage was .395.

STOLEN BASES … Average 66

National League – Marlins (108); Phillies (86); Cubs (86)

American League – Rangers (101); Royals (85) ; Guardians (83)

The Twins stole the fewest sacks through August (27 in 42 attempts).   The Rockies were at the bottom of the NL with 36 in 52 attempts.  The White Sox stole 41 bases through August and were caught just eight times.

WALKS DRAWN … Average 399

National League –   Dodgers (485); Padres (476); Brewers (467)

American League  Yankees (500); Mariners (464); Astros (439)

The Dodgers  led MLB  in on-base percentage through August at .337. The Yankees led the AL  at .323.  The A’s had MLB’s lowest  OBP through August at .280.  

BATTER’S STRIKEOUTS … Average 1,086

National League – Braves (1,211); Pirates (1,205); Reds (1,145); Cubs (1,157)

American League – Angels (1,264);  Tigers (1,140); Rays (1,134)

Guardians’ batters fanned the fewest times through August  (887).

Earned Run Average … Average 3.98

National League – Dodgers (2.82); Mets (3.51); Braves (3.53)

American League – Astros (3.03); Yankees (3.31); Rays  (3.32)

Two teams had  ERAs through August of 5.00  or higher – Nationals (5.11) and  Rockies (5.05).

STRIKEOUTS … Average 1,086

National League – Braves (1,245); Mets (1,235); Brewers (1,217)

American League –  Astros (1,182); Yankees (1,172); White Sox (1,157)

The Braves, Mets and Brewers averaged an MLB-best 9.5 strikeouts per nine innings through August. The Astros averaged an AL-best 9.2. Eight teams average at least nine  whiffs per nine innings.

FEWEST WALKS SURRENDERED… Average 399

National League  – Dodgers (320); Giants (356); Mets (357)

American League –  Rays (304); Blue Jays (342); Yankees (342)

The Rays walked an MLB-lowest 2.4 batter per nine innings through August.  The Dodgers were best in the NL at 2.5.  The Royals walked an MLB-worst 3.9 batters per nine frames.

SAVES … Average 33

National League – Braves (44); Brewers (43);  Padres (42)

American League – Astros (41); White Sox (39); Yankees (38);

Bonus Stats:

  • The Nationals gave up an MLB-high 195 home runs through August. By contrast, the Astros and Giants gave up an MLB-low 111.
  • There were 26 complete games through August. The Marlins had the most complete games at four.  Sixteen of the 30 MLB teams have yet to record a complete game.
  • There have been 275 team shutouts (ten of those single-pitcher complete game shutouts). The Mets have the most shutouts with 17.
  • The Mariners committed the fewest errors through August (47) and had the top fielding percentage at .990. The Pirates committed an MLB-high 95 fielding miscues through August. 

Primary Resources: Baseball-Reference.com; ESPN.com; MLB.com


100Baseball Roundtable is on the Feedspot list of the Top 100 Baseball Blogs.  To see the full list, click here.

I tweet baseball @DavidBaseballRT

Follow/Like Baseball Roundtable’s Facebook Page here.  More baseball commentary; blog post notifications.

Member: Society for American Baseball Research (SABR); The Baseball Reliquary; The Negro Leagues Baseball Museum.

Baseball Roundtable, blogging baseball since 2012.