This post will focus on the results of Baseball Roundtable’s first-ever fan survey – a 26-question (primarily multiple choice) effort that covered topics from the ballpark and ball game experience to the worthiness of Hall of Fame candidates to MLB rules and how respondents would change the national pastime if they could. The survey drew 141 responses – and I thank each of you for participating. For those reading this post, you might enjoy comparing your opinions to those of fellow fans. Clearly, there is food for thought here. (Many respondents came from groups like Baseball Fans of America, The Baseball Reliquary and the Society for American Baseball Research).
What BBRT found (in general) is that survey respondents:
- Like a close game, played on a grass field, lit by sunlight;
- Think 2 1/2 hours is about the right time for a nine-inning contest;
- Prefer double plays to strikeouts;
- Are most likely to enjoy a traditional beer and hot dog at the ballyard.
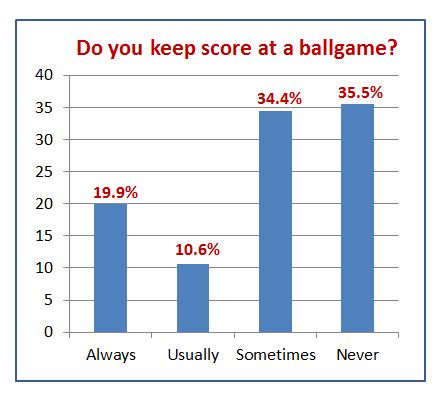
- Have about a one-in-three likelihood of maintaining a scorecard;
- Prefer bobbleheads above other giveaways;
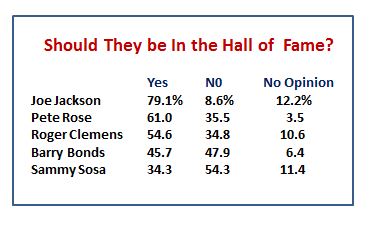
- Would put Joe Jackson in the Hall of Fame;
- Are still likely to be hotly debating the Designated Hitter rule; and
- If they could change one thing about the national pastime, it would be to improve the pace of the game – most likely by reducing the number of (and time allowed for) pitching changes.
Of course, the survey covered much more. I hope you enjoy the read. (Special shout out to Google Forms – great survey tool.)
—- THE BALL PARK … WHERE AND WHEN RESPONDENTS PREFER TO TAKE IN A GAME —
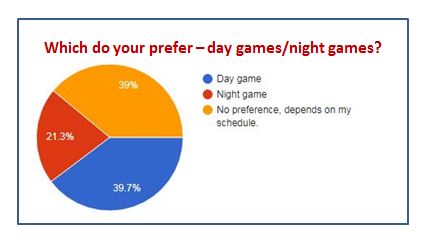
Fans are headed out the ballpark – and what kind of atmosphere are they hoping for? Baseball Roundtable Fan Survey respondents indicated they would (slightly) prefer a day game over a night game; have a significant preference for outdoor baseball (We Minnesotans can relate to that one); and overhwlemingly prefer natural grass to artificial turf. Here are the details.
Day games were preferred over night games 39.7 percent to 21.3 percent – but it’s significant to note that 39 percent also said they had no preference, and that it would depend on their schedule. (Darn work! They always expect you to show up.)
Just over 70 percent of the respondents preferred an outdoor ballpark. Another 12 percent went for a retractable roof. (Best of both worlds? Perhaps.)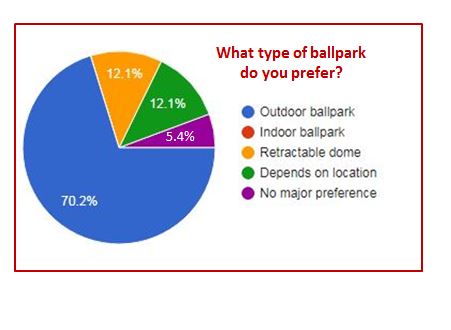 Natural Grass – Oh Yeah!
Slugger Dick (Richie) Allen once gave this evaluation of artifical turf, “If a horse won’t eat it, I won’t play on it.” The Baseball Roundtable survey respondents feel pretty much the same way. Asked for their preference, an overhwelming 93.6 percent said “Natural Grass;” 5.7 percent had “No Major Preference;” and one lone respondent selected “Artificial Turf.”
—- THE OLD BALL GAME—-
What kind of game did respondents want to see once they got to the ballyard? Ideally, a competitive contest (slight edge to pitchers’ duels) of about 2 1/2 hours in length. And, when it comes to action – despite today’s hard-throwing/free swinging trend toward more and more strikeouts and home runs (MLB is setting records for both this season) – survey respondents far preferred to see double plays over double whiffs and and were evenly split on the merits of seeing consecutive home runs or consecutive triples.
What follows are the totals for this portion of the survey.
What did respondents see as the ideal length (in time, not innings) for a ballgame? More than one-in-four respondents (28.5 percent) said 2 1/2 hours is just about right. Notably, a two-hour and 15-minute game was preferred by fewer (4.3 percent) than either a three-hour (8.5 percent) or a 2-hour and 45-minute matchup (8.5 percent). About one-in-six would perfer to go back to the old “two-hours, give-or-take” ball game. The big winner, however, was “Who cares, you’re at the ballpark” – at 38 percent. It appears fans may be spending less time looking at their watches (or cell phone clocks) than we think. (Many are, however, spending plenty of time on their smart phones. Nothing like a selfie or tweet at the ballpark, especially if you are in “hot” foul ball territory.) Here are the answers to the fans’ take on the ideal length of a ball game.
- Who cares, you’re at the ballpark … 38.0%
- 2 1/2 hours … 28.4%
- 2 hours … 17.7%
- 3 hours … 8.5%
- 2 hours, 45 minutes … 6.4%
- 2 hours, 15 minutes … 4.3%
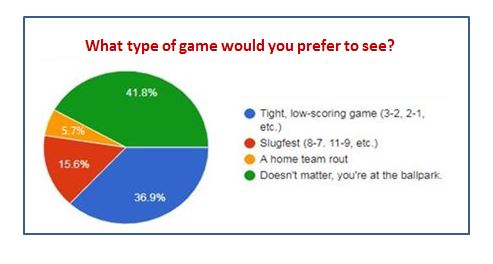
When it comes to choosing between a slugfest, pitchers’ duel or a crushing home team win, it appears just “being at the ballpark” may be rewarding enough for nearly 42 percent of the respondents. Second in the category of what kind of game would fans prefer to see was a tight, low-scoring game at 36.9 percent, more than double the 15.6 percent who would opt for a slugfest. A competitive game was the common denominator, as only 5.7 percent preferred a home team rout.
Baseball Roundtable Fan Survey respondents leaned toward the National League style of basesball, with 49.6 percent preferring the NL style of play to 27 percent favoring that American League style and 23.4 percent having no preference. Next survey, I believe I’ll ask for opinions on what separates the two styles.
When it comes to long balls or speedy trips around the bases, respondents were pretty evenly split between the preference for seeing back-to-back home runs or back-to-back triples. Ideal, I guess, would be back-to-back inside-the-park home runs.
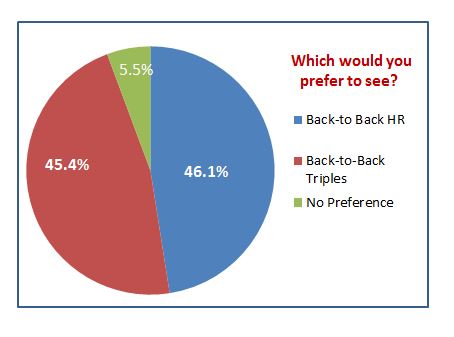
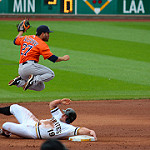
Photo by roy.luck 
In these posts, I often go on (maybe a little too long) on how a baseball game isn’t complete for me until I see a solid groundball double play. Hooray, I found some support among respondents. When it came to choosing between seeing consecutive strikeouts on 95-mph heaters or a 6-4-3 double play; the double play far outdistanced the strikeouts.
- Prefer to see a 6-4-3 double play … 61 percent
- Prefer to see consecutive strikeouts on 95 mph-heaters … 22 percent
- No Opinion … 17 percent
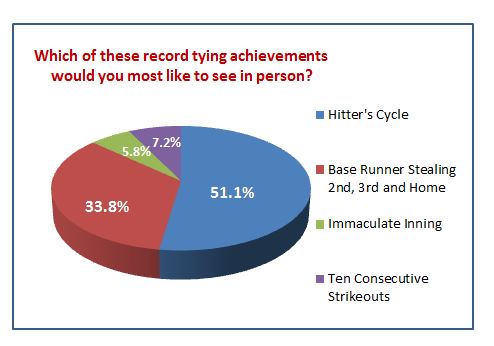
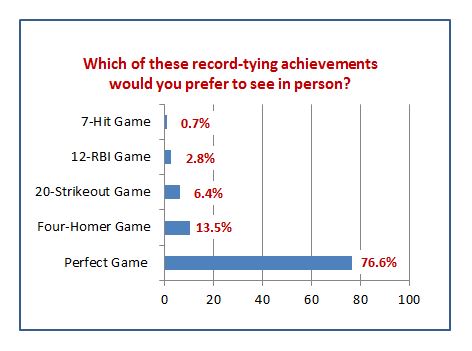
When it came to witnessing record-tying peerformances at the ballpark, respondents again relegated strikeouts to the back seat. As the two charts below indicate, with a chance to witness history at the ballyard, respondents would be most excited about a pitcher’s perfect game. And, for the most part, hitter’s cycles, four-homer games and three-steal innings outdistanced such achievements as twenty-strikeout games, ten-consecutive strikeouts and Immaculate Innings. Four-homer games, I am confident, would have fared better if not put in the same multiple choice query as perfect games.
—BALLPARK FOOD AND DRINK—
I also asked about food and beverage choices, but with all there is at ballparks these days – I do a post on just the Twins’ “new” food and drink offerings each year – some may queston the validity of these questions. The answers reflected the heart and history of the national pastime – beer and hot dogs at the ball park.
There still is nothing like a beer at the ballpark – the number-one beverage in the survey, even if you combine regular and diet soda into one category. I was surprised by the nearly 20 percent who selected bottled water. It’s a new day, I guess. Those who follow this blog know I traditionally rate each ball park’s Bloody Mary, so I’m in the 3.6 percent “mixed drink” crowd. A few of the write-ins included: iced tea; Frosty Malts (never thought of those as beverages – but there is nothing like the combination of chocolate, malt and a wooden spoon); and “My own reusable water bottle.” My apologies to many for not including wine on the list … but I do not see a lot of wine at ball games, so the grape slipped under the radar.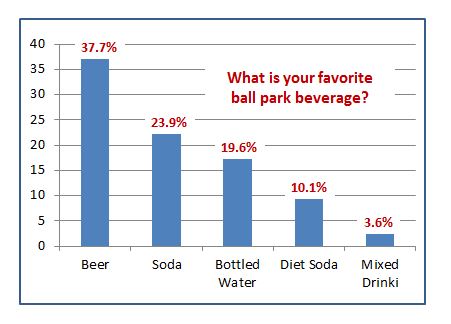
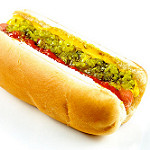
Photo by TheCulinaryGeek
The survey indicated beer and hot dogs (or some form of portable sausage) remain a baseball tradition. Hot dogs (or sausages) were listed as a preferred food by 60 perent of the respondents. “Something New and Different” finished second at 12.9 percent. Here’s the full results:
- Hot Dogs/Sausage … 60%
- Something New/Different … 12.9%
- Peanuts … 11.4
- Pizza … 4.3%
There were also a number of write-ins, including Cracker Jack, popcorn, nachos, ice cream sandwich, seeds, chicken tenders, “something healthy and inexpensive,” the very specific “beef sandwich at Yankee Stadium,” and “I sneak in my own food.” (Could be the same respondent as the reusable watter bottle.) One thing for sure, no need for anyone to go hungry at a ball game. (No comment on prices here. Maybe in the next fan survey.)
—HOW ABOUT FREEBIES?—
Something free at the ball park? What’ll it be. No surprise here, bobbleheads lead the way – the favorite of 34.1 percent of respondents. Also finishing strong were: baseball caps and replica jerseys. For me anything free is a bonus – kind of like (but not as good as) extra innings. Here are the responses:
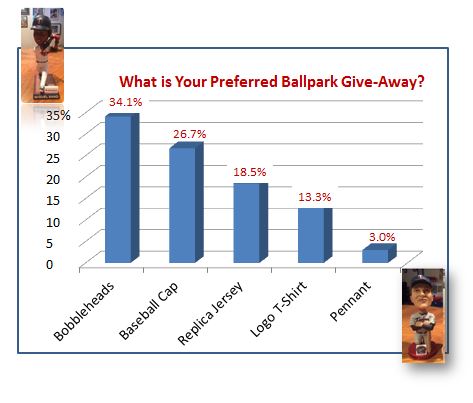
Among the write-ins were baseball card packs; visors; ice chest (that was a pretty specific response); something made in the USA; and “I don’t go for giveaways.”
KEEPING SCORE – ONE OF MY FAVORITE PARTS OF THE GAME
Photo by Paul L Dineen
Okay, I admit I’m biased. I love to keep score. So, in fact, does my daughter, who’s been filling out scorecards at ball games since she was nine-years-old. I used to love the looks of other fathers whose young sons were more interested in the mascot, graphics and games on the video board or cotton candy vendors than the game, while my daughter was dutifully noting every K, 6-4-3 or 2B on her scorecard. We always had to arrive early, so we could finish our food and drink before it was time to fill out the lineup. Now, I do lament that I see very view scorecards or scorebooks at the games anymore, but the survey was at least a bit heartening. (Although you have to take into account the the respondents were drawn from followers of Baseball Roundtable and fellow members of groups like The Baseball Reliquary, Baseball Fans of America and SABR’s Halsey Hall Chapter. So it’s a little skewed.) However, at least among survey respondents, just over 30 percent said they “always” or “usually” kept score. That warms my heart.

—THE HALL OF FAME … SHOULD THEY BE IN? —
Now, we’re moving into the more complex issues in the survey, starting with a question on whether respondents would vote to put specific players in the Hall of Fame – specifically Joe Jackson, Pete Rose, Barry Bonds, Sammy Sosa and Roger Clemens. No need for commentary here, the votes speak on their own. Only Jackson would get the 75 percent needed for election.
We also asked fans to: Name one player who isn’t in the Basebal;Hall of Fame who should be.
A total of 124 respondents wrote in an answer to this one – coming up with 43 different names, ranging from Pete Rose to Marvin Miller to Johnny Kling. Here are the top ten, with the total “mentions” in parenthesis. (Side note: BBRT was surprised that neither 283-game winner Jim Kaat nor Trevor Hoffman and his 601 saves made the top ten.)
1. Pete Rose (36)
2. Barry Bonds (11)
3. Alan Trammell (8)*
4. Joe Jackson (7)
5. Dick Allen (5)
5. Edgar Martinez (5)
6. Fred McGriff (3)
6. Gile Hodgers (3)
6. Dave Concepcion (3)
6. Tony Oliva (3)
6. Lou Whitaker (3)
6. Dale Murphy (3)
6. Mark McGwire (3)
* A surprise here. With Alan Trammell and Lou Whitaker most often mentioned in the same sentence, Trammell got more than twice as many “mentions” here as Whitaker.
—THE RULES … OLD SCHOOL OR NEW—
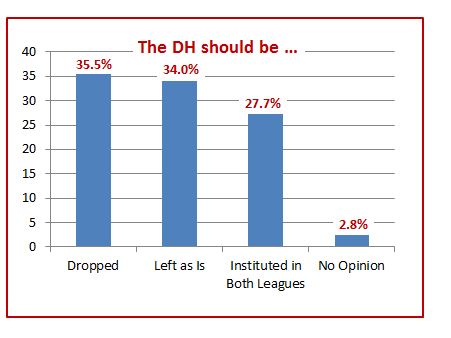
Now, let’s move on to a look at some of MLB’s rules that seem to generate conversation – and at times controversey – among baseball fans. Depite being around for four decades, the DH rule continues to generate considerable debate and generated the widest split among respondents,with fairly equal numbers calling for no DH, the DH in both leagues and the current split. The two Wild Card system garnered the highest level of support (two-thirds of respondents liked it), while the new “wave the batter to first” intentional walk rule was opposed by more than 60 percent. Here’s a look at the survey questions (and responses) related to a handful of MLB rules.
First, the Designated Hitter – part of the American League rules since 1973. Still plenty of debate here, with 35.5 percent thinking the DH should be dropped altogether, 27.7 percent wanting to see the DH in both leagues and another 34 percent preferring the current situation. Looks like we’ll be talking about this for some time yet.
When it comes to interleague play, we also saw a fairly strong split, leaning just a bit (51.4 percent) toward interleague action. Notably, respondents did volunteer a few suggestions for improving interleague play. Those included having each division’s teams play the same teams from the other league each season (to balance competition); having every team play each team in the other league at least once each season; and limiting interleague action to one game on any given day. 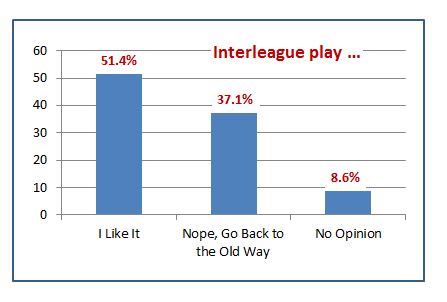
The current two Wild Card system was a hit, liked by 66.7 percent of respondents and opposed by about one-in-four. Clearly, fans like the way the Wild Card opportunity keeps more teams “in the race” until late in the season. Being a Twins’ fan, it worked for me this year – but I’d kind of like the Wild Card to be two-of-three, so we’d be guaranteed at least one home game out of it. 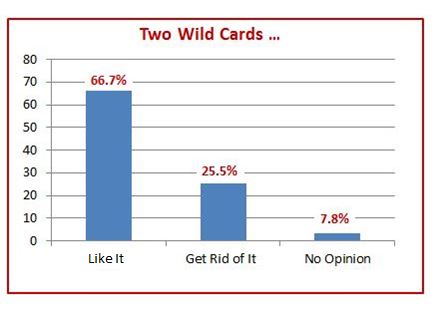
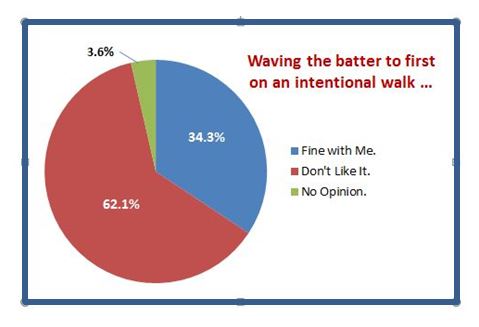
The new rule allowing a batter to be waved to first drew the most opposition in the fan survey, with just over 60 percent (62.1 percent) opposing it, while about one-third were “fine” with the new rule. Personally, I don’t care much for it. I’ve seen enough go wrong (or right, depending on your vantage point) during the old-style intentional pass to want to see it played out.
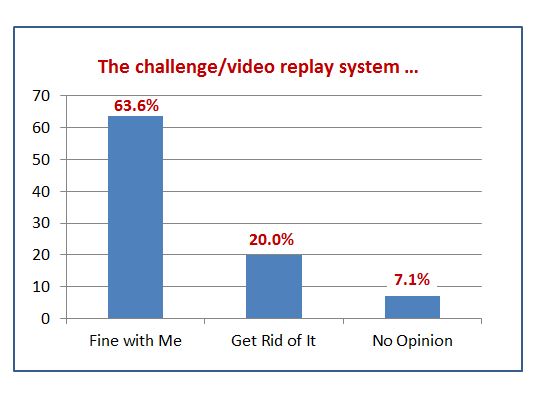
 This next one surprised me, as 63.6 percent of respondents were fine with the current challenge/video replay system – and only 20 percent would prefer to get rid of it. You’ll notice the total in the chart below does not add up to 100 percent. That because about 10 percent wrote in answers – for the most part indicating they were okay with the system if the process could be completed in a more timely (much more timely for most) manner.
 —CHANGING THE OLD BALL GAME—
The survey drew 119 responses to the write-in question: “If you could change one thing about major league baseball, what would it be?” As you can imagine, the responses covered a lot of ground – from having a baseball skills competition at the All Star game to dumping the new Intentional Walk rule to reining in the proliferation of statistics. We’ll take a look at some of the most discussed issues or changes.
GETTING VERY SPECIFIC – ERRORS AND THE INFIELD FLY RULE
The most specific change recommended related to the Infield Fly Rule. One repondent suggested that if a fielder (unintentionally) drops an infield fly, it should be considered an error. The ball should be declared dead, the batter awarded first and all runners advance. The logic suggested was that “The defense should not be rewarded for an error.”
Speeding up the pace of the game was the issue that drew the most responses and the emphasis was on pitching and pitching changes in particular. (Twenty-three of the 119 responses related to mound/time issues.) A host of fans simply think the pace of the game would improve if we didn’t see so many pitching changes. Among the suggestions were:
- Requiring a reliever to finish an inning or give up a run before being replaced;
- Requiring each reliever to retire at least one batter; and
- Reducing the size of pitching staffs.
The survey also saw multiple respondents suggresting that MLB:
- Limit catcher visits to the mound;
- Limit the number of times a pitcher can leave the mound; and
- Better enforce the pitch clock (although there were a nearly equal number of calls to eliminate the pitch clock).
Batters were also the subject of suggestion – particularly:
- Requiring a batter to stay in the batters’ box between pitches, except in cases of injury or game interruption (like a catcher or coach visit to the mound).
Respondents also wanted to reduce the time between innings or pitching changes – with many placing the blame on the need for TV commercial breaks.
As you might expect, the Designated Hitter rule came under fire with two main lines of thought – no surprise:
- Elminate the DH (5 respondents);
- Adopt the DH in both leagues (3 respondents).
There were also seven calls for lower prices (with a focus on ticket prices) and a handful of respondents who focused on September call-ups. The two lines of thought there were to either eliminate the September roster expansion or allow it in both April and September.
Here are a few others, BBRT found interesting: reduce interleague play; allow baserunners to initate a “challenge”; eliminate the challenge and replay; make the Wild Card playoff a best-of-three; install a laser system for foul balls and home runs; tougher drug penalties; have each team schedule one (single ticket) double header each month; more day games; demote umpires (back to the minors) the same way you demote/call-up players; eliminate the new “slide” and intentional walk rules.
—TOPICS FOR FUTURE SURVEYS—
Thanks to all who filled out this first Baseball Roundtable Fan Survey. I plan more (shorter) surveys in the future and would like your input. You can use the comments section to put forward topics you think should be explored (or even to suggest I drop the survey idea).
Thanks agian to all who responded, to all who follow BBRT – and enjoy the post-season.
I tweet baseball @DavidBBRT.
Follow/Like Baseball Roundtable’s Facebook page here. You’ll find additional baseball commentary, blog post notifications and prizes.
Member: Society for American Baseball Research (SABR); The Baseball Reliquary; The Negro Leagues Baseball Museum.


