Longest HR of 2015 – Kris Bryant? Could be.
One of the great things about baseball is that it has always been “highly debatable.” Within the game – safe or out on a close play; ball or strike on a close pitch; fair or foul (over the bag or by the fair pole); clean catch or trap. You get the idea. Our national pastime has also stirred conversation (and controversy) on a broader scale. Who hit the longest home run? Who had the best fastball? Best outfield arm? Widest range at shortstop? And, on and on. Well now it seems that technology may be taking some of the oh-so-sweet uncertainty out of the game. Or is it?

Or maybe it was Giancarlo Stanton.
Consider the first question listed: Who hit the longest home run? Not so many years ago, long ball distances were estimates that seemed to come down magically from somewhere in the boxes on the second deck – stirring plenty of debate. (My dad and I spent some time discussing whether Harmon Killebrew or Bobby Darwin hit the longest left-field, second-decker at the Twins’ old Metropolitan Stadium.) Now technology definitively tells us not only distance each home run would have traveled if unimpeded, but also pitch speed, bat speed, velocity off the bat and more. Or does it?
I am happy to say, debate lives on. In 2015, home run distance was “measured” (using high technology) by both MLB.com’s Statcast and ESPN’s Home Run Tracker. According to Statcast, the regular season’s longest home run would have traveled 495 feet – and it was hit by Cubs’ third baseman Kris Bryant off D-backs’ right-hander Rubby De La Rosa on September 6. Over at ESPN (Home Run Tracker), the longest of the long balls is credited to the Marlins’ Giancarlo Stanton, who stroked home runs projected at 484 feet on June 6 and June 23. Bryant’s smash comes in at 467 feet – and at number 20 – on the ESPN list. Stanton does a little better on the Statcast ranking. His Home Run Tracker-leading blasts come in eighth on Statcast list. One area of agreement, Stanton is the only player to appear among the top ten of 2015’s longest home runs multiple times on both lists – 8,9,10 on the Statcast ranking and 1, 2, 9 and 10 (tie) on Home Run Tracker.
Here are the top ten long-distance blasts for each tracking system.
MLB.com Statcast
Kris Bryant, Cubs 495.3 feet September 6
Michael Taylor, Nationals 492.8 August 20
Jonathan Schoop, Orioles 484.5 August 26
Nelson Cruz, Mariners 482.7 April 29
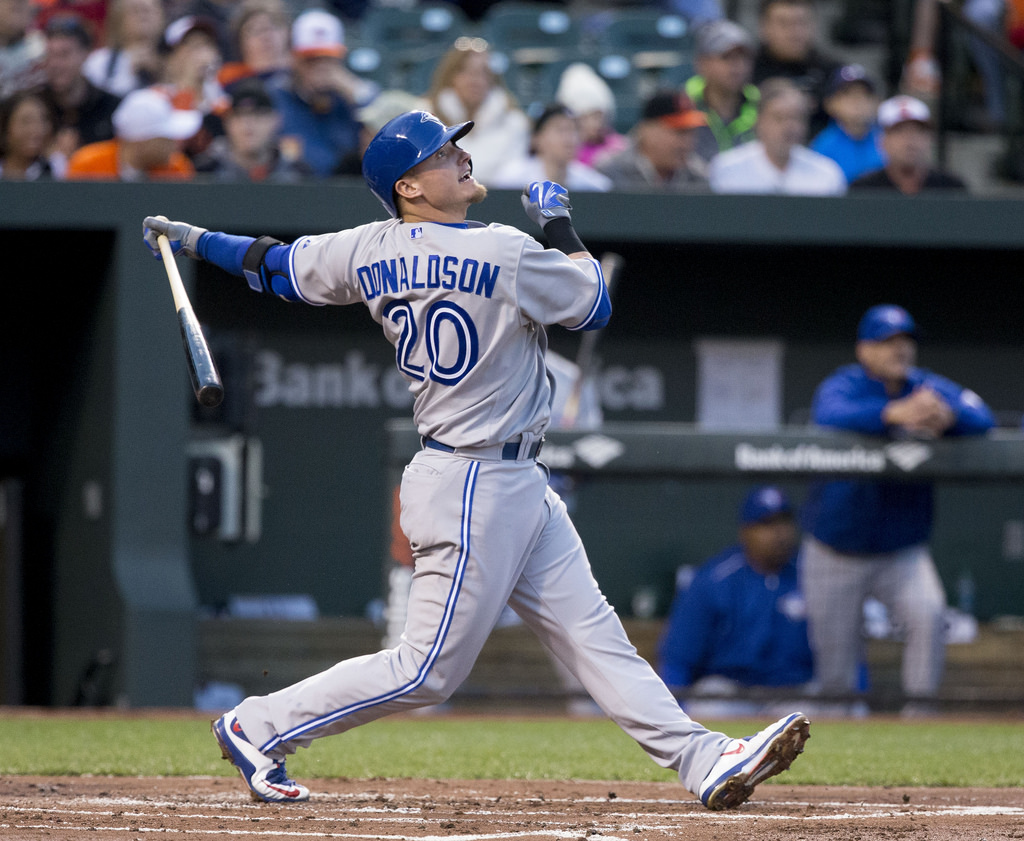
Josh Donaldson, Blue Jays 481.2 April 23
Hanley Ramirez, Red Sox 480.5 June 21
Pedro Alvarez, Pirates 478.9 October 4
Giancarlo, Stanton, Marlins 478.8 June 23
Giancarlo, Stanton, Marlins 478.4 May 16
Giancarlo, Stanton, Marlins 478.4 June 5
ESPN Home Run Tracker
Giancarlo Stanton, Marlins 484 feet June 23
Giancarlo, Stanton, Marlins 484 June 6
Paul Goldschmidt, D-backs 482 August 26
Joc Pederson, Dodgers 480 June 2
Michael Taylor, Nationals 479 August 20
Alex Rodriguez, Yankees 477 April 17
Jung Ho Kang, Pirates 476 September 8
Brett Lawrie, A’s 476 August 28
Giancarlo, Stanton 475 May 16, 2015
Jarrett Parker, Giants 474 September 25
Giancarlo, Stanton, Marlins 474 May 15
Aroldis Chapman Brings the Heat.
Does Aroldis Chapman bring more heat than Steve Dalkowski? We’ll never know, but he’s clearly the fastest pitcher out there today. In 2015, according the MLB.com’s Statcast, there were 32 pitches of 103 mph or more thrown during the regular MLB season – and all 32 were thrown by Chapman. In fact, the Reds’ fireballer (who, in 2010, threw the fastest pitch ever recorded at 105.1 mph) threw the 62 fastest pitches of the 2015 regular season. The first non-Chapman pitch on the velocity list (and the fastest pitch thrown in the AL) belonged to the Yankee’s Nathan Eovaldi (102.35 mph). Ironically, both hurlers saved their best for Twins’ All Star second baseman Brian Dozier. Dozier took that 102 mph fastball from Eovaldi for a ball (August 19 at Yankee Stadium), and he fouled off Chapman’s fastest offering of the season (103.92 MPH) on June 29 at Cincinnati’s Great American Ball Park. What kind of results did Chapman’s heater produce? His 2015 stat line: 4-4, 1.63 ERA, 33 saves, 116 strikeouts in 66 1/3 innings (15.7 whiffs per nine innings). Chapman’s strikeouts per nine innings were down from 2014 – when he fanned 17.7 batters per nine.

I tweet baseball @DavidBBRT
Member: Society for American Baseball Research; The Baseball Reliquary; Baseball Bloggers Alliance.