With MLB’s Opening Day 2026 (actually Opening Night this year) just three weeks and a day away, Baseball Roundtable would like to use this Tuesday’s Trivia(L) Tidbits to celebrate the dawn of a new season with an updated and expanded version of Opening Day records for MLB players to shoot for or try to avoid.
Two disclaimers here. Given statistical accuracy and game formats, I am limiting myself to the Modern Era (post 1900) and Negro League game stats from 1920-48 have not been fully documented and incorporated into the MLB record book.
“You always get a special kick on Opening Day, no matter how many you go through. You look forward to it like a birthday party when you’re a kid. You think something wonderful is going to happen.”
Hall of Famer Joe DiMaggio
So, let’s look at some Opening Day stats and stories – some wonderful, some not so great. We’ll start with an MLB unicorn looking to extend his existing record and add a unique spin to it. Note: For this post, “Opening Day” refers to the first game of the season for each team, not just the first day of the MLB season (for example, this season will open on March 25 with just one game … Yankees at Giants).
LET’S GET THIS PARTY STARTED … The PLayer I’ll Be Tracking Most Closely in His Season Opener
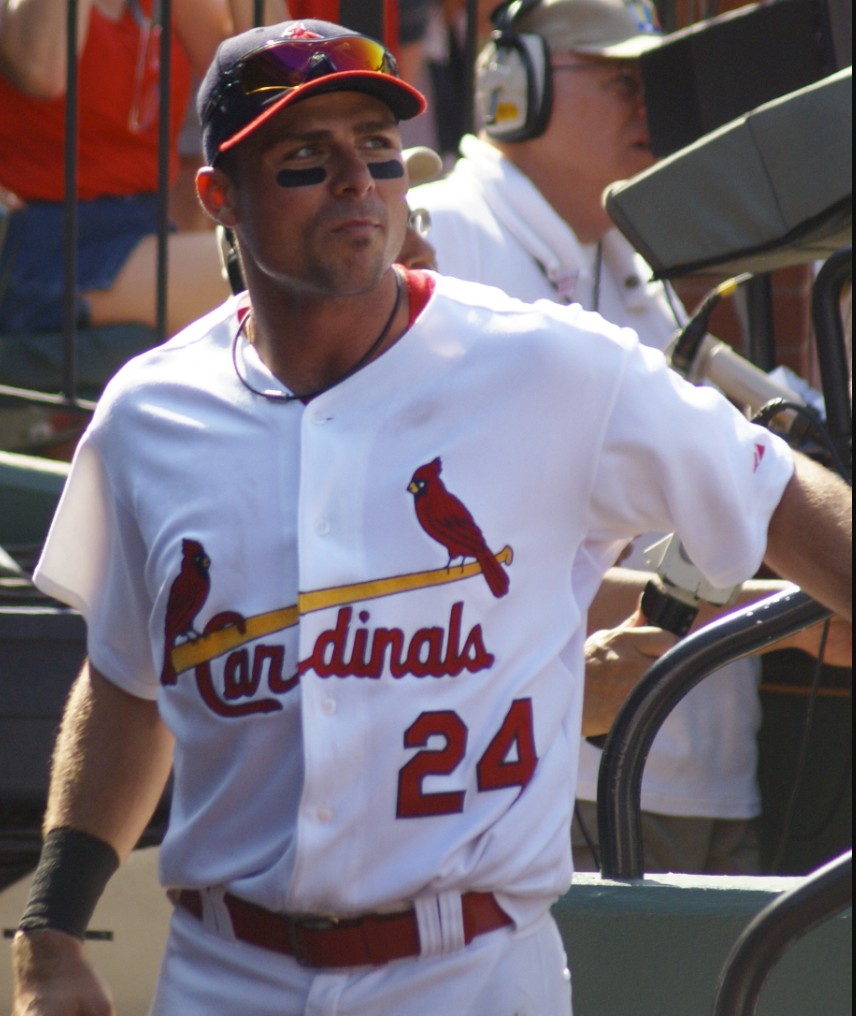
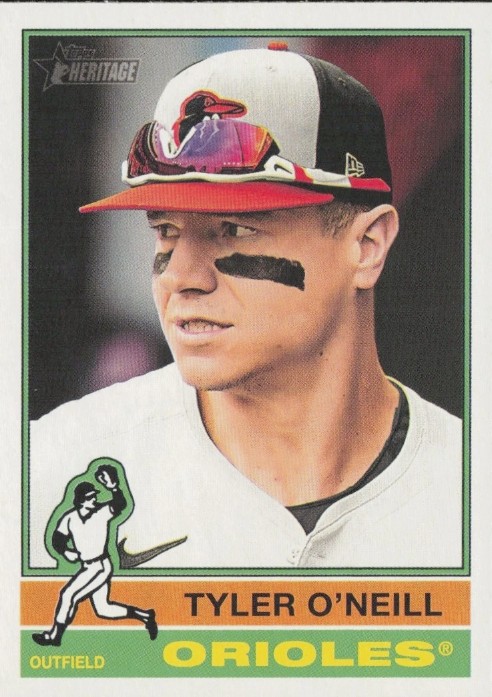 Orioles’ outfielder Tyler O’Neill, will be looking to extend his enviable (and almost unbelievable) record of going deep in six consecutive Opening Day (OD) games.
Tyler O’Neill – Opening Day Home Runs
July 24, 2020* … (for the Cardinals versus the Pirates’ Joe Musgrove)
April 1, 2021 … (for the Cardinals versus the Reds’ Cam Bedrosian)
April 7, 2022 … (for the Cardinals versus the Pirate’s JT Brubaker)
March 30, 2023 … (for the Cardinals versus the Blue Jays’ Alek Manoah)
March 28, 2024 … (for the Red Sox’ versus the Mariners’ Cody Bolton)
March 27, 2025 … (for the Orioles versus the Blue Jays’ Jose Berrios)
*Late-starting COVID season.
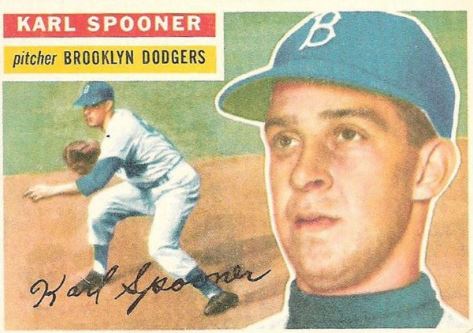
O’Neill has homered in every Opening Day game he has started. His only other Opening Day appearance was in 2019, when he had one plate appearance as a pinch-hitter for the Redbirds and flied out to CF versus the Brewers’ Junior Guerra. In his seven Opening Day appearances, O’Neill is 9-for-21 (.429), with six home runs, 14 RBI and ten runs scored. He’s also drawn five walks for a .538 on-base percentage. Among players with at least 25 Opening Day plate appearances, O’Neill is the leader in slugging percentage (1.286).
Travelin’ Man
Tyler O’Neill is the only MLB player to go deep on Opening Day for three different teams in three consecutive years.
GETTING ON BASE … A Fielder Does It Best
Among players with at least 25 OD plate appearances, Fielder Jones leads in on-base percentage (.624) … 32 plate appearances in seven OD games, with 12 hits and eight walks. Jones, a centerfielder, played 15 MLB seasons (1896-1908, 1914-15 … Superbas, White Sox, Federal League St. Louis Terriers), hitting .285-21-631, with 1,180 runs scored.
Ahead of the Eight Ball
The career record for home runs in Opening Day (OD) games is eight, shared by Frank Robinson (20 OD games/76 AB); Ken Griffey, Jr. (21 OD games/71 AB); and Adam Dunn (13 OD games/54 AB). Trailing these three at seven OD game homers are: Babe Ruth, Willie Mays and Eddie Mathews. Impressive list, I’d say. Among active players, the leaders in OD long balls, at six, are: Bryce Harper and, of course, the already discussed Tyler O’Neill.
FIVE WHIFFS – A (strikeout) Victim of Circumstance
Which player became a “victim of circumstance” in the process of becoming the first MLB player to fan five times on Opening Day? That would be Ron Karkovice.
On March 31, 1996, White Sox’ catcher Karkovice set the still (but since tied) MLB Opening Day record by striking out five times as Chicago lost 3-2 in Seattle. Karkovice, however, may have been a victim of circumstance.
First Circumstance: Future Hall of Famer (and whiff artist) Randy Johnson started on the mound for the Mariners – striking out 14 in seven innings (including Karkovice three times). Johnson holds the MLB record for Opening Day career strikeouts with 107 (14 Opening Day Games – 97 2/3 innings pitched). Second on the OD list is Tom Seaver with 81 strikeouts in 16 Openers.
Second Circumstance: The White Sox could muster only two runs on four hits over the first nine innings – taking a slim 2-1 lead into the bottom of the ninth (at that point, Karkovice had fanned just three times).
Third Circumstance: The Mariners tied the contest in the ninth, and the game went to 12 innings before the Mariners prevailed 3-2. In those three extra innings, Karkovice struck out against Norm Charlton (tenth inning) and Edwin Hurtado (twelfth inning) to set the Opening Day record.
Since Karkovice’s disappointing day, two players have matched his five OD-game strikeouts – and both did it in nine innings. In the Dodgers’ 2023 opener (versus the Diamondbacks in Arizona), Dodgers’ 3B Max Muncy (batting cleanup) fanned five time in five at bats. In 2025’s Brewers’ season opener (versus the Yankees in New York), Brewers’ starting LF Jackson Chourio tied the OD record with five strikeouts in five at bats. Both players also tied the record for the most strikeouts in any nine-inning game (eight players have fanned six times in a regular-season, extra-inning contest).
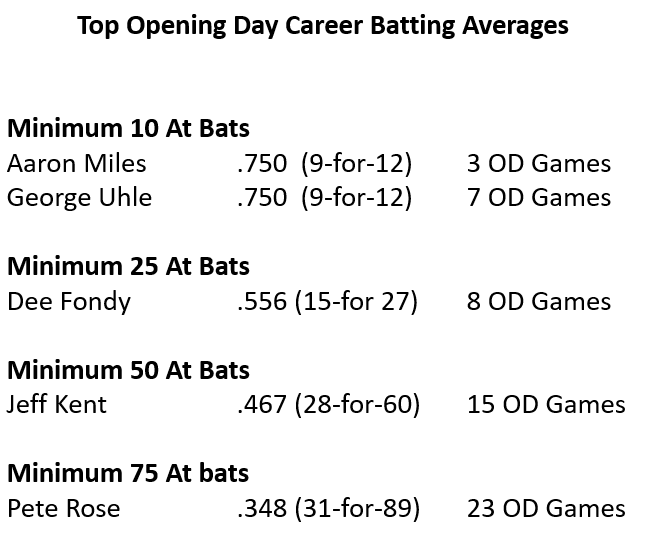
GIVE ME FIVE, BUDDY! … These Players Got a Handful of Hits on Opening Day
In the Modern Era, only 14 MLB players have collected five hits (five is a handful, isn’t it?) in an Opening Day game. Looking for Unicorns within this list, on March 30, 2023, we saw the first (still only) Opening Day in which two players collected five hits (it happened in two different games). The players were Andy Rutschman of the Orioles and George Springer of the Blue Jays. Rutschman also became the first (only) catcher to record a five-hit Opening Day. The most productive of any five-hit opener belongs to Giants’ 2B Jeff Kent, who (on OD 1998) went five-for-seven, with a double, home run, two runs scored and four RBI in a 13-inning, 9-4 Giants win over the Astros.
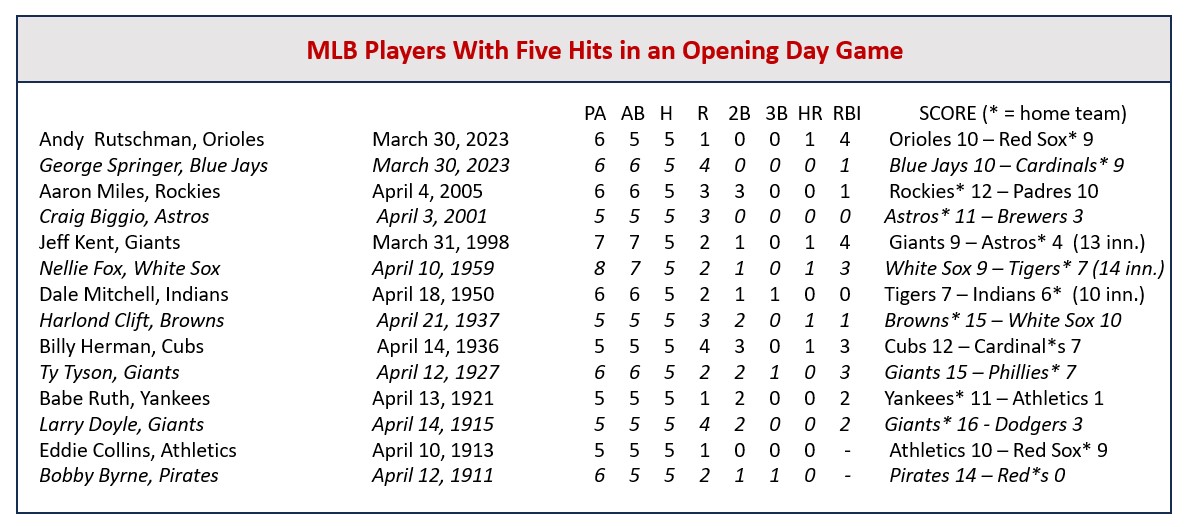
Now, there are some potential trivia tidbits (that you can turn into trivia questions) in this list, but here’s one that intrigues The Roundtable. In a statistical anomaly, seven of the 14 players to enjoy a five-hit Opening Day played the same position. What position was it?
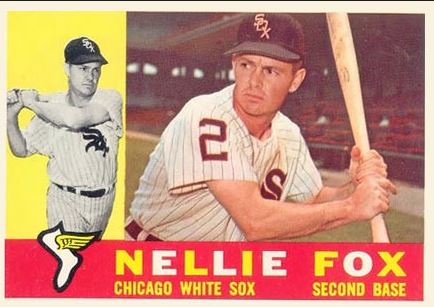
Your answer: Second base and the players were Craig Biggio (2001); Jeff Kent (1998); Nellie Fox (1959); Billy Herman (1936); Aaron Miles (2005); Larry Doyle (1915); and Eddie Collins (1913). For those who like to know such things, the list also includes three left fielders, two third baseman, one right fielder and one catcher. As you might guess, most of these players were batting high in the order: Five leading off, five batting second, two in the three-hole, one at cleanup and one sixth.
DESIGNATED HITTER! I DON’T NEED NO STINKING DH!
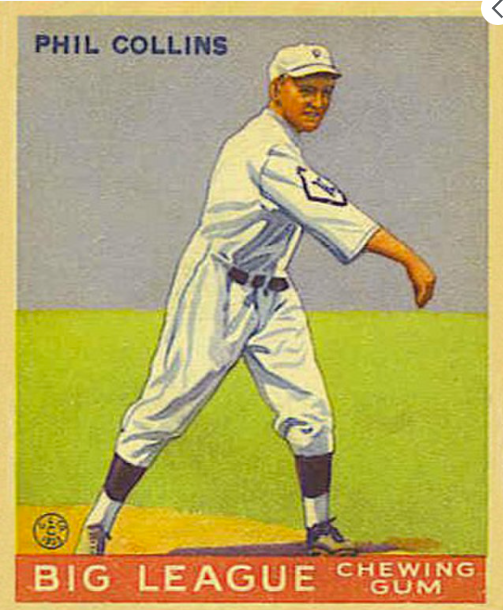
Photo: Goudey, Public domain, via Wikimedia Commons
The highest career batting Opening Day batting average – with no minimum at bats – is 1.000, shared by 142 players. However, 105 of those are one-for-one for their careers on Opening Day. The most at bats for any player with a 1.000 Opening Day career average is four- shared by eight players. Phil Collins – a right-handed pitcher – is the unicorn in that group, the only one with five plate appearances. (He is also one of just two players with a 1.000 Opening Day average and four at bats.)
On April 12, 1932, Collins (coming off a 12-16, 3.86 1931 season) started for the Phillies in their season opened (versus the Giants in New York). Collins picked up the complete-game win, giving up five runs in a 14-5 Phillies win. At the plate, he was even better: four singles and a walk in five plate appearances (the most career plate appearances by any player with a 1.000 career OD average). Collins appeared in one more Opening Day game(1934), but came on in relief and did not bat. Collins was a career .193 hitter (93-for-482). However, for one grand Opening Day, he was, indeed, grand at the plate. For those who like to know such things, Collins was 80-85, 4.66 in eight MLB seasons (1923, 1929-35 … Cubs, Phillies, Cardinals).
____________________________
OPENING DAY STARTS – Another GIMME FIVE!
Gaylord Perry and Bert Blyleven each started on the mound on Opening Day for a record five different franchises.
Blyleven: Rangers; Twins; Indians; Pirates; Angels (12 total OD starts).
Perry: Padres; Indians; Giants; Rangers; Mariners (9 OD starts).
I used the term franchises instead of” teams” because Livan Hernandez started on Opening day for the Expos; Giants; Nationals; Marlins and Twins. However, the Nationals were the old (transported) Expos franchise.
________________________________________________
THREE FOR FOUR … Or, more correctly, four-for-three
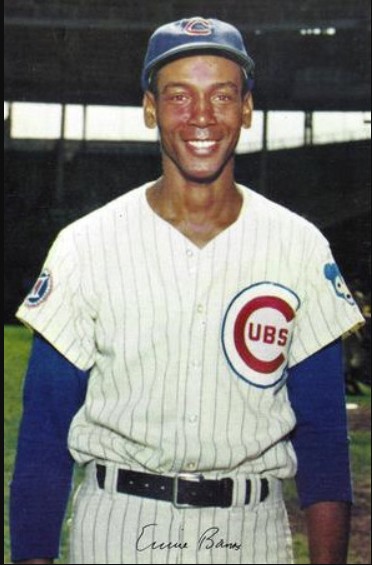
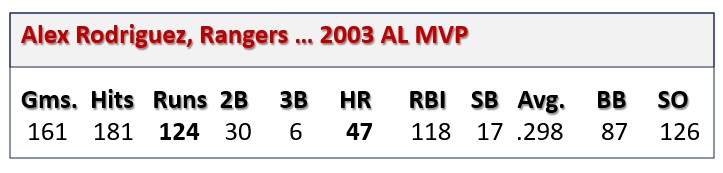
The Opening Day, single-game record of three home runs is shared by four players. The quartet includes: the Blue Jays’ George Bell; Cubs’ Tuffy Rhodes; Tigers’ Dmitri Young; and White Sox’ Matt Davidson. Here’s another anomaly that would make a good trivia question. Three of the four three-homer Opening Day games were logged against the same franchise. Who were the unlucky opponents in those three triple-round tripper openers?
Your answer. The Kansas City Royals. Here are some details.
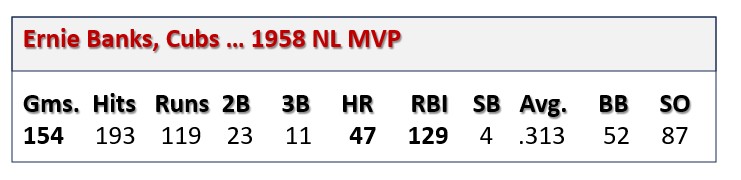
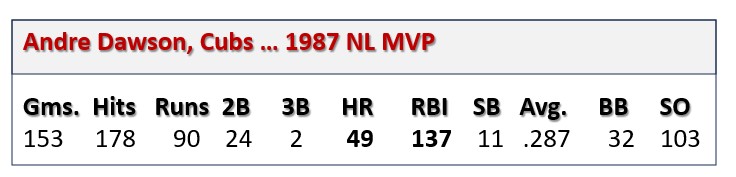
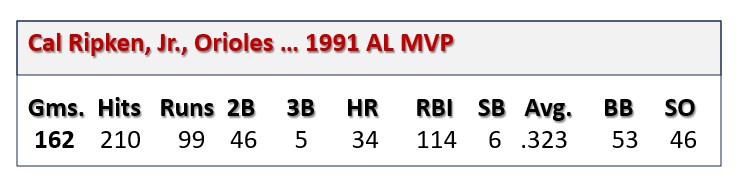
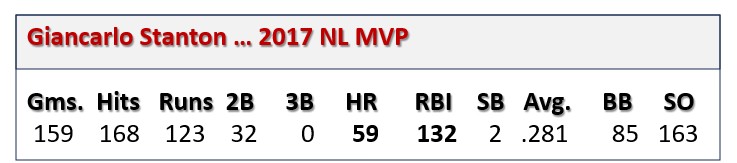
George Bell … On April 4, 1988, Bell – batting clean-up and serving as the DH – became the first major leaguer to hit three home runs in an Opening Day game as his Blue Jays topped the Royals 5-3 in Kansas City. Bell’s power outburst was no surprise. He was coming off a 1987 season in which he hit 47 homers, drove in 134 runs and was the AL MVP. Bell went three-for-four with three runs scored and four RBI, hitting all three home runs off Royals’ starter Brett Saberhagen. Bell Played 12 MLB seasons (1981, 1983-93 … Blue Jays, White Sox), hitting .278-265-1,002.
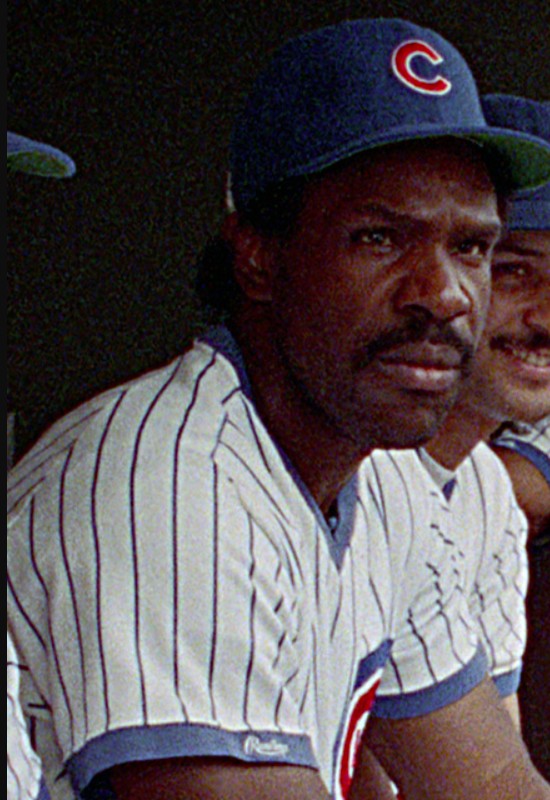
Tuffy Rhodes … On a windy April 4, 1994, Rhodes (leading off and playing CF for the Cubs in Chicago) hit three solo shots off Mets’ starter Dwight Gooden. Rhodes also had a single and a walk in five plate appearances. Despite Rhodes’ record-tying performance, the Cubs lost to the visiting Mets 12-8. At the time, Rhodes had played 107 MLB games in four seasons – hitting a total of five home runs. His MLB career consisted of 225 games in six seasons, with a .224 average and just 13 round trippers (with a high of eight in 1994). Rhodes did go on to hit 474 home runs in eleven seasons in Japan.
Dmitri Young … On April 4, 2005, the Tigers’ Young joined Bell and Rhodes on the list of batters with three home runs in an Opening Day game – as the Tigers topped the Royals 11-2 in Detroit. Young started at DH and went four-for-four with four runs and five RBI. Young, an All Star in 2003 and 2007, hit a total of 21 home runs in 2005 – and 171 in 13 MLB seasons. He hit a career-high 29 round trippers in 2003. Over 13 MLB seasons (1996-2008 … Cardinals, Reds, Tigers, Nationals ), Young hit .292-171-683).
Matt Davidson … On March 29, 2018, as the White Sox topped the Royals 14-7 in Kansas City, DH and (appropriately) cleanup hitter Davidson opened the season with a three-homer, five-RBI game. He went three-for-four with a walk, four runs scored and five RBI. Davidson went deep off three different pitchers: solo shots in the fourth and fifth off Danny Duffy and Blaine Boyer and a three-run blast in the eighth off Brian Flynn. Davidson, in his fourth MLB season, went on to a .228-20-62 campaign. In his 306 MLB games (2013, 2015-18, 2020, 2022 … Diamondbacks, White Sox, Reds, Athletics), Davidson had a .220-54-157 stat line.
Three seems to be the sweet spot for rarity on this one. There have been 114 two-homer Opening Day games. The players with two, two-homer Opening Day contests are: Adam Dunn (2005 & 2007); Juan Gonzalez (1993 & 2001); Eddie Mathews (1954 & 1958); Raul Mondesi (1995 & 1999); Albert Pujols (2006-2010); and Joe Torre (1965 & 1966). None of the players with a three-homer Opening Day game had an additional multi-homer OD contest.
_________________________
A UNICORN OF A WIN
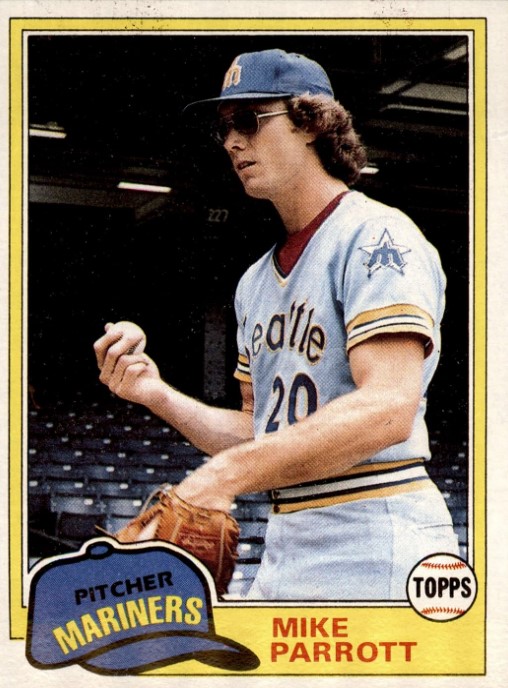 In 1980, Mike Parrott was the Opening Day starter (at home) for the Seattle Mariners – an honor he earned with a 14-12, 3.77 season for the 67-95 Mariners in 1979. He picked up the win, going 6 1/3 innings in an 8-6 Seattle victory over Toronto. Why then Unicorn designation? Parrot would pitch in 26 more games that season (15 more starts) and not record another victory – ending the campaign at 1-16, 7.28. Parrot pitched in five MLB seasons (1977-81, all for the Mariners) – going in 19-39, 4.87.
___________________
HOW ABOUT A LITTLE SUPPORT HERE GUYS?
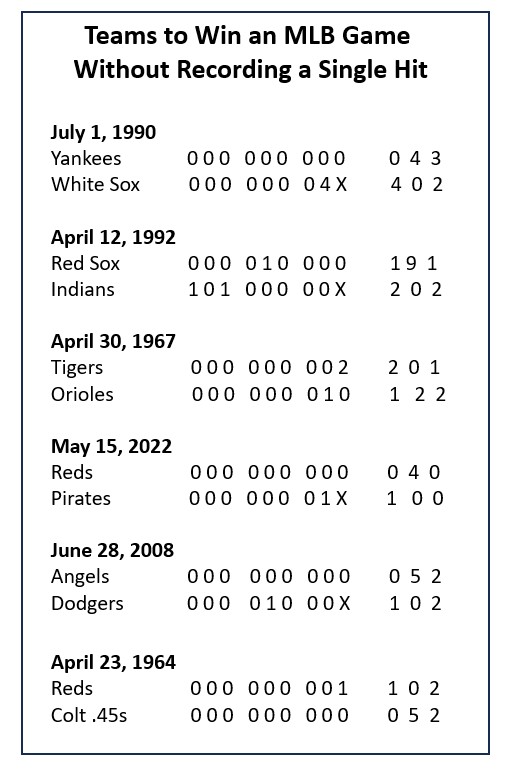
Who was the first MLB pitcher to throw nine no-hit innings in an Opening Day Start? I’ll toss in a little hint here. It’s not the Feller you may be thinking of – and it’s not a good Day to guess.
MLB has seen a pair of Opening Day no-hitters, Bob Feller of the Indians on April 16, 1940 and Leon Day of the of the Newark Eagles (Negro National League II) on May 5, 1946.
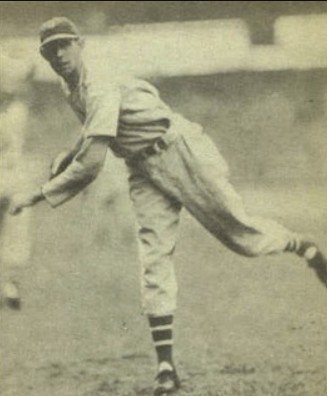
Still, neither of these gentlemen can lay claim to be the first MLB pitcher to throw nine no-hit innings in an Opening Day start. Back on April 15, 1909 – as the Giants opened against the Superbas (Dodgers) in Brooklyn – Giants’ righty Leon “Red” Ames started and, with just the minimum of support, could have made history. Ames held Brooklyn hitless for nine innings, but got nary a run of support from his batsmen. Ames finally gave up a hit with one out in the tenth and, while he kept the shutout going through the 12th inning, eventually lost 3-0 in 13 innings. How the game has changed: Both Ames and Brooklyn starter Irvin “Kaiser” Wilhelm went the distance.
Ames had a 17-season MLB career (1903-10 … Giants, Reds, Cardinals, Phillies), going 183-167, 2.63. His best season was 1905 (Giants), when he went 22-8, 2.74.
_____________________________________
WALK, DON’T RUN
The record for walks received in an Opening Day game is four – shared by 134 players. Of those players, only Mike Cameron can lay claim to two four-walk Openers. On April 2, 2001, playing CF and batting in the two-hole for the Mariners, he drew four walks in five plate appearances as Seattle topped the A’s 5-4 in Seattle. On April 7, 2009, Cameron again drew four walks in five plate appearances in an Opener. This time, he was playing CF and batting sixth for the Brewers, as they lost to the Giants 10-6 in San Francisco.
The career record for OD walks is 19 shared by Barry Bonds (in 91 plate appearances/20 games) and Rickey Henderson (in 92 plate appearances/21 games.) Carlos Santana leads active major-leaguers with 17 OD walks in 15 games.
_________________________________________
PLEASE, (DON’T) GIVE ME A BREAK
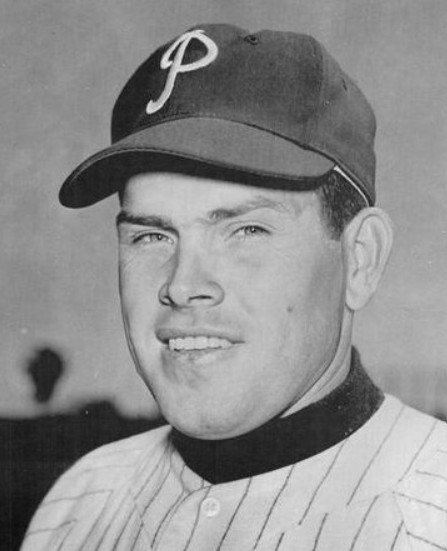
Photo: Manny’s Baseball Land via tradingcarddb.com, Public domain, via Wikimedia Commons
Robin Roberts holds the MLB record for consecutive Opening Day (mound) starts for the same team – 12 for the Phillies from 1950 through 1961. The record for overall consecutive Opening Day (mound) starts belong to Jack Morris at 14 – Tigers (1980-90), Twins (1991), Blue Jays (1992-93). Morris went 8-6. 3.39 in those 14 starts.
Looking for a trivia question? Robin Roberts made 13 Opening Day starts. Those 12 consecutives for the Phillies and one other. Who was that 13th Opening Day start for? The 1966 Astros. Roberts, by the way, went seven innings in that 13th Opening Day start, giving up eight hits and two runs (one earned), walking one and fanning none. He took the loss in a 3-2 game versus the Dodgers (in LA). He was 39 and in his final MLB season at the time. For his career, Roberts was 5-7, 4.03 on Opening Day. For his MLB career (1948-66 … Phillies, Orioles, Astros, Cubs), the Hall of Famer was 286-245, 3.41.
More: How the Game has Changed
In the 1950’s (1950-59), Robin Roberts won 199 games and threw 3,011 2/3 innings – an average of 301 innings pitched per season.
AN UNFORTUNATE BREAK
Hall of Famer Steve Carlton started 14 of the 15 Phillies’ Opening Day games from 1972 through 1986. The one year he missed cost him the record for both overall consecutive Opening Day starts and consecutive Opening Day starts (among pitchers) for the same team. Who was the pitcher who interrupted Carlton’s streak? Hint: Like Carlton, that pitcher is in the Hall of Fame.
In 1976, Jim Kaat (like Carlton, a lefty and future Hall of Famer) got the Opening Day nod from the Phillies. Kaat, at the time, was a three-time 20-game winner, and an All Star for the White Sox the year before (he had been traded to the Phillies in December of 1975). For those who may be wondering whether Carlton’s health played an issue in Kaat’s Opening Day start, Carlton started the second game of the season and went on to a 20-7 record in 35 starts.
Oh, one other tidbit, Tom Seaver holds the record for total opening day (mound) starts with sixteen – 11 for the Mets, three for the Reds and two for the White Sox. Seaver recorded seven wins, two losses and seven no decisions on Opening Day.
OH, WHAT A RELIEF IT IS
There is a four-way tie for the most Opening Day relief appearances at 11: Rollie Fingers; John Franco; Lee Smith; and David Weathers. Among active pitchers, Hector Neris leads the way with nine OD relief appearances.
Rollie Fingers and Francisco Rodriguez are tied for the lead in OD saves, with six.
______________________________________
Both Sides of the Coin
Eleven pitchers have made at least 12 Opening Day appearances and all but one were on the mound to start each of those games. The exception is Dennis Eckersley with 12 OD appearances – seven as a starter and five as a reliever.
____________________________________
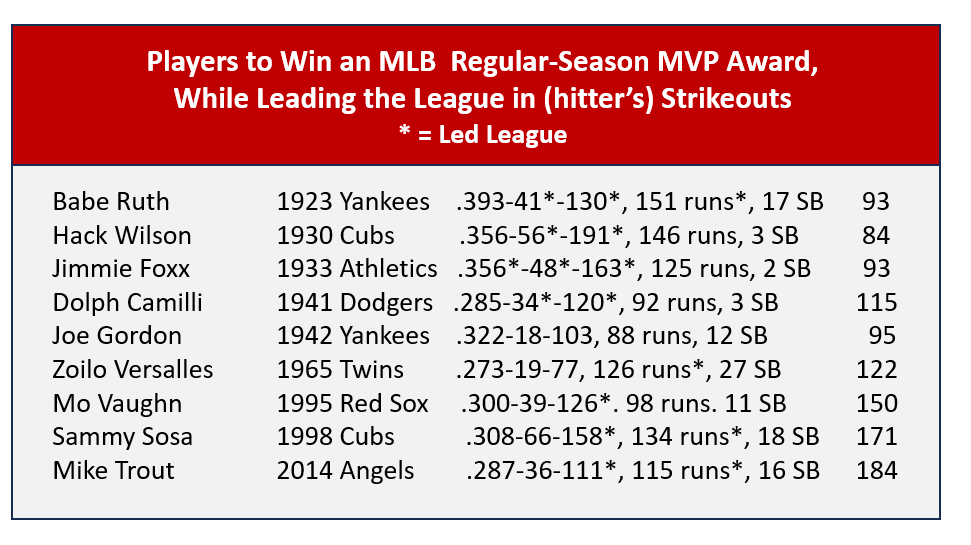
Just A chart for your entertainment.
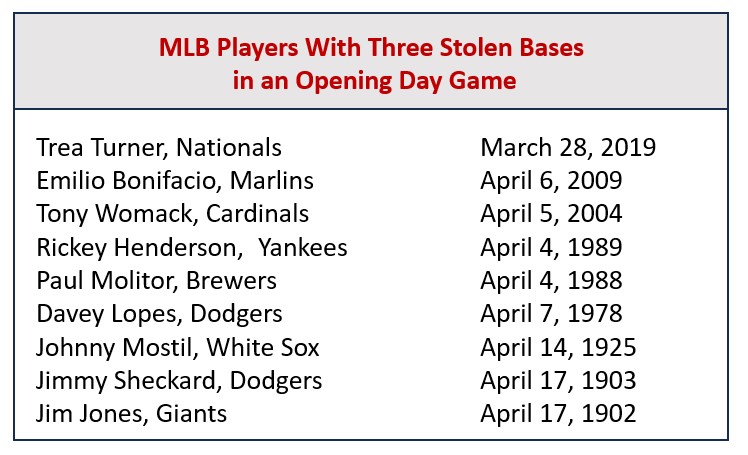
Jim Jones (chart above) stole three bases in three attempts in the 1902 season Opener. Jones then went on to play in 66 more games that season, stealing just four more bases, while being tossed out 13 times.
___________________________________________
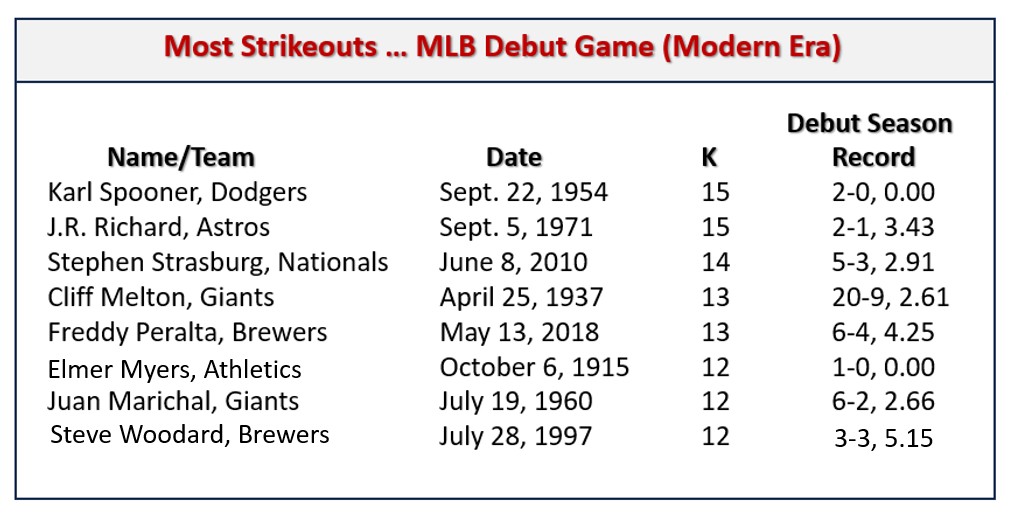
TOSSING YOU A CURVE ON THIS ONE
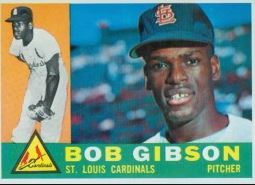
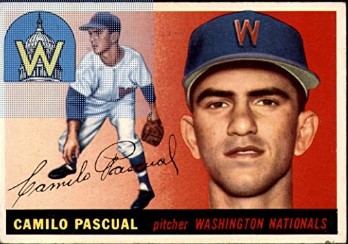
What pitcher holds the mark for the most strikeouts in an Opening Day game? Answer: Camilo Pascual.
 This is a bit of a unicorn, as Pascual’s 15 strikeouts on Opening Day 1960 have never been matched. Three players have fallen just one short of the total: Randy Johnson (twice – 1963 & 1996, Mariners); Don Drysdale (1960 Dodgers); and Shane Bieber ()2020 Indians).
On April 18, 1960, Pascual (known for his sweeping curveball) took the mound at Griffith Stadium for the Washington Senators (against the Boston Red Sox). In 1959, the Senators had finished in last place in the AL, but Pascual had gone 17-10, 2.64, leading the league with 17 complete games and six shutouts. As the Senators’ Opening Day starter in 1960, Pascual picked up right where he left off – tossing a complete game three-hitter, walking three and striking out a still Opening Day record 15 batters in a 10-1 win over the Red Sox. It was one of two 15-whiff games in his career.
Pascual pitched 18 MLB seasons (1954-71 … Senators/Twins, Senators, Reds, Dodgers, Indians), winning 174 and losing 170, with a 3.63 earned run average. He was a five-time All Star, two-time twenty-game winner and led the league in complete games, shutouts and strikeouts three times each.
__________________________________________
ANOTHER WALK DON’T RUN
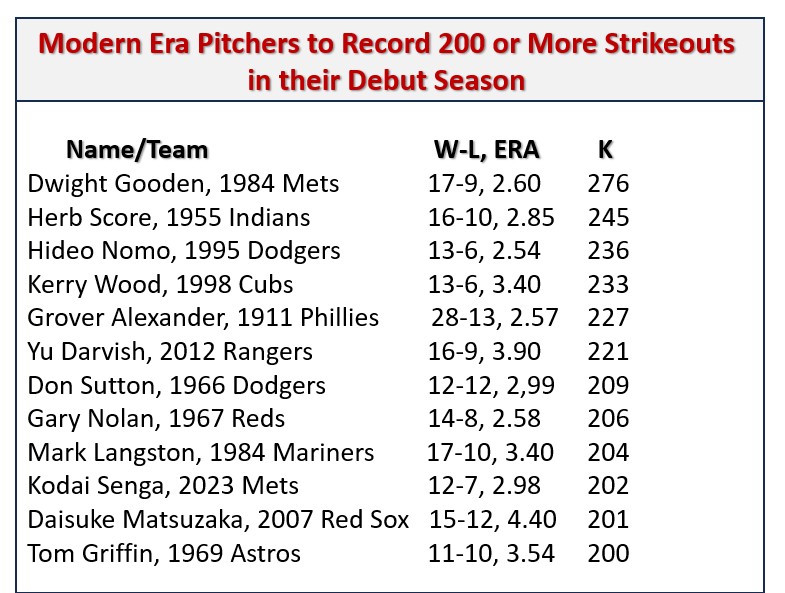
On April 16, 1957, Cleveland southpaw Herb Score set the Opening Day record for pitcher’s walks, delivering eleven free passes to the visiting White Sox. Despite Score’s wildness, it was a close contest, with Score going the distance in a 3-2, 11-inning loss. Score struck out ten and gave up just seven hits and two earned runs – stranding 14 Chicago base runners.
Score was the 1955 AL Rookie of the Year, when the 22-year-old lefty went 16-10. 2.85 and led the league in strikeouts with 245. In 1956, he was even better, going 20-9, 2.53 and again topping the league in whiffs (263). His 1957 season ended on May 7, when he was hit in the face by a line drive off the bat of Yankee Gil McDougald. Score suffered a broken nose, as well as damage to is right cheekbone and right eye. He was hospitalized for about three weeks and did not return to the mound that season.
Score came back in 1958, but suffered an elbow injury early in the season (some wondered if he had changed his delivery after the McDougald incident, but Score denied that – and had been pitching well to that point). At any rate, from 1958 until he retired in 1962, Score was 17-26, 4.43.
The record for Opening Day walks by a pitcher in a nine-inning game, belongs to Nolan Ryan at 10 … and he won the game. On April 5, 1974, Ryan started for the Angels in the Opener (at the White Sox). It was Ryan’s blazer versus Wilbur Wood’s floater. After eight innings, the Angels held an 8-2 lead (scoring five runs in the top of the eighth) and Ryan had given up two runs on four hits, while walking ten and fanning five. He was relieved by Dick Selma, who threw a scoreless ninth.
______________________________
A ROSE BY ANY OTHER NAME
No one played in more Opening Day games then Pete Rose (23 consecutively from 1963-85) … Followed closely by Henry Aaron; Carl Yastrzemski; and at 22. Rose is also the OD all-time leader in hits 31.
WHAT A BABE
Babe Ruth is the All-Time OD leader in:
Runs scored: 22
RBI … 22
Total bases … 55
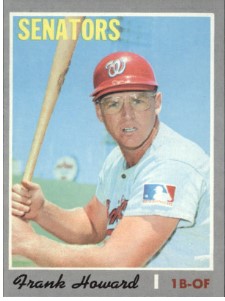
In 18 Opening Day games, he hit .422-7-22, with 22 runs scored. He also had five doubles, a triple and three stolen bases. Only one other MLB player has 20 or more OD RBI – Adam Dunn (.244-8-21 in 13 Openers). In 14 MLB seasons (2001-2014 … Reds, Diamondbacks, Nationals, White Sox, Athletics), Dunn hit .237-462-1,168. Although he hit 4o or more homers in six seasons (five consecutive seasons … 2004-2008), the two-time All Star never led his league in homers.
A PAINFUL WAY TO START THE SEASON
On April 9, 1990, Astros’ first baseman and cleanup hitter Glenn Davis was hit by a pitch an Opening Day record three times. Davis came to the plate six times and never put the ball in play – but still made only one out. Davis (who led the league in HBP that season with eight) was hit by a pitch three times, walked twice and struck out once as the Astros lost to the visiting Reds 8-4. Davis finished Opening Day with a batting average of .000, but an on-base percentage of .833.
Second Inning – Davis, leading off, HBP (on 1-0 count) from Tom Browning;
Third Inning – Davis (one out, none on) hit by a 2-2 pitch from Browning;
Fifth Inning – Five-pitch walk off Tim Layana;
Seventh Inning – Davis fans on three pitches from Norm Charlton;
Ninth Inning: Runner on second two out, Davis intentionally walked by Rob Dibble (score tied at four);
Eleventh Inning: Davis hit by pitch (one out, one on) on a 2-2 pitch from Randy Myers.
Davis played 10 MLB seasons (1984-93 … Astros, Orioles) ), hitting .259, with 190 home runs and 603 RBI. He was hit by a pitch 55 times.
______________________________________
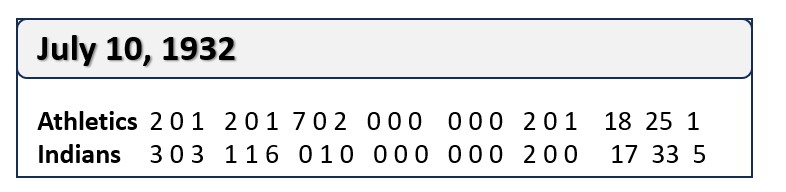
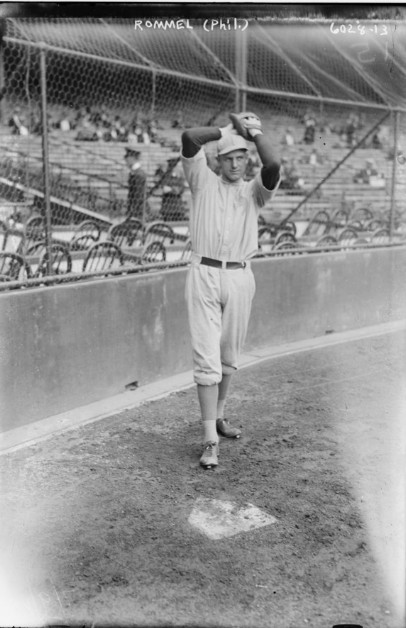
THE LONGEST DAY– 15 SHUTOUT INNINGS
On April 13, 1926, the Senators’ Walter Johnson pitched a 15-inning, complete-game shutout (six hits, three walks, nine strikeouts) as Washington topped the Philadelphia Athletics 1-0 in Washington. The opposing starter, Eddie Rommel tossed the second-most innings in an Opening Day appearance – going 14 1/3, as Washington scored the winning run with one out in the 15th. Johnson, by the way, was 38-years-old at the time.
__________________________________________
YOU CAN’T TOUCH THIS
Jimmy Key holds the record for Opening Day wins without a loss at seven – and he did in the minimum seven starts (Blue Jays, Yankees and Orioles). In those seven wins, he threw 44 1/3 innings, with a 3.05 ERA.
Key played in 15 MLB seasons (1984-98 … Blue Jays, Yankees, Orioles), going 186-117, 3.51. He was a five-time All Star and won 15 or more games in five seasons.
___________________________________
BRINGING THE BOYS HOME SWEET HOME
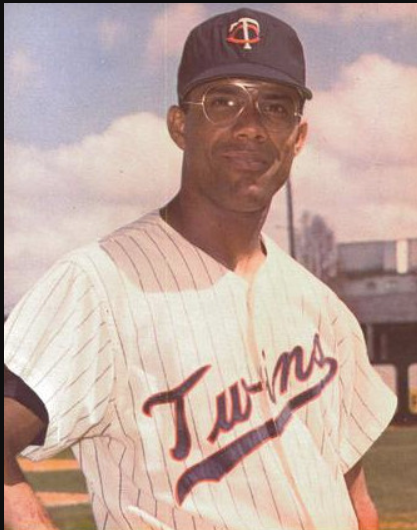
The Opening Day single-game record for RBI (seven) is shared by the Twins’ Brant Alyea and the Cubs’ Corey Patterson.
On April 7, 1970 – in his very first game as a Twin (picked up in an off-season trade with the Senators) – LF Alyea drove in an Opening Day record seven runs as Minnesota topped the White Sox 12-0 in Chicago. Batting fifth, Alyea went four-for-four, with two home runs, two singles and two runs scored. The game, it turned out, would foreshadow a strong April for Alyea. In 17 April games, he hit .415, with seven runs, 23 RBI, four doubles and five home runs. He ended the season at .291-16-61 (the 61 RBI were his career best.)
On March 31, 2003, the Cubs’ CF Patterson tied Alyea’s record. In a 15-2 win over the Mets in New York, Patterson, batting seventh, drove in seven runs, going four-for-six with two home runs and two runs scored. Patterson, a career .252 hitter (12 seasons), was a true Opening Day All Star. In seven Opening Day appearances, Patterson hit .440, with seven runs, 12 RBI and three home runs.
_________________________________________
—THE ROUNDTABLE’S KING OF OPENING DAY-
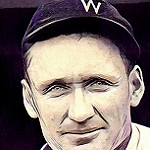
Photo by pingnews.com 
The Washington Senators’ Walter Johnson can be crowned king of the Opening Day hill. In his first-ever Opening Day start (April 14, 1910), the 22-year-old Johnson tossed a 3-0 one-hit shutout against the Philadelphia Athletics. Sixteen years (and 13 Opening Day starts) later, a 38-year-old Johnson fulfilled his last Opening Day assignment with a 15-inning, complete-game, 1-0 win (6 hits, 3 walks, 9 strikeouts) over the A’s. Johnson holds the record for Opening Day records for:
- Pitching victories … nine;
- Shutouts seven; and
- Complete games …. 12 (in 12 starts);
In his 12 Opening Day starts, he threw an OD record 124 innings (yep, averaging 10 1/3 innings per start).
Primary Resources: Baseball-Reference.com; Baseball-Almanac.com; MLB.com
Baseball Roundtable – Blogging Baseball Since 2012.
 Baseball Roundtable is on the Feedspot list of the Top 100 Baseball Blogs. For the full list click here.
I tweet (on X) baseball @DavidBaseballRT. Follow me there for post notifications and links.
Follow Baseball Roundtable’s Facebook Page here.
Member: Society for American Baseball Research (SABR); Negro Leagues Baseball Museum; The Baseball Reliquary.